. 2022 Oct;236(2):433-446.
doi: 10.1111/nph.18323. Epub 2022 Jul 7.

The ecology of palm genomes: repeat-associated genome size expansion is constrained by aridity

Affiliations

The ecology of palm genomes: repeat-associated genome size expansion is constrained by aridity

Rowan J Schley et al. New Phytol. 2022 Oct.

Abstract

Genome size varies 2400-fold across plants, influencing their evolution through changes in cell size and cell division rates which impact plants' environmental stress tolerance. Repetitive element expansion explains much genome size diversity, and the processes structuring repeat 'communities' are analogous to those structuring ecological communities. However, which environmental stressors influence repeat community dynamics has not yet been examined from an ecological perspective. We measured genome size and leveraged climatic data for 91% of genera within the ecologically diverse palm family (Arecaceae). We then generated genomic repeat profiles for 141 palm species, and analysed repeats using phylogenetically informed linear models to explore relationships between repeat dynamics and environmental factors. We show that palm genome size and repeat 'community' composition are best explained by aridity. Specifically, Ty3-gypsy and TIR elements were more abundant in palm species from wetter environments, which generally had larger genomes, suggesting amplification. By contrast, Ty1-copia and LINE elements were more abundant in drier environments. Our results suggest that water stress inhibits repeat expansion through selection on upper genome size limits. However, elements that may associate with stress-response genes (e.g. Ty1-copia) have amplified in arid-adapted palm species. Overall, we provide novel evidence of climate influencing the assembly of repeat 'communities'.

Keywords: Arecaceae (palms); adaptation; ecology; genome size; phylogenetic regression; plant evolution; trait evolution; transposable elements.


Figures

Fig. 1
Fig. 1
Summary of the similarities between repeats in a genome and organisms within an ecological community. Repeat sequences are shown as bands along two chromosomes of a hypothetical species with n = 2 (left), with the colour of each band representing a specific repeat lineage. The number of bands with the same colour represent the copy number of that repeat lineage. Similarly, four species of organisms are shown in the simplified ecological community (right), with the shape and colour of an icon representing the species, and the number of each icon representing the number of individuals of that species. The box (inset) shows how the similarities between repeat lineages in genomes and species in ecological communities allow the use of similar descriptive metrics. In this simple example, there are 11 individuals (i.e. copies) in total belonging to four species (i.e. repeat lineages). Therefore, the Shannon–Wiener diversity index can be calculated for both genomes and ecological communities, giving a value 1.26 in the figure. Please refer to Supporting Information Methods S1 for the formulae used to calculate these indices.
Fig. 2
Fig. 2
Phylogenetic tree of the Arecaceae (Faurby et al., 2016), with genome size data (1C‐values in gigabase pairs (Gbp)) for 472 species displayed as bars. Bars are coloured according to the palm subfamily to which each taxon belongs, and a 30 Gbp genome size bar is shown for scale. The four known polyploid palm species are indicated with asterisks (*). Photographs show palm species from each subfamily: (a) Cocos nucifera (Arecoideae) © James St. John; (b) Calamus hirsutus subsp. korthalsii (Calamoideae) © William J. Baker; (c) Nypa fruticans (Nypoideae) © William J. Baker; (d) Bismarkia nobilis (Coryphoideae) © William J. Baker; (e) Ceroxylon quindiuense (Ceroxyloideae) © Alejandro Bayer.
Fig. 3
Fig. 3
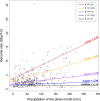
Quantile regression plot with slopes describing the relationship between genome size and aridity preference (precipitation of the driest month) across five quantiles of genome size in palms (Arecaceae). Lines are shown for conditional quantiles estimated using different quantile values (‘τ’), where τ = 0.1 corresponds to 10th quantile, τ = 0.25 to the 25th, τ = 0.5 to the 50th, τ = 0.75 to the 75th and τ = 0.9 to the 90th quantile. The colour of each line corresponds to the quantile value ‘τ’ used to make each estimate, which are detailed in the legend in the top right of the plot. Each line is labelled with its corresponding equation in the format ‘mx + c’, where m corresponds to the slope estimate and c corresponds to the intercept estimate of each line.
Fig. 4
Fig. 4
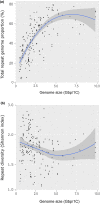
Scatterplots showing relationships between (a) total genome proportion occupied by repeats and (b) repeat diversity (Shannon–Wiener index) with genome size for each of the 141 palm species whose repeat compositions were analysed with RepeatExplorer2. Conditional means are shown by the blue line, calculated using Loess smoothing in ggplot2, and 95% confidence intervals are shown by the grey shading around the lines.

References

    1. Andrews S. 2010. Fastqc: a quality control tool for high throughput sequence data. v.0.11.9 . Cambridge, UK. [WWW document] URL http://www.bioinformatics.babraham.ac.uk/projects/fastqc [accessed 1 January 2020].
    1. Baker WJ, Dransfield J. 2016. Beyond genera Palmarum: progress and prospects in palm systematics. Botanical Journal of the Linnean Society 182: 207–233.
    1. Barrett CF, McKain MR, Sinn BT, Ge X, Zhang Y, Antonelli A, Bacon CD. 2019. Ancient polyploidy and genome evolution in palms. Genome Biology and Evolution 11: 1501–1511. - PMC - PubMed
    1. Barton K, Barton MK. 2015. Package ‘mumin’. v.1 . [WWW document] URL https://cran.r‐project.org/web/packages/MuMIn/index.html [accessed 1 January 2020].
    1. Beaulieu JM, Leitch IJ, Patel S, Pendharkar A, Knight CA. 2008. Genome size is a strong predictor of cell size and stomatal density in angiosperms. New Phytologist 179: 975–986. - PubMed

Publication types

LinkOut - more resources