

Population Immunity to Pre-Omicron and Omicron Severe Acute Respiratory Syndrome Coronavirus 2 Variants in US States and Counties Through 1 December 2021
- PMID: 35717642
- PMCID: PMC9214178
- DOI: 10.1093/cid/ciac438
Population Immunity to Pre-Omicron and Omicron Severe Acute Respiratory Syndrome Coronavirus 2 Variants in US States and Counties Through 1 December 2021
Abstract
Background: Both severe acute respiratory syndrome coronavirus 2 (SARS-CoV-2) infection and coronavirus disease 2019 (COVID-19) vaccination contribute to population-level immunity against SARS-CoV-2. This study estimated the immunological exposure and effective protection against future SARS-CoV-2 infection in each US state and county over 2020-2021 and how this changed with the introduction of the Omicron variant.
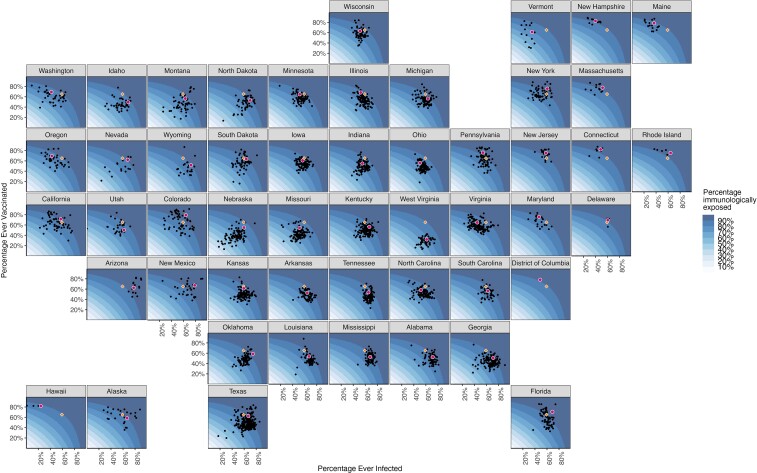
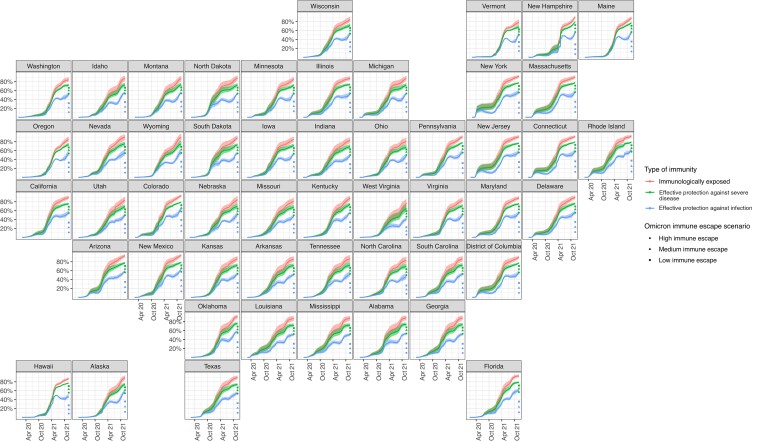
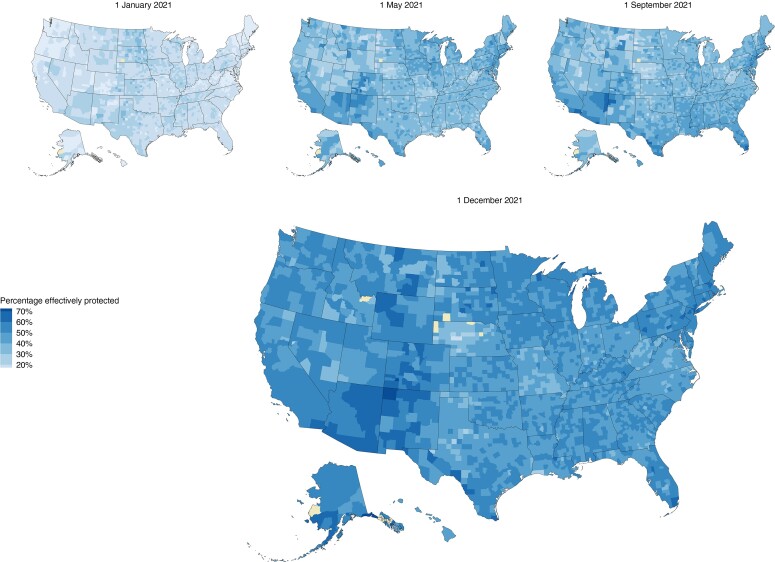
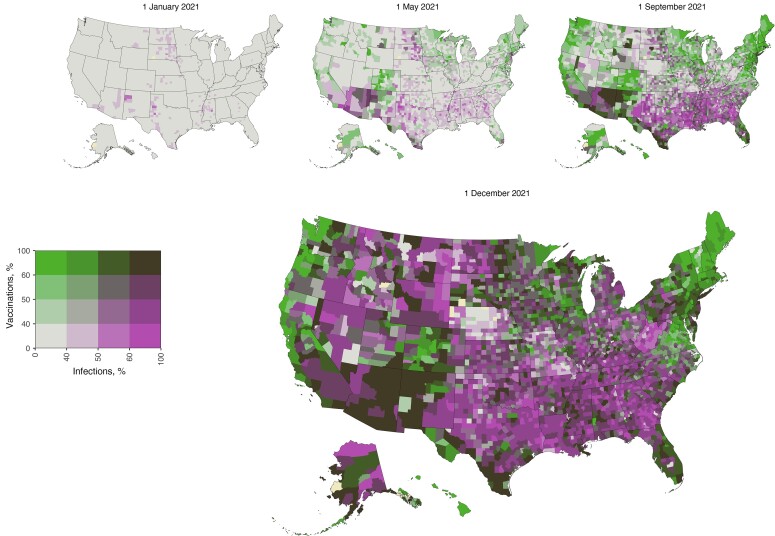
Methods: We used a Bayesian model to synthesize estimates of daily SARS-CoV-2 infections, vaccination data and estimates of the relative rates of vaccination conditional on infection status to estimate the fraction of the population with (1) immunological exposure to SARS-CoV-2 (ever infected with SARS-CoV-2 and/or received ≥1 doses of a COVID-19 vaccine), (2) effective protection against infection, and (3) effective protection against severe disease, for each US state and county from 1 January 2020 to 1 December 2021.
Results: The estimated percentage of the US population with a history of SARS-CoV-2 infection or vaccination as of 1 December 2021 was 88.2% (95% credible interval [CrI], 83.6%-93.5%). Accounting for waning and immune escape, effective protection against the Omicron variant on 1 December 2021 was 21.8% (95% CrI, 20.7%-23.4%) nationally and ranged between 14.4% (13.2%-15.8%; West Virginia) and 26.4% (25.3%-27.8%; Colorado). Effective protection against severe disease from Omicron was 61.2% (95% CrI, 59.1%-64.0%) nationally and ranged between 53.0% (47.3%-60.0%; Vermont) and 65.8% (64.9%-66.7%; Colorado).
Conclusions: While more than four-fifths of the US population had prior immunological exposure to SARS-CoV-2 via vaccination or infection on 1 December 2021, only a fifth of the population was estimated to have effective protection against infection with the immune-evading Omicron variant.
Keywords: SARS-CoV-2; effective protection; immunological exposure.
© The Author(s) 2022. Published by Oxford University Press on behalf of Infectious Diseases Society of America.
Conflict of interest statement
Potential conflicts of interest . M. H. C. reports support for attending meetings and/or travel from the World Health Organization Global Task Force on TB Impact Measurement. V. E. P. reports grants to her institution, unrelated to this work, from the Bill & Melinda Gates Foundation, the Centers for Disease Control and Prevention, Gavi, the Vaccine Alliance, and the National Institute of Allergy and Infectious Diseases, National Institutes of Health; is an unpaid member of the World Health Organization’s Immunization and Vaccines Related Implementation Research Advisory Committee; and has received reimbursement from Merck and Pfizer for travel expenses to Scientific Input Engagements unrelated to the current work (<$500). N. A. S. reports grants or contracts, unrelated to the current work, from the Centers for Disease Control and Prevention and the National Institutes of Health. N. A. M. reports grants or contracts to their institution, unrelated to the current work from Bill & Melinda Gates Foundation, the European Commission, the World Health Organization, and USAID; consulting fees paid to the author from the World Health Organization and the Global Fund to Fight AIDS TB and Malaria; and support for attending meetings and/or travel from the Bill & Melinda Gates Foundation. All other authors report no potential conflicts. All authors have submitted the ICMJE Form for Disclosure of Potential Conflicts of Interest. Conflicts that the editors consider relevant to the content of the manuscript have been disclosed.
Figures
Update of
-
Population immunity to pre-Omicron and Omicron SARS-CoV-2 variants in US states and counties through December 1, 2021.medRxiv [Preprint]. 2022 Mar 1:2021.12.23.21268272. doi: 10.1101/2021.12.23.21268272. medRxiv. 2022. Update in: Clin Infect Dis. 2023 Feb 8;76(3):e350-e359. doi: 10.1093/cid/ciac438. PMID: 34981078 Free PMC article. Updated. Preprint.
References
-
- The New York Times . Coronavirus in the U.S.: latest map and case count. 2021. Available at: https://www.nytimes.com/interactive/2021/us/covid-cases.html. Accessed 1 December 2021.
-
- Washington Post . U.S. coronavirus cases and state maps: tracking cases, deaths. 2021. Available at: https://www.washingtonpost.com/graphics/2020/national/coronavirus-us-cas.... Accessed 1 December 2021.
-
- The COVID Tracking Project . 2021. Available at: https://covidtracking.com/. Accessed 29 October 2021.
Publication types
MeSH terms
Substances
Supplementary concepts
Grants and funding
LinkOut - more resources
Full Text Sources
Medical
Miscellaneous
