

Life expectancy by county, race, and ethnicity in the USA, 2000-19: a systematic analysis of health disparities
- PMID: 35717994
- PMCID: PMC9256789
- DOI: 10.1016/S0140-6736(22)00876-5
Life expectancy by county, race, and ethnicity in the USA, 2000-19: a systematic analysis of health disparities
Abstract
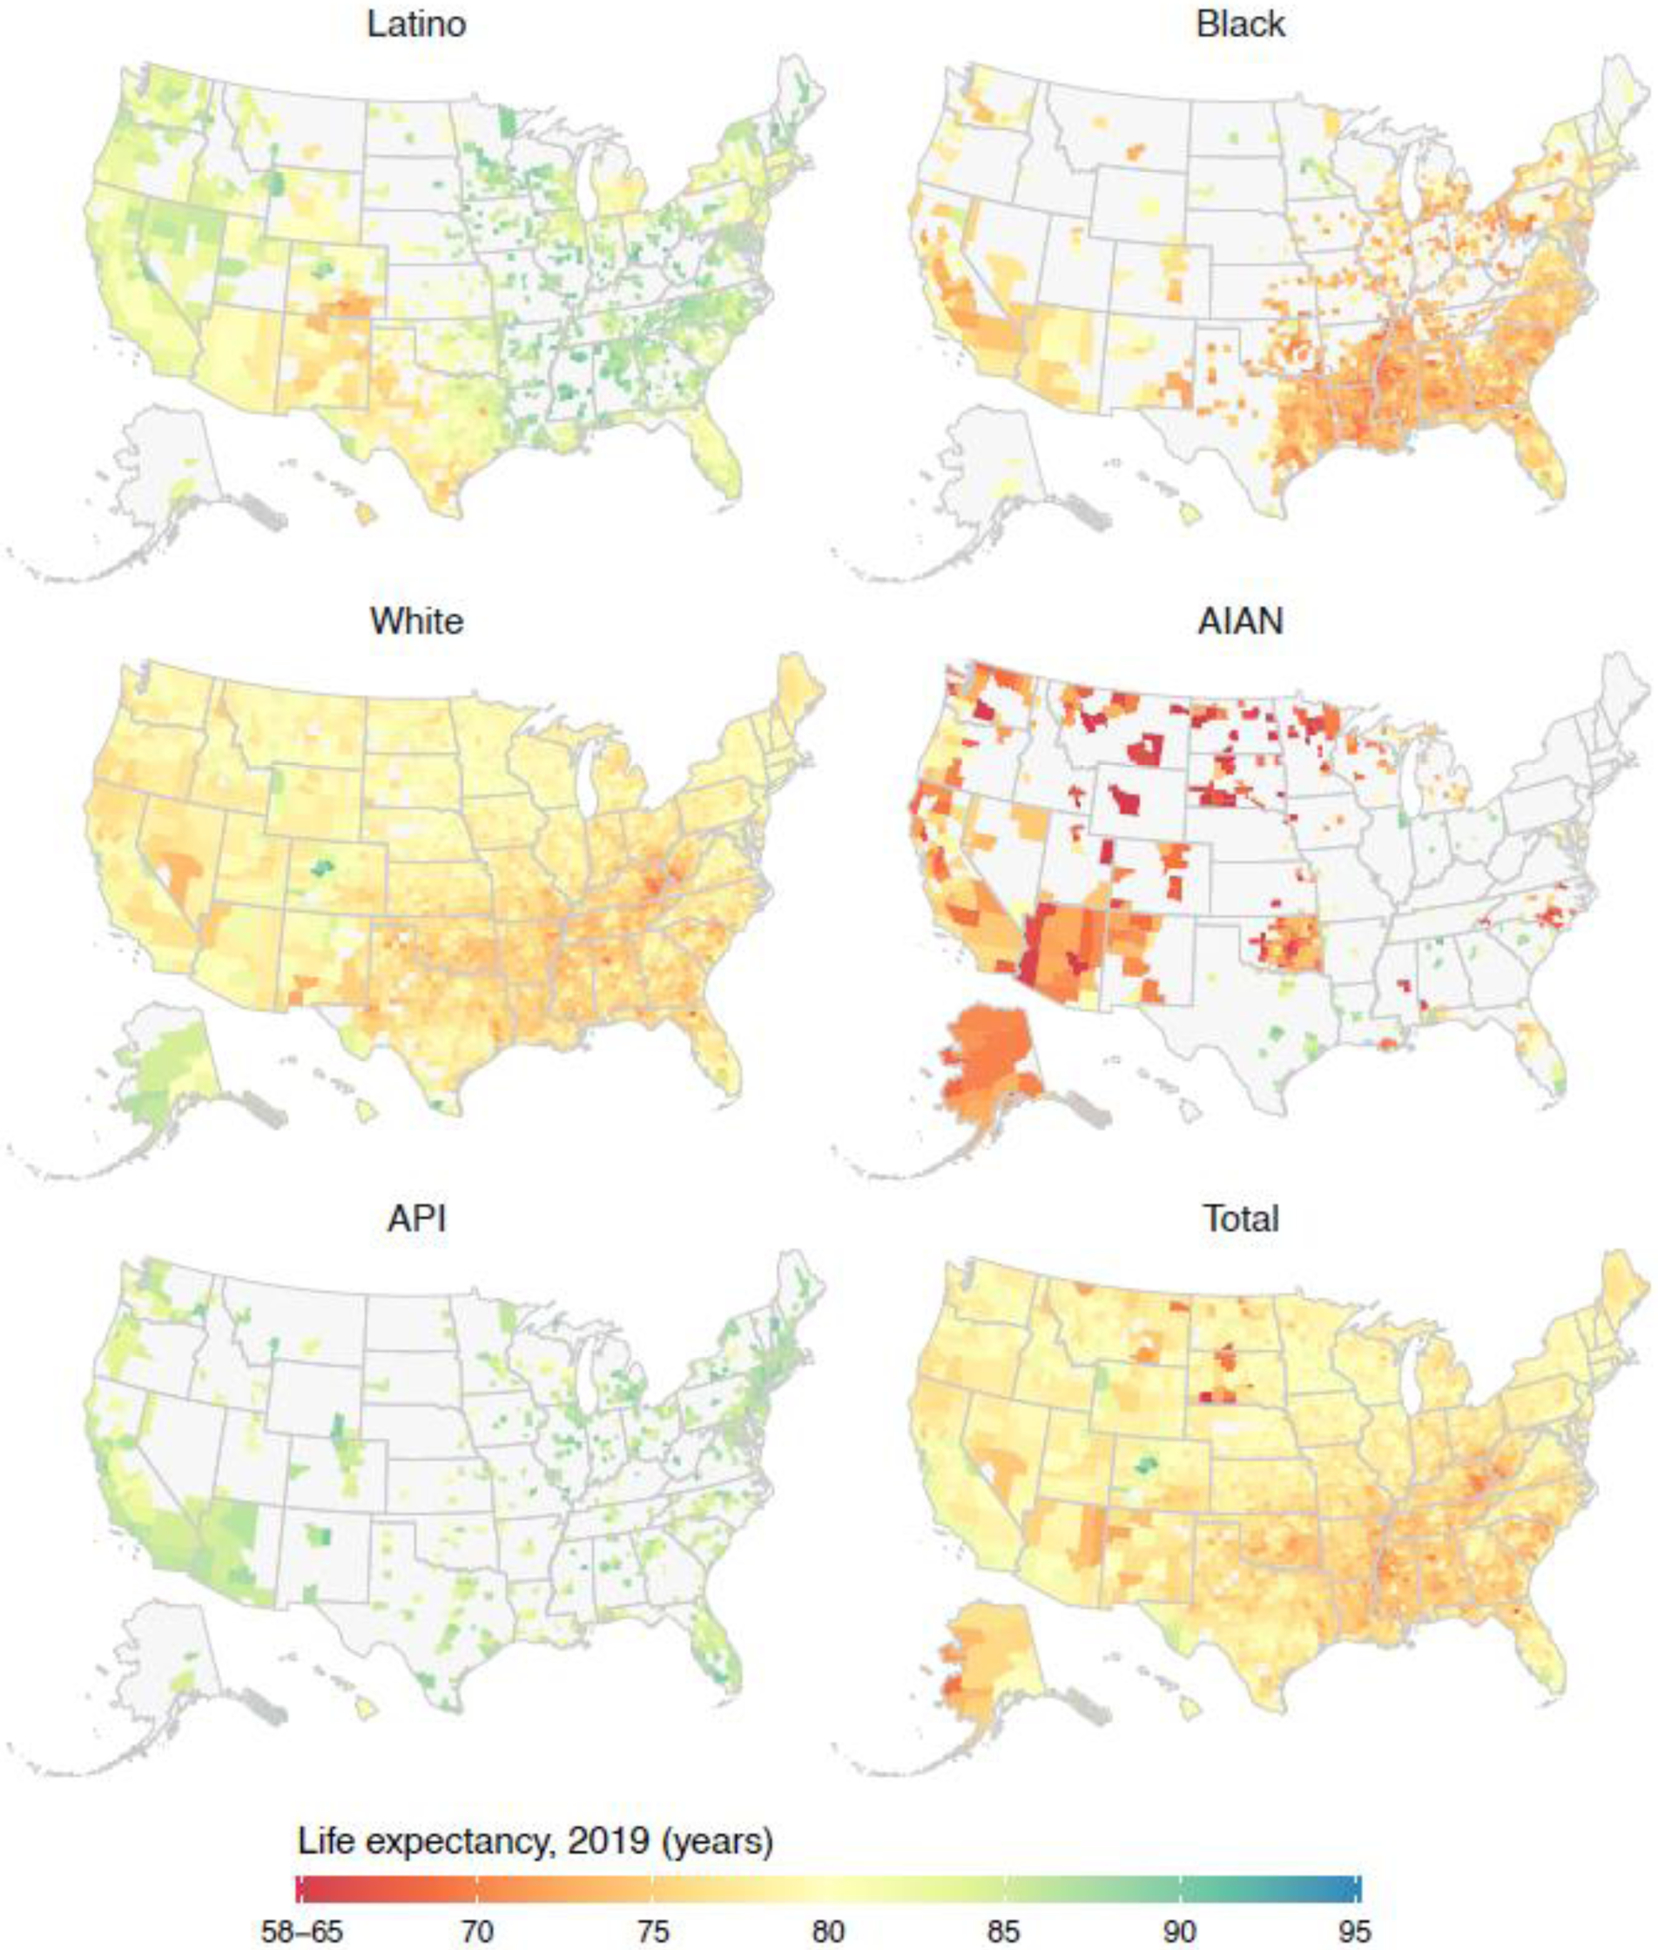
Background: There are large and persistent disparities in life expectancy among racial-ethnic groups in the USA, but the extent to which these patterns vary geographically on a local scale is not well understood. This analysis estimated life expectancy for five racial-ethnic groups, in 3110 US counties over 20 years, to describe spatial-temporal variations in life expectancy and disparities between racial-ethnic groups.
Methods: We applied novel small-area estimation models to death registration data from the US National Vital Statistics System and population data from the US National Center for Health Statistics to estimate annual sex-specific and age-specific mortality rates stratified by county and racial-ethnic group (non-Latino and non-Hispanic White [White], non-Latino and non-Hispanic Black [Black], non-Latino and non-Hispanic American Indian or Alaska Native [AIAN], non-Latino and non-Hispanic Asian or Pacific Islander [API], and Latino or Hispanic [Latino]) from 2000 to 2019. We adjusted these mortality rates to correct for misreporting of race and ethnicity on death certificates and then constructed abridged life tables to estimate life expectancy at birth.
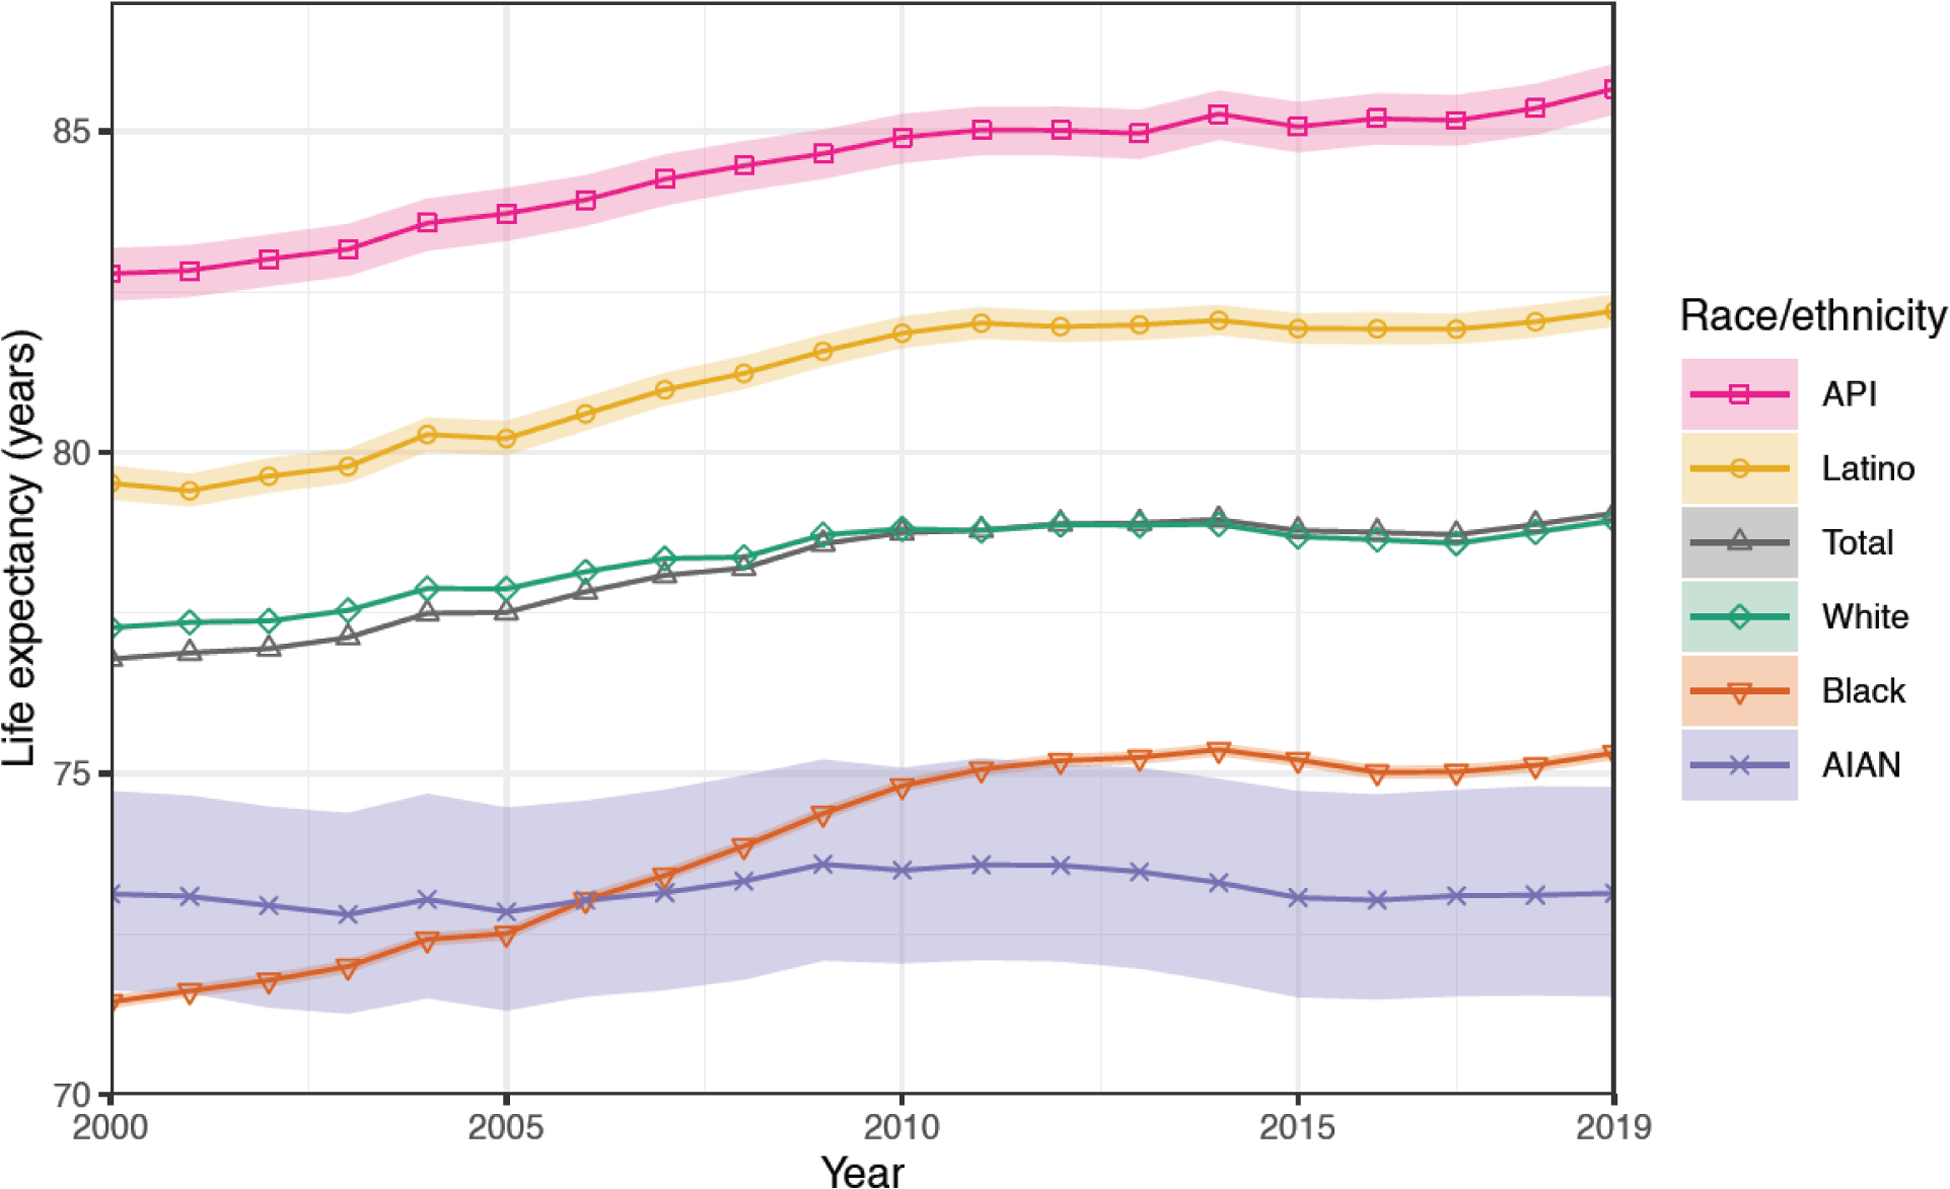
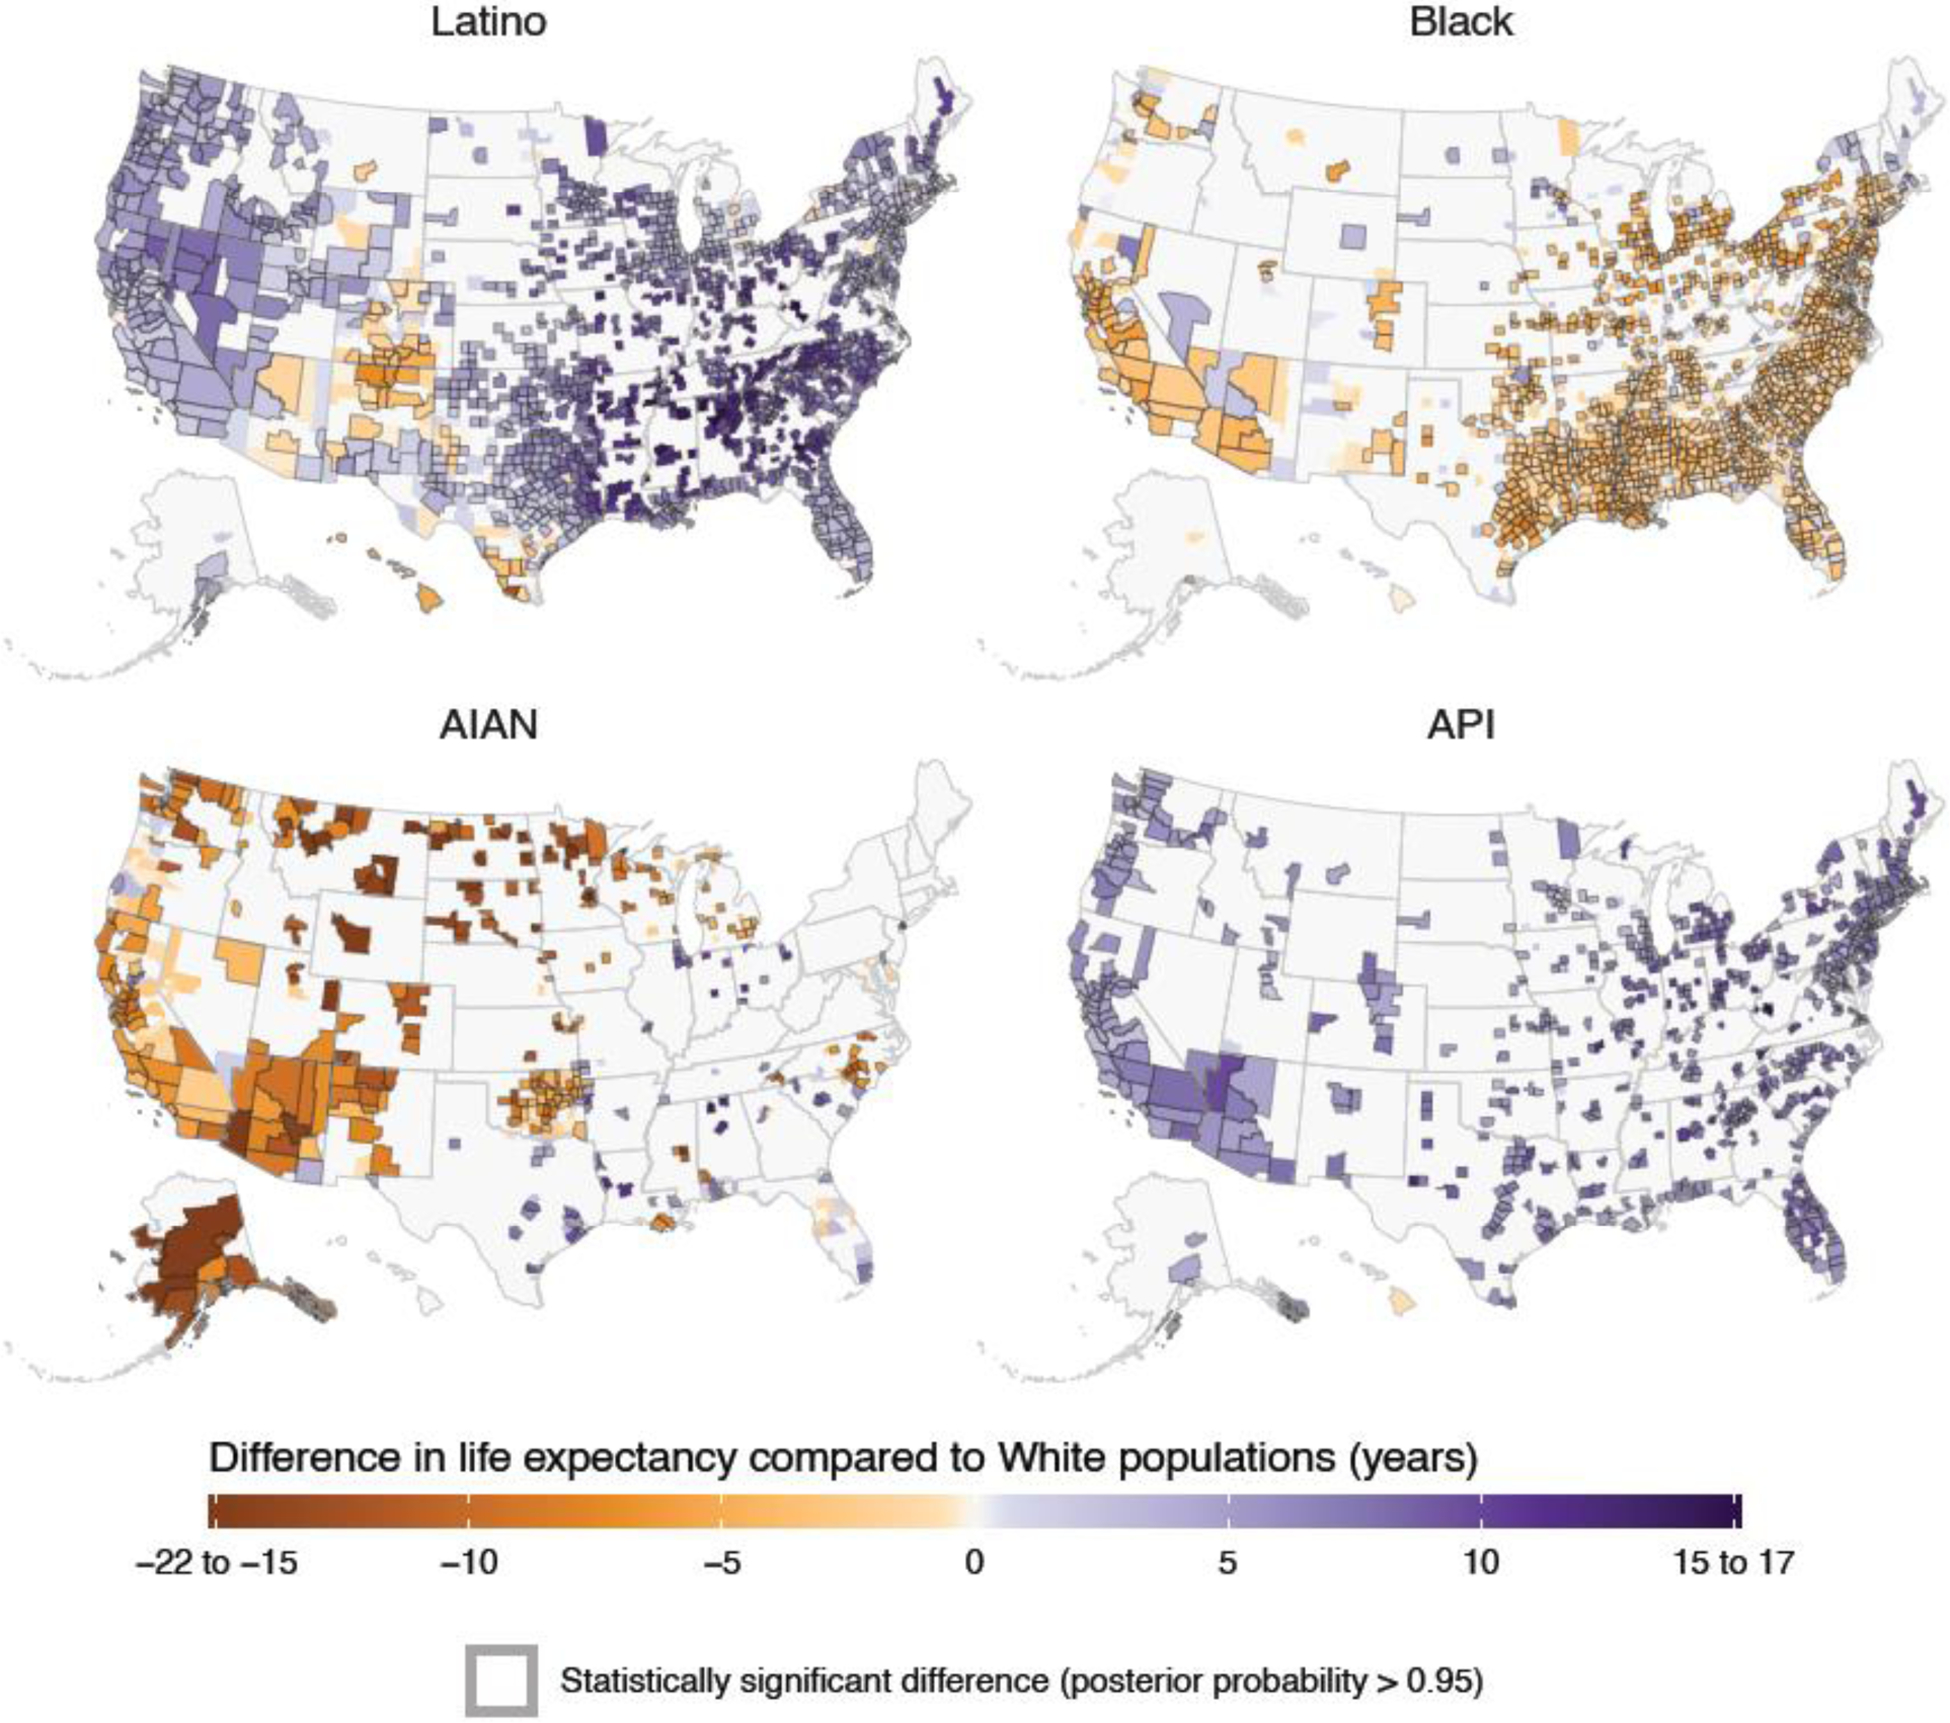
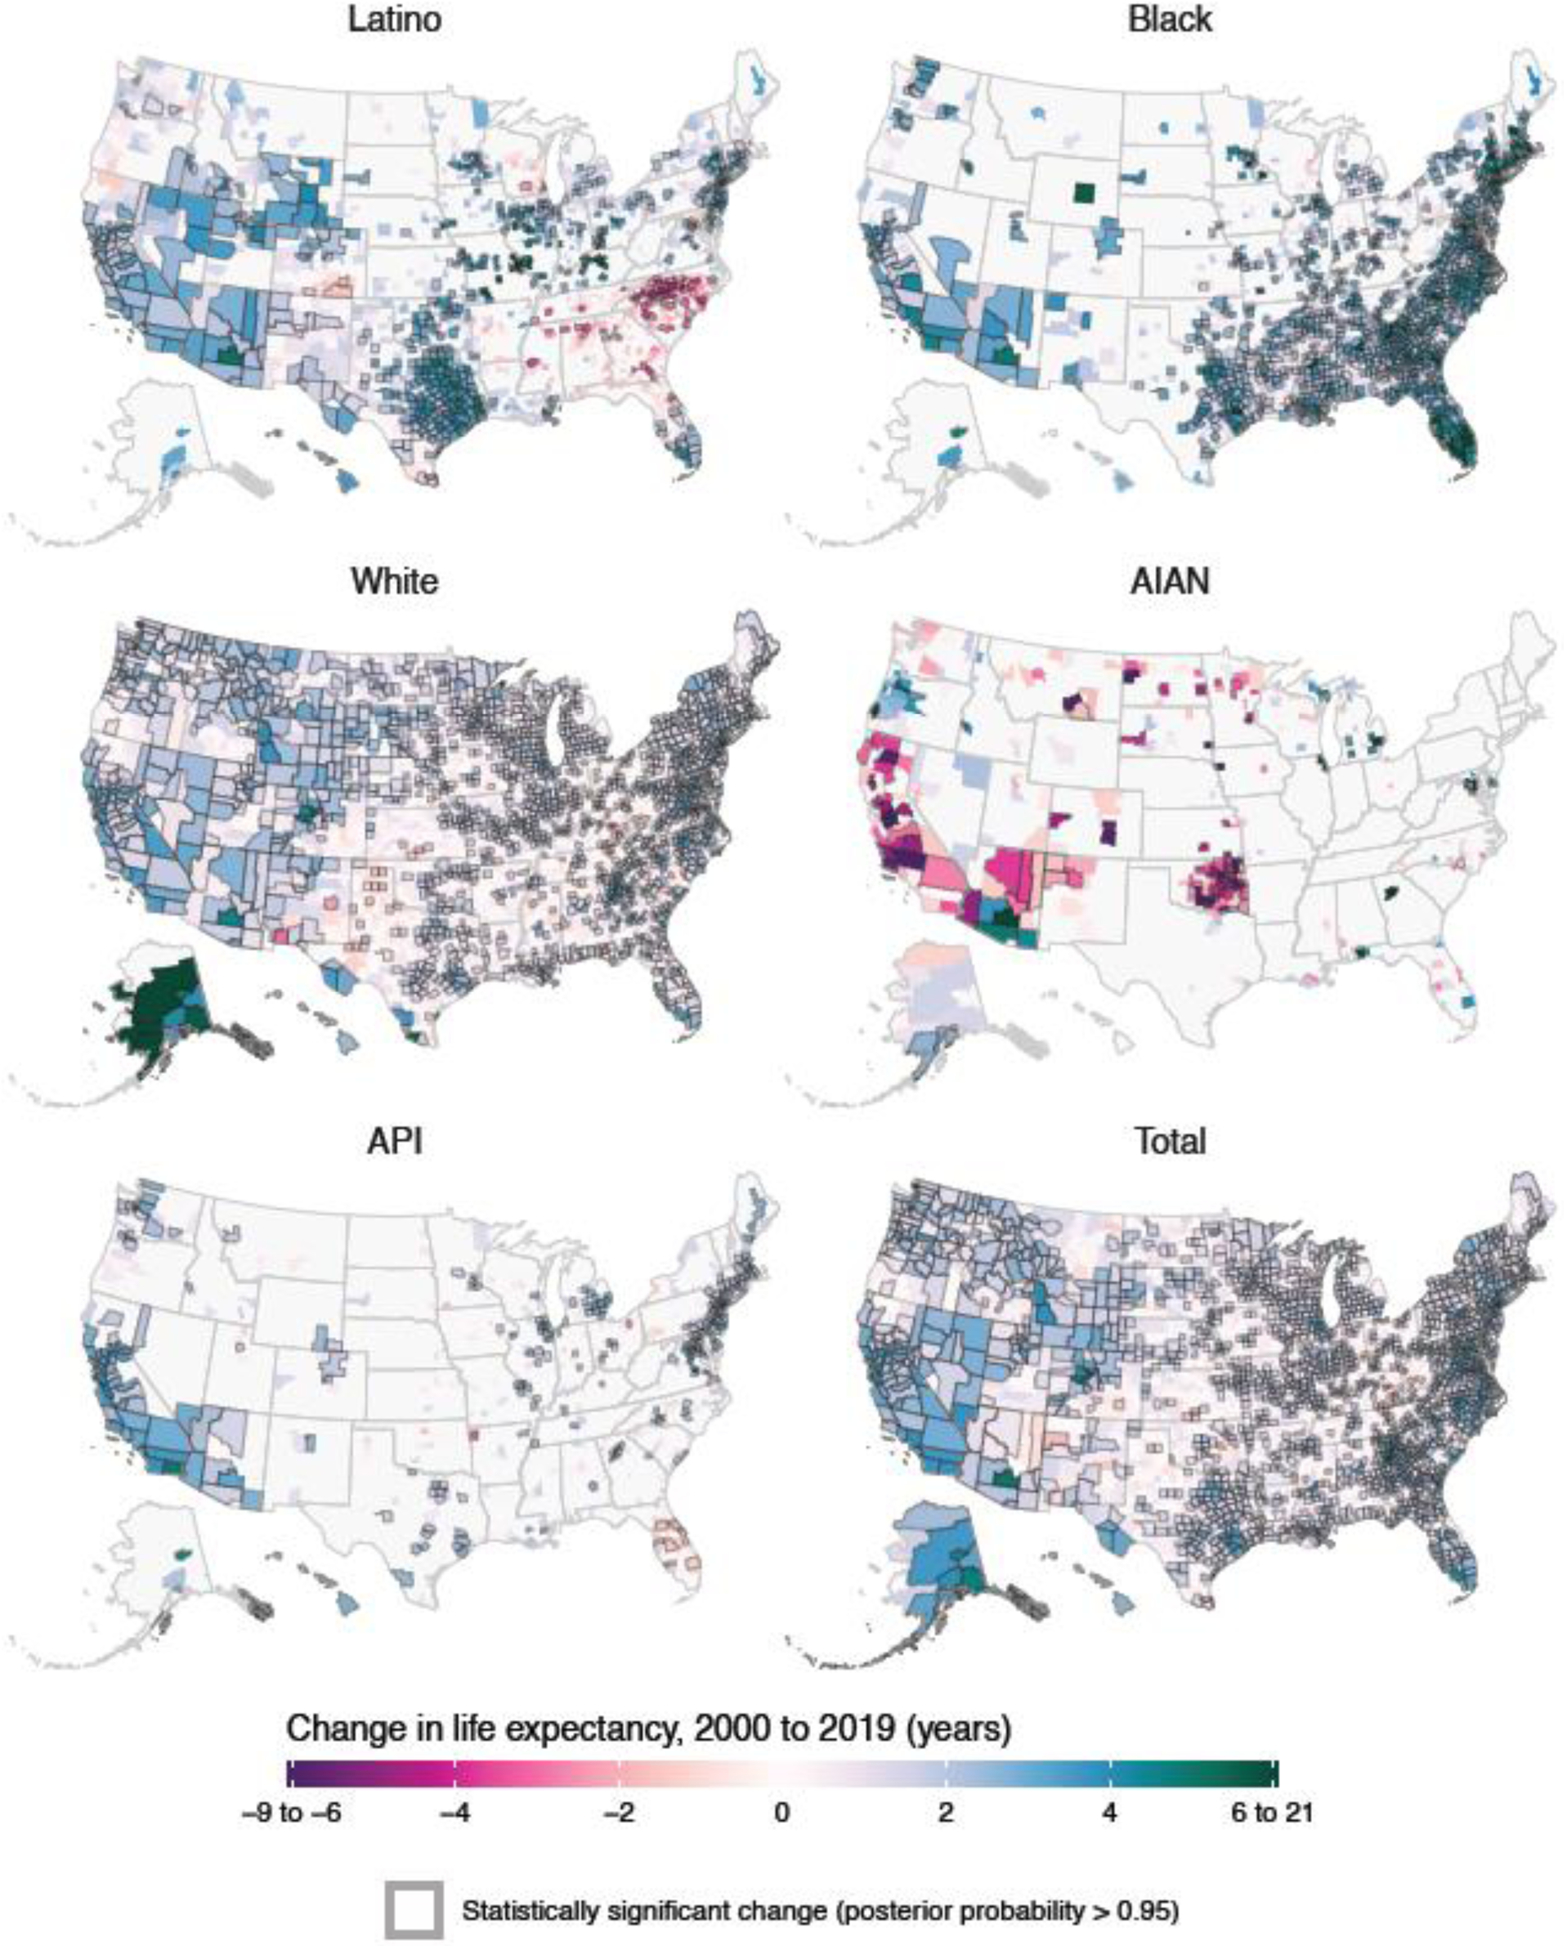
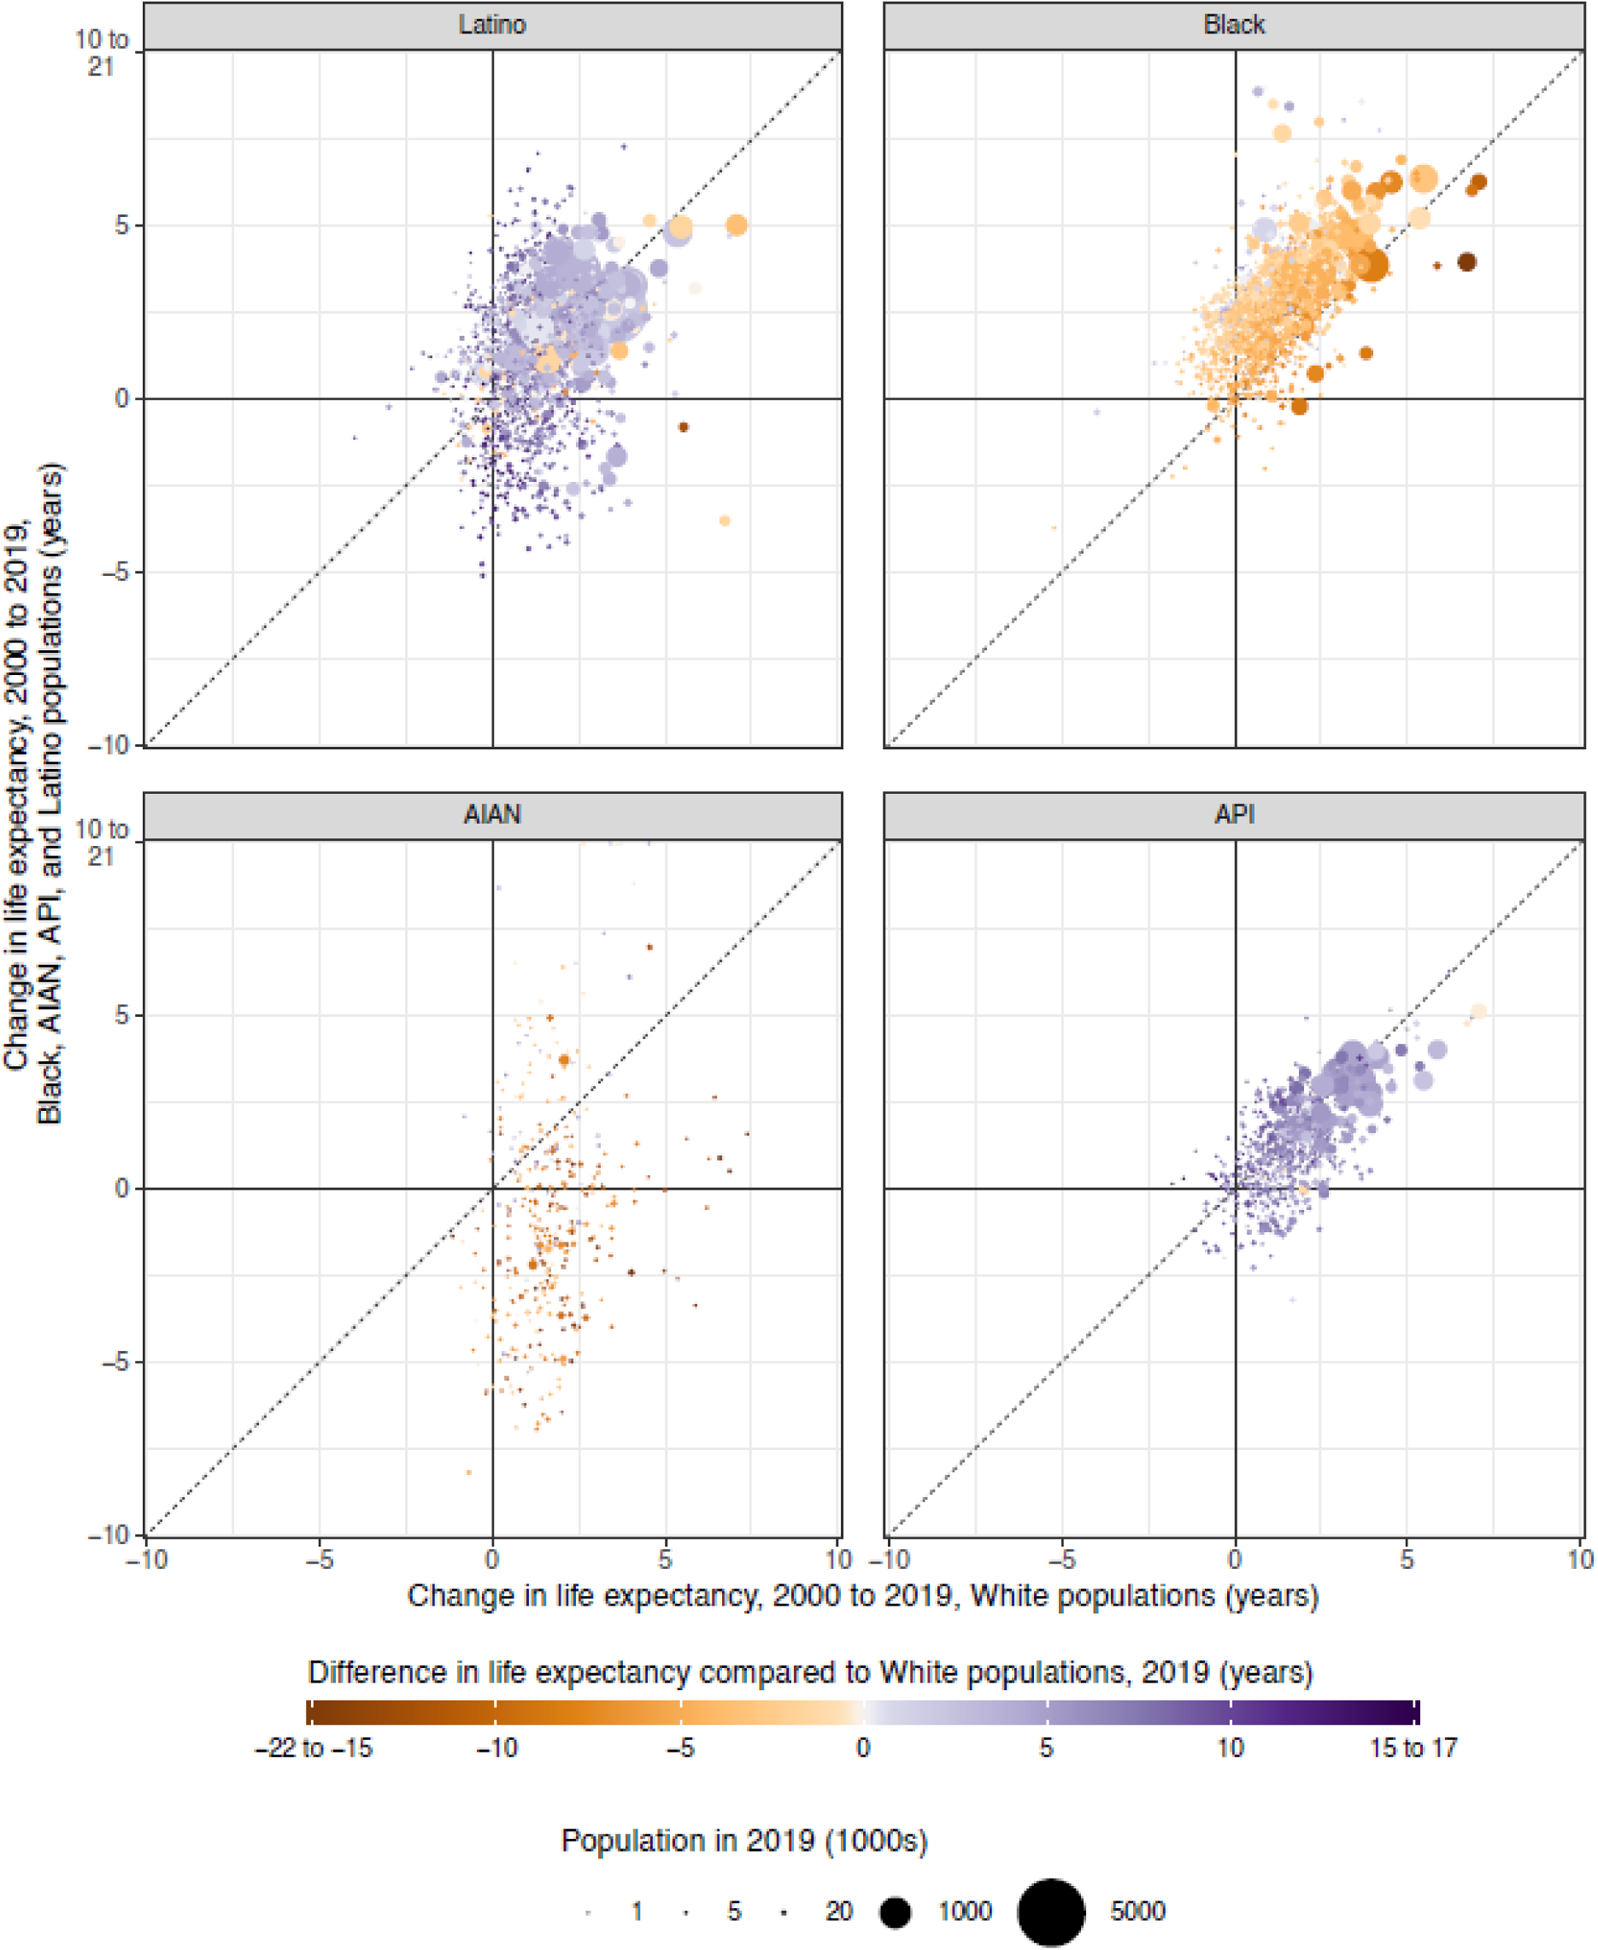
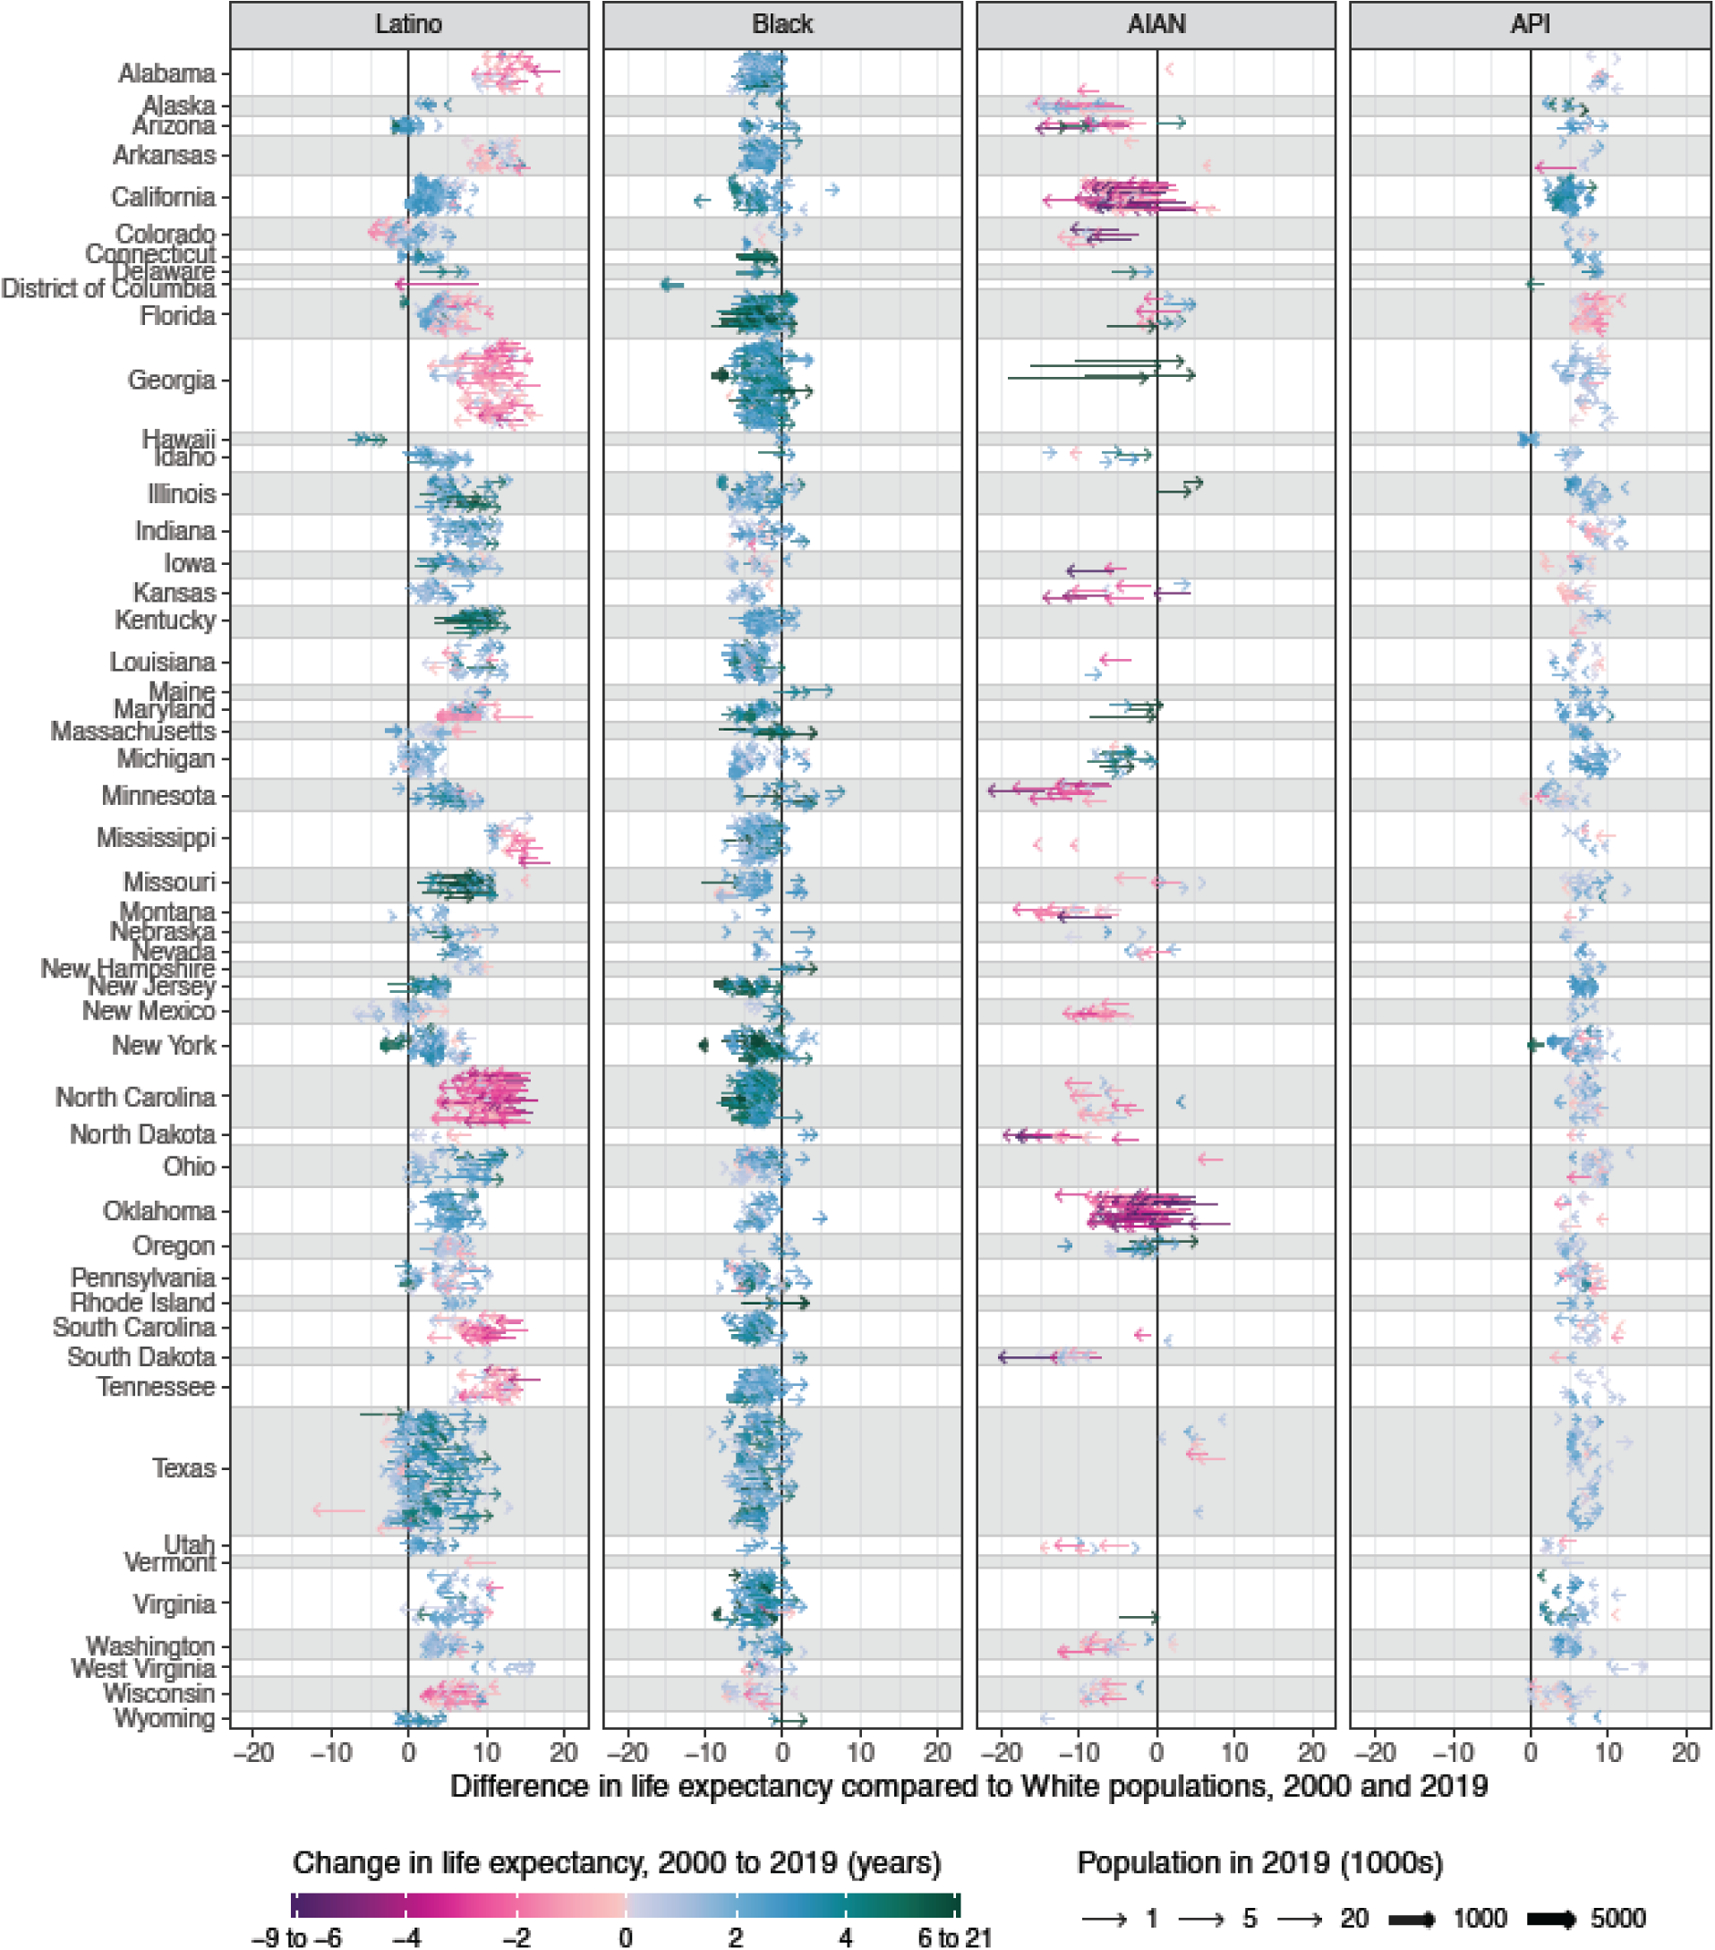
Findings: Between 2000 and 2019, trends in life expectancy differed among racial-ethnic groups and among counties. Nationally, there was an increase in life expectancy for people who were Black (change 3·9 years [95% uncertainty interval 3·8 to 4·0]; life expectancy in 2019 75·3 years [75·2 to 75·4]), API (2·9 years [2·7 to 3·0]; 85·7 years [85·3 to 86·0]), Latino (2·7 years [2·6 to 2·8]; 82·2 years [82·0 to 82·5]), and White (1·7 years [1·6 to 1·7]; 78·9 years [78·9 to 79·0]), but remained the same for the AIAN population (0·0 years [-0·3 to 0·4]; 73·1 years [71·5 to 74·8]). At the national level, the negative difference in life expectancy for the Black population compared with the White population decreased during this period, whereas the negative difference for the AIAN population compared with the White population increased; in both cases, these patterns were widespread among counties. The positive difference in life expectancy for the API and Latino populations compared with the White population increased at the national level from 2000 to 2019; however, this difference declined in a sizeable minority of counties (615 [42·0%] of 1465 counties) for the Latino population and in most counties (401 [60·2%] of 666 counties) for the API population. For all racial-ethnic groups, improvements in life expectancy were more widespread across counties and larger from 2000 to 2010 than from 2010 to 2019.
Interpretation: Disparities in life expectancy among racial-ethnic groups are widespread and enduring. Local-level data are crucial to address the root causes of poor health and early death among disadvantaged groups in the USA, eliminate health disparities, and increase longevity for all.
Funding: National Institute on Minority Health and Health Disparities; National Heart, Lung, and Blood Institute; National Cancer Institute; National Institute on Aging; National Institute of Arthritis and Musculoskeletal and Skin Diseases; Office of Disease Prevention; and Office of Behavioral and Social Science Research, US National Institutes of Health.
Copyright © 2022 Elsevier Ltd. All rights reserved.
Conflict of interest statement
Declaration of interests We declare no competing interests.
Figures
Comment in
-
Data aggregation hides Pacific Islander health disparities.Lancet. 2022 Jul 2;400(10345):2-3. doi: 10.1016/S0140-6736(22)01100-X. Epub 2022 Jun 16. Lancet. 2022. PMID: 35717993 No abstract available.
References
-
- Preamble to the constitution of WHO as adopted by the International Health Conference, New York, 19 June - 22 July 1946; signed on 22 July 1946 by the representatives of 61 States (Official Records of WHO, no. 2, p. 100) and entered into force on 7 April 1948 https://www.who.int/about/who-we-are/constitution (accessed Dec 22, 2020).
-
- National Academies of Sciences, Engineering, and Medicine. The state of health disparities in the United States. In: Communities in Action: Pathways to Health Equity. Washington, DC: National Academies Press, 2017. https://www.ncbi.nlm.nih.gov/books/NBK425844/ (accessed April 16, 2021). - PubMed
-
- Bailey ZD, Krieger N, Agénor M, Graves J, Linos N, Bassett MT. Structural racism and health inequities in the USA: evidence and interventions. The Lancet 2017; 389: 1453–63. - PubMed
-
- Harper S, Lynch J, Burris S, Davey Smith G. Trends in the black-white life expectancy gap in the United States, 1983–2003. JAMA 2007; 297: 1224–32. - PubMed
MeSH terms
Grants and funding
LinkOut - more resources
Full Text Sources
