. 2022 Aug;21(8):100258.
doi: 10.1016/j.mcpro.2022.100258. Epub 2022 Jun 17.

A Single-Cell Atlas of Tumor-Infiltrating Immune Cells in Pancreatic Ductal Adenocarcinoma

Affiliations

A Single-Cell Atlas of Tumor-Infiltrating Immune Cells in Pancreatic Ductal Adenocarcinoma

Hao Wang et al. Mol Cell Proteomics. 2022 Aug.

Abstract

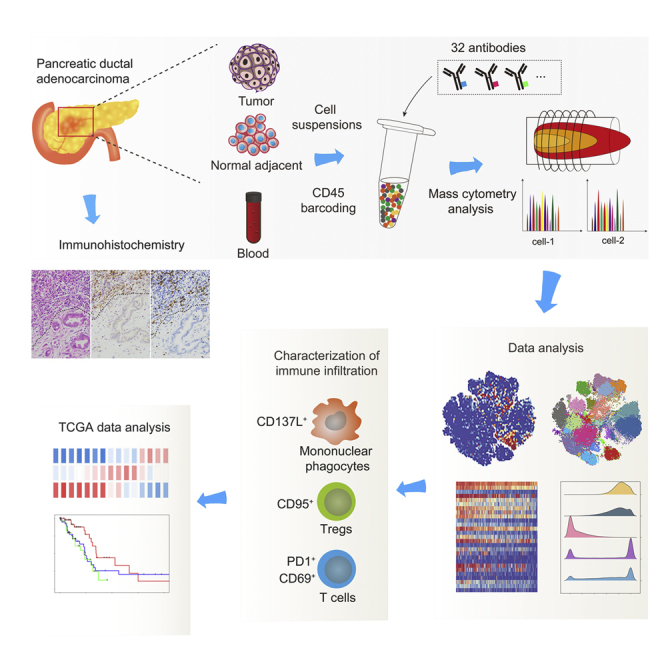
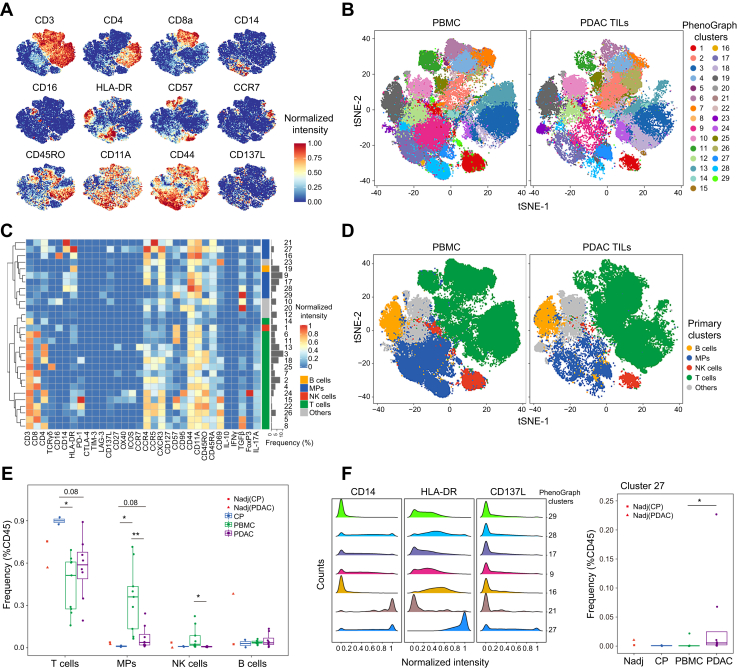
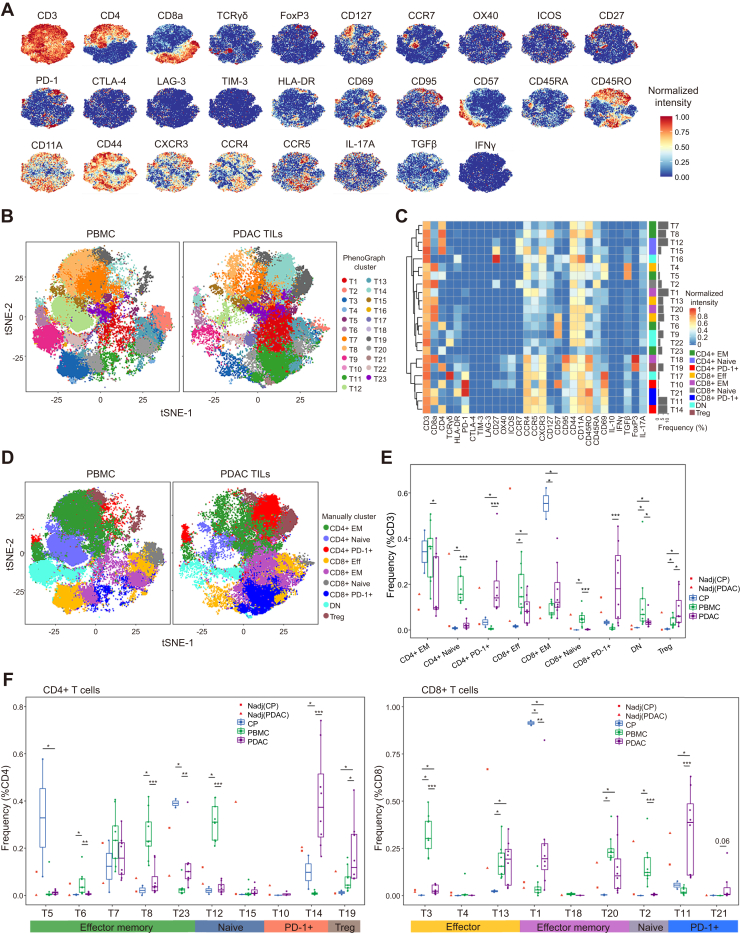
Pancreatic ductal adenocarcinoma (PDAC) is one of the most lethal malignancies with limited treatment options. To guide the design of more effective immunotherapy strategies, mass cytometry was employed to characterize the cellular composition of the PDAC-infiltrating immune cells. The expression of 33 protein markers was examined at the single-cell level in more than two million immune cells from four types of clinical samples, including PDAC tumors, normal pancreatic tissues, chronic pancreatitis tissues, and peripheral blood. Based on the analyses, we identified 23 distinct T-cell phenotypes, with some cell clusters exhibiting aberrant frequencies in the tumors. Programmed cell death protein 1 (PD-1) was extensively expressed in CD4+ and CD8+ T cells and coexpressed with both stimulatory and inhibitory immune markers. In addition, we observed elevated levels of functional markers, such as CD137L and CD69, in PDAC-infiltrating immune cells. Moreover, the combination of PD-1 and CD8 was used to stratify PDAC tumors from The Cancer Genome Atlas database into three immune subtypes, with S1 (PD-1+CD8+) exhibiting the best prognosis. Further analysis suggested distinct molecular mechanisms for immune exclusion in different subtypes. Taken together, the single-cell protein expression data depicted a detailed cell atlas of the PDAC-infiltrating immune cells and revealed clinically relevant information regarding useful cell phenotypes and targets for immunotherapy development.

Keywords: cancer immunology; mass cytometry; pancreatic ductal adenocarcinoma; single-cell analysis; tumor microenvironment.


Conflict of interest statement

Conflict of interest The authors declare no competing interests.

Figures

None
Graphical abstract
Fig. 1
Fig. 1
Investigation of the immune landscape of PDAC.A, representative IHC images stained against CD3 and CD8 from different regions of a PDAC tumor (left panel; scale bar, 100 µm). Line graphs showing the T-cell density scores in tumors from all the enrolled PDAC patients. Paired Wilcoxon test was used for statistical analysis (∗p < 0.05, ∗∗p < 0.01). B, workflow of the mass cytometry experiments. Different types of samples from one patient were stained with anti-CD45 conjugated with different isotopes and then combined for mass cytometry analysis. For PDAC tumors without paired Nadj or PBMC sample from the same patient, two anti-CD45 antibodies conjugated with different isotopes were employed for the barcoding. See also supplemental Figs. S1 and S2 and supplemental Tables S1–S3. IHC, immunohistochemistry; Nadj, normal adjacent tissue; PBMC, peripheral blood mononuclear cell; PDAC, pancreatic ductal adenocarcinoma; St, stroma; TEC, tumor epithelial cell nest; Tm, tumor margin; Tn, tumor nest; Tns, tumor nest surrounding.
Fig. 2
Fig. 2
Identification of immune cell subtypes in the PDAC TME.A, cells colored by normalized expression of indicated markers on the t-distributed stochastic neighbor embedding (tSNE) maps. B, tSNE plots of CD45+ cells colored by PhenoGraph-identified clusters. C, heatmap showing the markers’ expression of PhenoGraph-identified clusters. D, tSNE plots displaying cells of the main immune cell compartments based on the manual annotation of the PhenoGraph clusters. E, frequencies of the main immune cell compartments in Nadj, CP, PBMC, and PDAC samples. Boxplot center lines = median, lower bound = 25% quantile, upper bound = 75% quantile, lower whisker = the smallest observation greater than or equal to the lower hinge −1.5 × interquartile range (IQR), and upper whisker = the largest observation less than or equal to the upper hinge + 1.5 × IQR. Wilcoxon rank-sum test was used for statistical analysis (∗p < 0.05). F, histograms showing the expression of indicated markers in PhenoGraph clusters of myeloid cells (left) and boxplot showing the frequencies of cluster 27 in different samples. Wilcoxon rank-sum test was used for statistical analysis (∗p < 0.05). Statistical analysis was not performed on Nadj samples. See also supplemental Fig. S3, supplemental Tables S4 and S5. CP, chronic pancreatitis; MP, mononuclear phagocyte; Nadj, normal adjacent tissue; PBMC, peripheral blood mononuclear cell; PDAC, pancreatic ductal adenocarcinoma; TME, tumor microenvironment.
Fig. 3
Fig. 3
Characterization of infiltrating T cells in the PDAC TME.A, tSNE plots of T cells colored by normalized expression of indicated markers. B, tSNE plots of T cells colored by PhenoGraph-identified clusters. C, heatmap showing the markers’ expression in PhenoGraph-identified clusters of T cells. D, tSNE plots displaying T-cell subsets based on the manual annotation of the PhenoGraph clusters. E, frequencies of the subsets of T cells in Nadj, CP, PBMC, and PDAC samples. F, frequencies of the indicated PhenoGraph clusters of CD4+ (left panel) and CD8+ (right panel) T cells in Nadj, CP, PBMC, and PDAC samples. E and F, boxplot center lines = median, lower bound = 25% quantile, upper bound = 75% quantile, lower whisker = the smallest observation greater than or equal to the lower hinge − 1.5 × interquartile range (IQR), and upper whisker = the largest observation less than or equal to the upper hinge + 1.5 × IQR. Wilcoxon rank-sum test was used for statistical analysis (∗p < 0.05, ∗∗p < 0.01, ∗∗∗p < 0.001). Statistical analysis was not performed on Nadj samples. See also supplemental Fig. S4. CP, chronic pancreatitis; DN, double negative; Nadj, normal adjacent tissue; PBMC, peripheral blood mononuclear cell; PDAC, pancreatic ductal adenocarcinoma; TIL, tumor infiltrating lymphocyte; TME, tumor microenvironment; tSNE, t-distributed stochastic neighbor embedding.
Fig. 4
Fig. 4
The expression of functional markers on PDAC-infiltrating T cells.A, box plots displaying the percentage of immune checkpoint molecules in the T cells from Nadj, CP, PBMC, and PDAC samples. B, tSNE plots showing the expression of PD-1 in T cells. C, box plots displaying the percentage of other functional markers in the T cells. For A and C, boxplot center lines = median, lower bound = 25% quantile, upper bound = 75% quantile, lower whisker = the smallest observation greater than or equal to the lower hinge − 1.5 × interquartile range (IQR), and upper whisker = the largest observation less than or equal to the upper hinge + 1.5 × IQR. Wilcoxon rank-sum test was used for statistical analysis (∗p < 0.05, ∗∗p < 0.01, ∗∗∗p < 0.001). D, histograms displaying the expression of indicated markers on Treg cells. E, tSNE plots showing the expression of CD69 in T cells. F, histograms showing the expression of PD-1 and CD69 on cells from the PD-1+ clusters. G, scatterplot showing the correlation between the expression of CD69 and PD-1 in PDAC-infiltrating T cells. The Pearson correlation coefficient and p value are indicated, and the fitted line is shown in blue. Statistical analysis was not performed on Nadj samples. See also supplemental Fig. S5. CP, chronic pancreatitis; Nadj, normal adjacent tissue; PBMC, peripheral blood mononuclear cell; PD-1, programmed cell death protein 1; PDAC, pancreatic ductal adenocarcinoma; Treg, regulatory T cell; tSNE, peripheral blood mononuclear cell.
Fig. 5
Fig. 5
The distinct expression of functional markers between PD-1 positive and negative T cells. Boxplot center lines = median, lower bound = 25% quantile, upper bound = 75% quantile, lower whisker = the smallest observation greater than or equal to the lower hinge − 1.5 × interquartile range (IQR), and upper whisker = the largest observation less than or equal to the upper hinge + 1.5 × IQR. Paired Student's t test was used for statistical analysis, and the p value is shown in the graph for each comparison. See also supplemental Fig. S6. PD-1, programmed cell death protein 1.
Fig. 6
Fig. 6
Transcriptomic immune subtyping of TCGA PDAC samples.A, scatterplots showing the correlation between the RNA level of PD-1 and indicated immune-related genes across TCGA PDAC samples. Spearman correlations and p values are indicated, and the fitted lines are shown as blue lines. B, box plots showing the RNA expression of indicated genes in S1, S2, and S3 subtypes of TCGA PDAC samples. Boxplot center lines = median, lower bound = 25% quantile, upper bound = 75% quantile, lower whisker = the smallest observation greater than or equal to the lower hinge − 1.5 × interquartile range (IQR), and upper whisker = the largest observation less than or equal to the upper hinge + 1.5 × IQR. Wilcoxon rank-sum test was used for statistical analysis (∗p < 0.05, ∗∗p < 0.01, ∗∗∗p < 0.001). C, heatmap of the enrichment of the indicated pathways in the three subtypes. Colors represent the average GSVA enrichment scores. D, heatmap showing the expression of selected genes from the corresponding pathways with differential GSVA enrichment scores across subtypes. E, Kaplan–Meier curves of overall survival (OS) for each subtype of the TCGA PDAC patients, and p values are calculated using the log-rank test. RNA sequencing data and clinical information were obtained from TCGA (https://gdc.cancer.gov/) using the TCGAbiolinks (version: 2.16.0) R/Bioconductor package. See also supplemental Fig. S7 and supplemental Tables S6 and S7. GSVA, Gene set variation analysis; PD-1, programmed cell death protein 1; PDAC, pancreatic ductal adenocarcinoma; TCGA, The Cancer Genome Atlas; TPM, transcript per million.

References

    1. Kleeff J., Korc M., Apte M., La Vecchia C., Johnson C.D., Biankin A.V., et al. Pancreatic cancer. Nat. Rev. Dis. Primers. 2016;2 - PubMed
    1. Rahib L., Smith B.D., Aizenberg R., Rosenzweig A.B., Fleshman J.M., Matrisian L.M. Projecting cancer incidence and deaths to 2030: the unexpected burden of thyroid, liver, and pancreas cancers in the United States. Cancer Res. 2014;74:2913–2921. - PubMed
    1. Bailey P., Chang D.K., Nones K., Johns A.L., Patch A.M., Gingras M.C., et al. Genomic analyses identify molecular subtypes of pancreatic cancer. Nature. 2016;531:47–52. - PubMed
    1. Cancer Genome Atlas Research Network Integrated genomic characterization of pancreatic ductal adenocarcinoma. Cancer Cell. 2017;32:185–203.e13. - PMC - PubMed
    1. Moffitt R.A., Marayati R., Flate E.L., Volmar K.E., Loeza S.G., Hoadley K.A., et al. Virtual microdissection identifies distinct tumor- and stroma-specific subtypes of pancreatic ductal adenocarcinoma. Nat. Genet. 2015;47:1168–1178. - PMC - PubMed

Publication types

Substances