

High-fidelity carbon dots polarity probes: revealing the heterogeneity of lipids in oncology
- PMID: 35718791
- PMCID: PMC9207028
- DOI: 10.1038/s41377-022-00873-x
High-fidelity carbon dots polarity probes: revealing the heterogeneity of lipids in oncology
Abstract
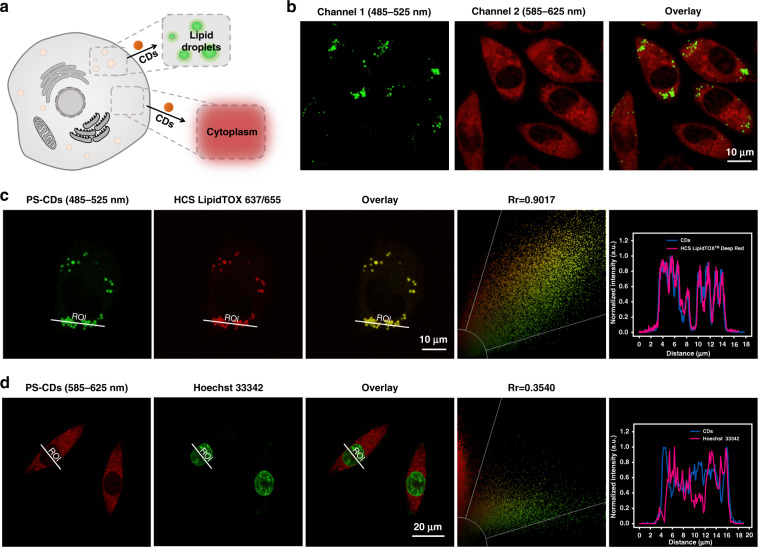
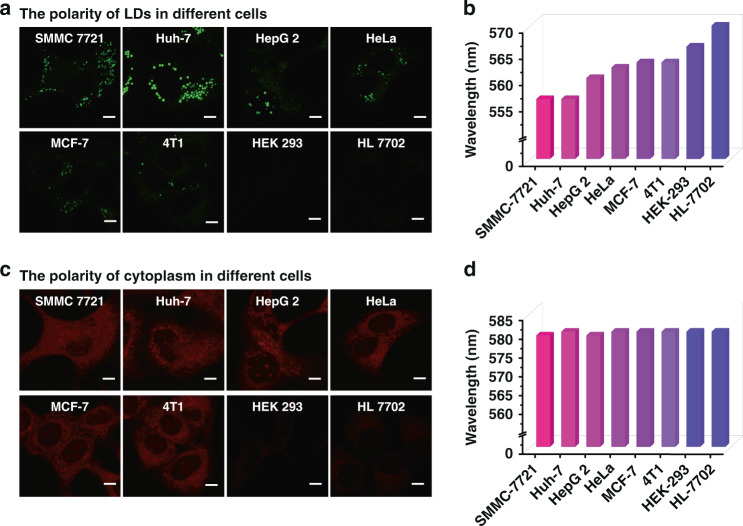
Polarity is an integral microenvironment parameter in biological systems closely associated with a multitude of cellular processes. Abnormal polarity variations accompany the initiation and development of pathophysiological processes. Thus, monitoring the abnormal polarity is of scientific and practical importance. Current state-of-the-art monitoring techniques are primarily based on fluorescence imaging which relies on a single emission intensity and may cause inaccurate detection due to heterogeneous accumulation of the probes. Herein, we report carbon dots (CDs) with ultra-sensitive responses to polarity. The CDs exhibit two linear relationships: one between fluorescence intensity and polarity and the other between polarity and the maximum emission wavelength. The emission spectrum is an intrinsic property of the probes, independent of the excitation intensity or probe concentration. These features enable two-color imaging/quantitation of polarity changes in lipid droplets (LDs) and in the cytoplasm via in situ emission spectroscopy. The probes reveal the polarity heterogeneity in LDs which can be applied to make a distinction between cancer and normal cells, and reveal the polarity homogeneity in cytoplasm.
© 2022. The Author(s).
Conflict of interest statement
The authors declare no competing interests.
Figures


References
-
- Simons K, Toomre D. Lipid rafts and signal transduction. Nat. Rev. Mol. Cell Biol. 2000;1:31–39. - PubMed
-
- Anderson RGW, Jacobson K. A role for lipid shells in targeting proteins to caveolae, rafts, and other lipid domains. Science. 2002;296:1821–1825. - PubMed
-
- Munro S. Lipid rafts: elusive or illusive? Cell. 2003;115:377–388. - PubMed
-
- Yang ZG, et al. Macro-/micro-environment-sensitive chemosensing and biological imaging. Chem. Soc. Rev. 2014;43:4563–4601. - PubMed
-
- Drubin DG, Nelson WJ. Origins of cell polarity. Cell. 1996;84:335–344. - PubMed
Grants and funding
- 21974125/National Natural Science Foundation of China (National Science Foundation of China)
- CXJD2021001/Foundation of Henan Educational Committee (Foundation of Education Committee of Henan Province)
- CXJD2021001/Foundation of Henan Educational Committee (Foundation of Education Committee of Henan Province)
LinkOut - more resources
Full Text Sources
