. 2022 May 28;55(Pt 3):569-585.
doi: 10.1107/S1600576722003508. eCollection 2022 Jun 1.

Uniaxial polarization analysis of bulk ferromagnets: theory and first experimental results

Affiliations

Uniaxial polarization analysis of bulk ferromagnets: theory and first experimental results

Artem Malyeyev et al. J Appl Crystallogr. .

Abstract

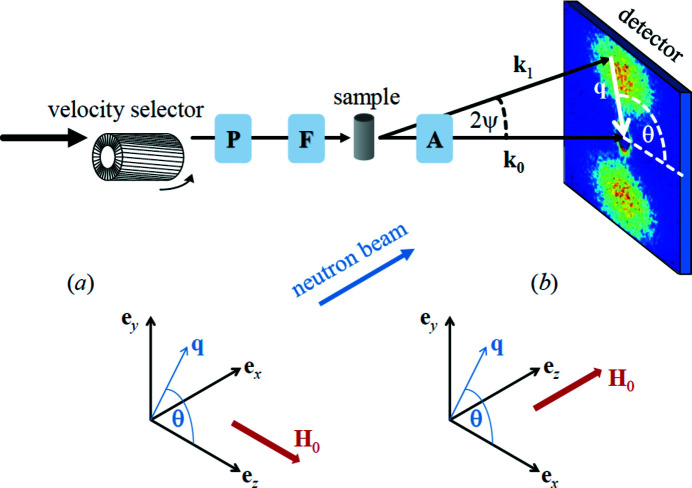
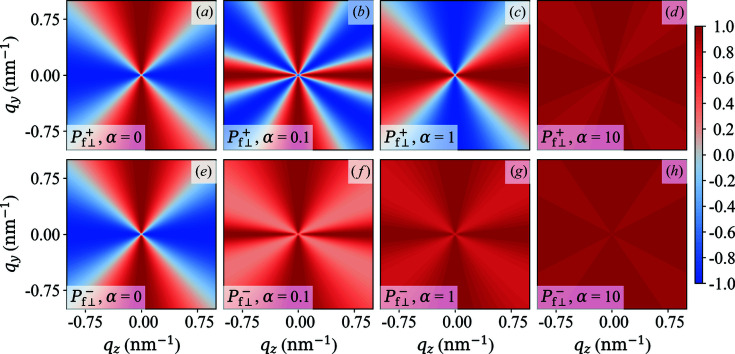
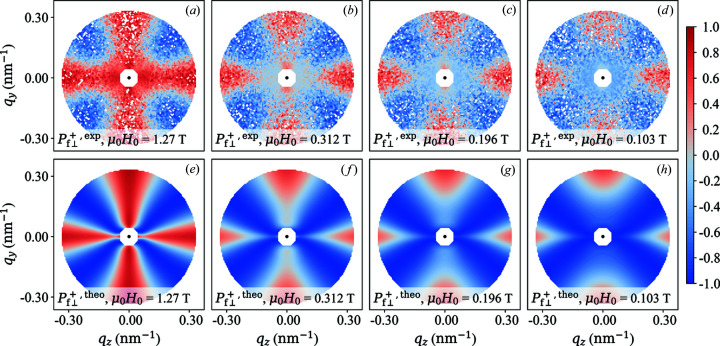
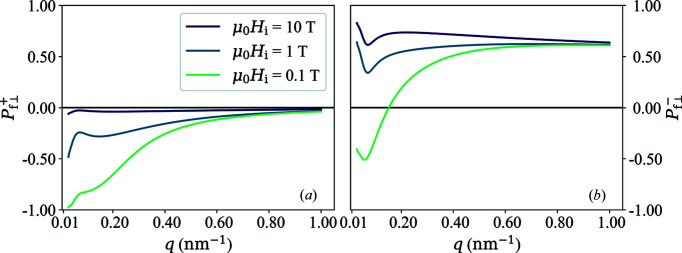
On the basis of Brown's static equations of micromagnetics, the uniaxial polarization of the scattered neutron beam of a bulk magnetic material is computed. The approach considers a Hamiltonian that takes into account the isotropic exchange interaction, the antisymmetric Dzyaloshinskii-Moriya interaction, magnetic anisotropy, the dipole-dipole interaction and the effect of an applied magnetic field. In the high-field limit, the solutions for the magnetization Fourier components are used to obtain closed-form results for the spin-polarized small-angle neutron scattering (SANS) cross sections and the ensuing polarization. The theoretical expressions are compared with experimental data on a soft magnetic nanocrystalline alloy. The micromagnetic SANS theory provides a general framework for polarized real-space neutron methods, and it may open up a new avenue for magnetic neutron data analysis on magnetic microstructures.

Keywords: magnetic nanocomposites; micromagnetics; polarized neutron scattering; small-angle neutron scattering; uniaxial polarization analysis.


Figures

Figure 1
Figure 1
Sketch of the SANS setup and of the two most often employed scattering geometries in magnetic SANS experiments. (a) Applied magnetic field formula image perpendicular to the incident neutron beam ( formula image ); (b) formula image . The momentum-transfer or scattering vector formula image corresponds to the difference between the wavevectors of the incident ( formula image ) and the scattered ( formula image ) neutrons, i.e. formula image . Its magnitude for elastic scattering, formula image , depends on the mean wavelength λ of the neutrons and on the scattering angle formula image . For a given λ, sample-to-detector distance formula image and distance formula image from the centre of the direct beam to a certain pixel element on the detector, the q value can be obtained using formula image . The symbols ‘P’, ‘F’ and ‘A’ denote, respectively, the polarizer, spin flipper and analyzer, which are optional neutron optical devices. Note that a second flipper after the sample has been omitted here. In spin-resolved SANS (POLARIS) using a 3He spin filter, the transmission (polarization) direction of the analyzer can be switched by 180° by means of a radiofrequency pulse. SANS is usually implemented as elastic scattering ( formula image ), and the component of formula image along the incident neutron beam [i.e. formula image in (a) and formula image in (b)] is neglected. The angle θ may be conveniently used in order to describe the angular anisotropy of the recorded scattering pattern on a two-dimensional position-sensitive detector. Image taken from Michels (2021 ▸), reproduced by permission of Oxford University Press.
Figure 2
Figure 2
Plot of formula image (upper row) and formula image (lower row) in the saturated state for different values of α (see insets) [equations (60a) and (60b)].
Figure 3
Figure 3
Plot of formula image and formula image (see inset) in the saturated state as a function of α [equations (62a) and (62b)].
Figure 4
Figure 4
Black circles: experimental ratio formula image of nuclear to magnetic scattering of the two-phase alloy NANOPERM (Michels et al., 2012 ▸) ( formula image ; formula image ; log–log plot). Solid line: power-law fit to parametrize the experimental data [equation (63)]. The fit has been restricted to the interval 0.03 < q < 0.3 nm−1, but the fit function is displayed for 0.01 < q < 1.0 nm−1.
Figure 5
Figure 5
Plot of formula image (solid line) and formula image (dashed line) of NANOPERM using equations (62a) and (62b) with formula image given by equation (63) and 0.03 < q < 0.3 nm−1.
Figure 6
Figure 6
Qualitative comparison between experiment and theory. (a)–(d) Two-dimensional experimental polarization formula image of the scattered neutrons of NANOPERM [(Fe0.985Co0.015)90Zr7B3] at a series of applied magnetic fields (see insets). formula image is horizontal in the plane. The range of momentum transfers is restricted to formula image . (e)–(h) Prediction by the analytical micromagnetic theory (no free parameters) using the experimental ratio formula image [equation (63)] and the structural ( formula image ) and magnetic ( formula image ) interaction parameters of NANOPERM [see text, Michels et al. (2012 ▸) and Honecker et al. (2013 ▸)]. The central white octagons mark the position of the beamstop.
Figure 7
Figure 7
Similar to Fig. 6 ▸, but for formula image .
Figure 8
Figure 8
(Data points) Experimental polarizations formula image (a) and formula image (b) of the scattered neutrons of NANOPERM [(Fe0.985Co0.015)90Zr7B3] at a series of internal magnetic fields (see inset). For clarity of presentation, error bars are only shown for one field. (Solid lines) Prediction by the analytical micromagnetic theory [equations (44a) and (44b)] using the ratio formula image [equation (63)]. Note the different scales on the ordinates in (a) and (b).
Figure 9
Figure 9
Resulting best-fit values for the correlation lengths formula image and formula image (see inset). Lines are a guide to the eye.
Figure 10
Figure 10
Plot of formula image (upper row) and formula image (lower row) for different applied magnetic fields formula image (see insets). formula image [equation (63)], formula image , formula image .
Figure 11
Figure 11
formula image azimuthally averaged formula image (a) and formula image (b) of the data shown in Fig. 10 ▸.
Figure 12
Figure 12
Plot of formula image (upper row) and formula image (lower row) for different ratios of formula image (see insets). formula image [equation (63)], formula image , formula image .
Figure 13
Figure 13
Plot of formula image (upper row) and formula image (lower row) for different values of formula image (see insets). formula image , formula image , formula image .
Figure 14
Figure 14
Effect of the DMI. Plot of formula image (upper row) and formula image (lower row) as a function of formula image (see insets). formula image [equation (63)], formula image , formula image .
Figure 15
Figure 15
Results for the azimuthally averaged formula image using the sphere form factor (instead of Lorentzian-squared functions) for both formula image and formula image . (a) Field dependence (see inset) of formula image for formula image and formula image . (b) formula image at formula image , formula image , but for increasing formula image (see inset). (c) formula image at formula image , formula image , but for increasing formula image (see inset). formula image [equation (63)], formula image , formula image .

References

    1. Aharoni, A. (2000). Introduction to the Theory of Ferromagnetism, 2nd ed. Oxford University Press.
    1. Aswal, V. K., van den Brandt, B., Hautle, P., Kohlbrecher, J., Konter, J. A., Michels, A., Piegsa, F. M., Stahn, J., Van Petegem, S. & Zimmer, O. (2008). Nucl. Instrum. Methods Phys. Res. A, 586, 86–89.
    1. Batz, M., Baessler, S., Heil, W., Otten, E. W., Rudersdorf, D., Schmiedeskamp, J., Sobolev, Y. & Wolf, M. (2005). J. Res. Natl Inst. Stand. Technol. 110, 293. - PMC - PubMed
    1. Benacchio, G., Titov, I., Malyeyev, A., Peral, I., Bersweiler, M., Bender, P., Mettus, D., Honecker, D., Gilbert, E. P., Coduri, M., Heinemann, A., Mühlbauer, S., Çakır, A., Acet, M. & Michels, A. (2019). Phys. Rev. B, 99, 184422.
    1. Bender, P., Fock, J., Frandsen, C., Hansen, M. F., Balceris, C., Ludwig, F., Posth, O., Wetterskog, E., Bogart, L. K., Southern, P., Szczerba, W., Zeng, L., Witte, K., Grüttner, C., Westphal, F., Honecker, D., González-Alonso, D., Fernández Barquín, L. & Johansson, C. (2018). J. Phys. Chem. C, 122, 3068–3077.