Inflammation-Related LncRNAs Signature for Prognosis and Immune Response Evaluation in Uterine Corpus Endometrial Carcinoma
- PMID: 35719911
- PMCID: PMC9201290
- DOI: 10.3389/fonc.2022.923641
Inflammation-Related LncRNAs Signature for Prognosis and Immune Response Evaluation in Uterine Corpus Endometrial Carcinoma
Abstract
Backgrounds: Uterine corpus endometrial carcinoma (UCEC) is one of the greatest threats on the female reproductive system. The aim of this study is to explore the inflammation-related LncRNA (IRLs) signature predicting the clinical outcomes and response of UCEC patients to immunotherapy and chemotherapy.
Methods: Consensus clustering analysis was employed to determine inflammation-related subtype. Cox regression methods were used to unearth potential prognostic IRLs and set up a risk model. The prognostic value of the prognostic model was calculated by the Kaplan-Meier method, receiver operating characteristic (ROC) curves, and univariate and multivariate analyses. Differential abundance of immune cell infiltration, expression levels of immunomodulators, the status of tumor mutation burden (TMB), the response to immune checkpoint inhibitors (ICIs), drug sensitivity, and functional enrichment in different risk groups were also explored. Finally, we used quantitative real-time PCR (qRT-PCR) to confirm the expression patterns of model IRLs in clinical specimens.
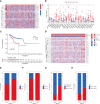
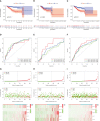
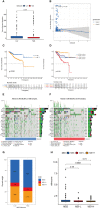
Results: All UCEC cases were divided into two clusters (C1 = 454) and (C2 = 57) which had significant differences in prognosis and immune status. Five hub IRLs were selected to develop an IRL prognostic signature (IRLPS) which had value in forecasting the clinical outcome of UCEC patients. Biological processes related to tumor and immune response were screened. Function enrichment algorithm showed tumor signaling pathways (ERBB signaling, TGF-β signaling, and Wnt signaling) were remarkably activated in high-risk group scores. In addition, the high-risk group had a higher infiltration level of M2 macrophages and lower TMB value, suggesting patients with high risk were prone to a immunosuppressive status. Furthermore, we determined several potential molecular drugs for UCEC.
Conclusion: We successfully identified a novel molecular subtype and inflammation-related prognostic model for UCEC. Our constructed risk signature can be employed to assess the survival of UCEC patients and offer a valuable reference for clinical treatment regimens.
Keywords: TCGA; UCEC; immunotherapy; inflammation; prognostic signature; tumor microenvironment.
Copyright © 2022 Gu, Song, Chen, Wang, Tan and Zhao.
Conflict of interest statement
The authors declare that the research was conducted in the absence of any commercial or financial relationships that could be construed as a potential conflict of interest.
Figures






Similar articles
-
Cuproptosis-Associated lncRNA Gene Signature Establishes New Prognostic Profile and Predicts Immunotherapy Response in Endometrial Carcinoma.Biochem Genet. 2024 Oct;62(5):3439-3466. doi: 10.1007/s10528-023-10574-8. Epub 2023 Dec 18. Biochem Genet. 2024. PMID: 38108937 Free PMC article.
-
Prognostic signature construction and immunotherapy response analysis for Uterine Corpus Endometrial Carcinoma based on cuproptosis-related lncRNAs.Comput Biol Med. 2023 Jun;159:106905. doi: 10.1016/j.compbiomed.2023.106905. Epub 2023 Apr 11. Comput Biol Med. 2023. PMID: 37060773
-
Development and Clinical Validation of Novel 8-Gene Prognostic Signature Associated With the Proportion of Regulatory T Cells by Weighted Gene Co-Expression Network Analysis in Uterine Corpus Endometrial Carcinoma.Front Immunol. 2021 Dec 14;12:788431. doi: 10.3389/fimmu.2021.788431. eCollection 2021. Front Immunol. 2021. PMID: 34970268 Free PMC article.
-
Identification of an Immune-Related LncRNA Prognostic Signature in Uterine Corpus Endometrial Carcinoma Patients.Clin Lab. 2021 Nov 1;67(11). doi: 10.7754/Clin.Lab.2021.210401. Clin Lab. 2021. PMID: 34758230
-
LINC01589 serves as a potential tumor-suppressor and immune-related biomarker in endometrial cancer: A review.Medicine (Baltimore). 2023 Apr 14;102(15):e33536. doi: 10.1097/MD.0000000000033536. Medicine (Baltimore). 2023. PMID: 37058060 Free PMC article. Review.
Cited by
-
Identification and verification of aging-related lncRNAs for prognosis prediction and immune microenvironment in patients with head and neck squamous carcinoma.Oncol Res. 2023 Mar 1;31(1):35-61. doi: 10.32604/or.2022.028193. eCollection 2023. Oncol Res. 2023. PMID: 37303739 Free PMC article.
-
Deciphering DNA repair gene mutational landscape in uterine corpus endometrial carcinoma patients using next generation sequencing.Am J Cancer Res. 2024 Jan 15;14(1):210-226. doi: 10.62347/DJVS8353. eCollection 2024. Am J Cancer Res. 2024. PMID: 38323278 Free PMC article.
-
Pan-cancer analysis of super-enhancer-induced LINC00862 and validation as a SIRT1-promoting factor in cervical cancer and gastric cancer.Transl Oncol. 2024 Jul;45:101982. doi: 10.1016/j.tranon.2024.101982. Epub 2024 May 7. Transl Oncol. 2024. PMID: 38718436 Free PMC article.
-
Construction of a ferroptosis scoring system and identification of LINC01572 as a novel ferroptosis suppressor in lung adenocarcinoma.Front Pharmacol. 2023 Jan 4;13:1098136. doi: 10.3389/fphar.2022.1098136. eCollection 2022. Front Pharmacol. 2023. PMID: 36686701 Free PMC article.
-
The Analysis of ceRNA Networks and Tumor Microenvironment in Endometrial Cancer.J Cancer. 2024 Feb 24;15(8):2147-2159. doi: 10.7150/jca.93364. eCollection 2024. J Cancer. 2024. PMID: 38495486 Free PMC article.
References
LinkOut - more resources
Full Text Sources
Research Materials
Miscellaneous

