. 2022 Jun 1:12:840474.
doi: 10.3389/fonc.2022.840474. eCollection 2022.

Gene Coexpression Network Characterizing Microenvironmental Heterogeneity and Intercellular Communication in Pancreatic Ductal Adenocarcinoma: Implications of Prognostic Significance and Therapeutic Target

Affiliations

Gene Coexpression Network Characterizing Microenvironmental Heterogeneity and Intercellular Communication in Pancreatic Ductal Adenocarcinoma: Implications of Prognostic Significance and Therapeutic Target

Chengsi Wu et al. Front Oncol. .

Abstract

Background: Pancreatic ductal adenocarcinoma (PDAC) is characterized by intensive stromal involvement and heterogeneity. Pancreatic cancer cells interact with the surrounding tumor microenvironment (TME), leading to tumor development, unfavorable prognosis, and therapy resistance. Herein, we aim to clarify a gene network indicative of TME features and find a vulnerability for combating pancreatic cancer.

Methods: Single-cell RNA sequencing data processed by the Seurat package were used to retrieve cell component marker genes (CCMGs). The correlation networks/modules of CCMGs were determined by WGCNA. Neural network and risk score models were constructed for prognosis prediction. Cell-cell communication analysis was achieved by NATMI software. The effect of the ITGA2 inhibitor was evaluated in vivo by using a KrasG12D -driven murine pancreatic cancer model.

Results: WGCNA categorized CCMGs into eight gene coexpression networks. TME genes derived from the significant networks were able to stratify PDAC samples into two main TME subclasses with diverse prognoses. Furthermore, we generated a neural network model and risk score model that robustly predicted the prognosis and therapeutic outcomes. A functional enrichment analysis of hub genes governing gene networks revealed a crucial role of cell junction molecule-mediated intercellular communication in PDAC malignancy. The pharmacological inhibition of ITGA2 counteracts the cancer-promoting microenvironment and ameliorates pancreatic lesions in vivo.

Conclusion: By utilizing single-cell data and WGCNA to deconvolute the bulk transcriptome, we exploited novel PDAC prognosis-predicting strategies. Targeting the hub gene ITGA2 attenuated tumor development in a PDAC mouse model. These findings may provide novel insights into PDAC therapy.

Keywords: PDAC; cell–cell communication; integrin; prognostic signature; tumor microenvironment.


Conflict of interest statement

The authors declare that the research was conducted in the absence of any commercial or financial relationships that could be construed as a potential conflict of interest.

Figures
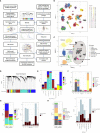
Figure 1
Figure 1
Weighted gene coexpression network analysis (WGCNA) classifies cell component marker genes into eight gene modules in pancreatic cancer. (A) The workflow diagram summarizes the study design in this work. (B, C) Uniform Manifold Approximation and Projection (UMAP) visualization of pancreatic ductal adenocarcinoma (PDAC) single-cell sequencing data exhibits the cell clusters discovered by Seurat analysis (B) and the cellular identity of each cluster (C). The cell type of each cluster was distinguished through the expression of well-documented markers (shown in Supplementary Figure 1A ) and grouped into eight major components. (D) Cell component marker genes found in PDAC single-cell dataset were subjected to WGCNA in a combined PDAC bulk RNA-sequencing dataset. In this process, eight gene-network modules were detected. (E) Stacked barplots show the cell origins of the genes constituting each module. (F) Distribution of different cell component marker genes in the gene modules. (G, H) Barplots show the prognostic significant genes in every gene module (G) and each cell type (H). The prognosis significance was determined by Cox regression analysis.
Figure 2
Figure 2
Tumor microenvironment marker genes (MEMGs) stratify PDAC patients into subtypes with distinct outcomes. (A) The eigengene (ME) values for the gene modules were calculated in PDAC samples using the transcriptome data; then, the Cox regression analyses were performed to estimate the hazard ratio (HR). Forest plot shows the HR and and 95% confidence interval (95% CI). The optimal cutoff value in each module was estimated by the maxstat function. (B) Kaplan–Meier curves indicate that the eigengene values of green and blue modules are correlated with poor and favorite prognosis, respectively, P-values were evaluated by a log-rank tests. (C) MEMGs and hub genes in the prognosis-related modules (blue and green modules) were defined by the expression in cell components, module membership, and intramodular connectivity. (D) MEMGs stratify PDAC patients into three TME classes by a consensus cluster algorithm. Different expressed MEMGs among subclasses were shown by a heatmap. (E) The heatmap shows the expression pattern of hub genes in different TME classes. (F) Kaplan–Meier curves show the variations of survival rates among TME classes. Statistical analysis was taken by the log-rank test. (G) Relative abundance and differentiations of tumor environmental cells in two major TME classes. The abundance of these cells was estimated by the quanTIseq algorithm or tumor immune dysfunction and exclusion (TIDE) methods. Differences were tested by Student’s t-test, ****P < 0.0001, *P < 0.05, ns: not significant. (H) The waterflow plot displays recurrent genetic variations in each TME class.
Figure 3
Figure 3
A deep neural network (DNN) model predicts outcomes of PDAC patients based on the expression of MEMGs. (A) The framework of the deep neural network (DNN) containing five layers. (B) The samples in a combined PDAC dataset were randomly divided into training groups (2/3) and internal testing groups (1/3). The DNN model was trained in training samples by 400 iterations and tested by internal testing samples and all samples. ROC curves show the 1-year survival predicting accuracies in each group. The area under the curve (AUC) values were shown. (C) The DNN probability score generated by DNN predictor in the all-sample-testing process was correlated with overall survival of patients. The Kaplan–Meier plot shows the survival rates, and statistical significance was tested by log-rank test. (D, E) The prognostic capability of DNN model was examined in the external testing set. The ROC curve (D) and Kaplan–Meier plot stratified by DNN scores (E) were shown. (F) Systematical cox analyses estimate the HR of DNN scores in multiple PDAC datasets from TCGA, ICGC, or GEO databases. The meta-analysis was performed using DL (DerSimonian and Laird) model to estimate the general prognostic effect of DNN score in pancreatic cancer patients. (G) The DNN framework was also trained to be a chemotherapy response predictor using a cohort of PDAC patients undergone chemotherapy. ROC curves show the AUC values using a DNN model to predict chemotherapeutic responsiveness in training, testing or all samples. (H) A confusion matrix demonstrates the accuracy of DNN model in predicting chemo-response. (I) DNN score correlates with patient’s survival after chemotherapy. The survival rates were shown in Kaplan–Meier plot. The differentiation was tested by log-rank test.
Figure 4
Figure 4
MEMG-based risk score infers therapy efficiencies in pancreatic cancer patients. (A) A risk score algorithm based on the expression pattern of MEMGs was established in a combined PDAC (training) dataset and tested for its prognostic relationship in the multiple testing sets. (B) The HRs of risk scores in different PDAC datasets were shown, and a meta-analysis with the DL model was performed to estimate the overall effect. (C) A Kaplan–Meier plot shows the correlation of the risk score with PDAC patients’ survival after chemotherapy, tested by the log-rank test. (D) Correlation between risk score levels and actual responses. The significance was tested by Fisher’s exact test. (E) Scatterplots show the correlation of risk score with the TIDE-calculating MDSC abundance and dysfunction level. Correlations were analyzed by the Spearman method. (F) Associations of the risk score with TIDE-estimating immune checkpoint blockage therapy effectiveness. The significance was tested by Fisher’s exact test.
Figure 5
Figure 5
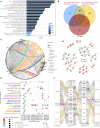
Cell junction molecule–mediating tumor cell–TME communications dominate the prognosis-related gene network. (A) Functional enrichment analysis was performed using gene signatures from the Reactome database to unveil the dominant molecular function of hub genes constituting prognosis-related networks. (B) Hub genes functioning as cell junction molecules to modulate external cellular communication (ligands/receptors) were selected for the following study. (C) A gene correlation network shows the links between the gene pairs initiated from central cell–cell communication mediators (named in the graph) to their closely connected (R > 0.5) genes within modules. Colored edges represent the links involving MEMGs. (D) The hub gene–related ligand–receptor pairs were extracted from the connectomeDB2020 database for cell–cell communication prediction in a PDAC single-cell dataset. (E) The cell–cell communications mediated by each ligand–receptor pair were determined using Network Analysis Toolkit for the Multicellular Interactions (NATMI) software. The top cell–cell communication pattern bridged by each ligand–receptor pair was noted. (F) Alluvial diagram represents the hub gene–associated ligand-receptor pairs engaged in tumor cell–TME communications.
Figure 6
Figure 6
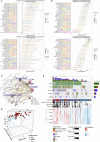
Integrins are key mediators critical for tumor cell-fibroblast and tumor cell-endothelial cell communications. (A) The HRs of cell–cell communication scores of PDAC patients in both the combined PDAC dataset and TCGA dataset, analyzed by the Cox regression model. (B) Correlation of the cell–cell communication score with DNN scores in both combined PDAC and TCGA datasets. Forest plots show the correlation coefficients together with the 95% confidence intervals. (C) A sending cell–ligand–receptor–target cell network shows the key contributors within it. The notes and edges are weighted by the integrated HR in combined PDAC and TCGA datasets. The result indicates that integrin-mediated tumor cell–fibroblast and tumor cell–endothelial cell communications are dominant in the network. (D) Three-dimensional plot shows the relationships with the cell–cell communication score, DNN score, risk score, and expression levels of integrins. (E) Waterflow plot indicates the enrichment of genetic variations in pancreatic cancers with high levels of cell–cell communications.
Figure 7
Figure 7
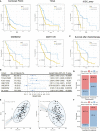
Inhibition of ITGA2 prevents PDAC growth. (A) Immunohistochemical analyses of ITGA2 expression in PDAC samples. The representative images of high and low ITGA2 staining in PDAC specimens were shown. (B) Kaplan–Meier plots show the overall survival of PDAC patients expressing high and low levels of ITGA2 protein. (C–E) Pdx1-Cre+, KrasG12D(KC) mice were orally treated with E7820 (100 mg/kg bodyweight) once a day, for 14 consecutive days. (C) The H&E staining of mice pancreatic lesions. The percentage of the lesion area was statistically compared between vehicle and E7820 treatment groups, t test, ***P < 0.001, n=6 fields. (D) Alcian blue staining of pancreas tissues. The representative images and statistically analysis results of CK19 and Ki67 immunohistochemical staining slides, t test, ***P < 0.001, ****P < 0.0001, n=6 fields. (E) Immunohistochemistry analyses of pancreas tissues from vehicle and E7820-treated KC mice by anti-αSMA, anti-CD31, and anti-Gr1 antibodies, t test, **P < 0.01, ***P < 0.001, n=6 fields. Bar=200 μm.

Similar articles

Cited by

References

    1. Mizrahi JD, Surana R, Valle JW, Shroff RT. Pancreatic Cancer. Lancet (2020) 395(10242):2008–20. doi: 10.1016/s0140-6736(20)30974-0 - DOI - PubMed
    1. Grossberg AJ, Chu LC, Deig CR, Fishman EK, Hwang WL, Maitra A, et al. . Multidisciplinary Standards of Care and Recent Progress in Pancreatic Ductal Adenocarcinoma. CA Cancer J Clin (2020) 70(5):375–403. doi: 10.3322/caac.21626 - DOI - PMC - PubMed
    1. Rahib L, Smith BD, Aizenberg R, Rosenzweig AB, Fleshman JM, Matrisian LM. Projecting Cancer Incidence and Deaths to 2030: The Unexpected Burden of Thyroid, Liver, and Pancreas Cancers in the United States. Cancer Res (2014) 74(11):2913–21. doi: 10.1158/0008-5472.CAN-14-0155 - DOI - PubMed
    1. Bailey P, Chang DK, Nones K, Johns AL, Patch AM, Gingras MC, et al. . Genomic Analyses Identify Molecular Subtypes of Pancreatic Cancer. Nature (2016) 531(7592):47–52. doi: 10.1038/nature16965 - DOI - PubMed
    1. Dreyer SB, Upstill-Goddard R, Legrini A, Biankin AV, Glasgow Precision Oncology Laboratory. Jamieson NB, et al. . Genomic and Molecular Analyses Identify Molecular Subtypes of Pancreatic Cancer Recurrence. Gastroenterology (2022) 162(1):320–4.e4. doi: 10.1053/j.gastro.2021.09.022 - DOI - PMC - PubMed