

Construction of m6A-Related lncRNA Prognostic Signature Model and Immunomodulatory Effect in Glioblastoma Multiforme
- PMID: 35719945
- PMCID: PMC9201336
- DOI: 10.3389/fonc.2022.920926
Construction of m6A-Related lncRNA Prognostic Signature Model and Immunomodulatory Effect in Glioblastoma Multiforme
Abstract
Background: Glioblastoma multiforme (GBM), the most prevalent and aggressive of primary malignant central nervous system tumors (grade IV), has a poor clinical prognosis. This study aimed to assess and predict the survival of GBM patients by establishing an m6A-related lncRNA signaling model and to validate its validity, accuracy and applicability.
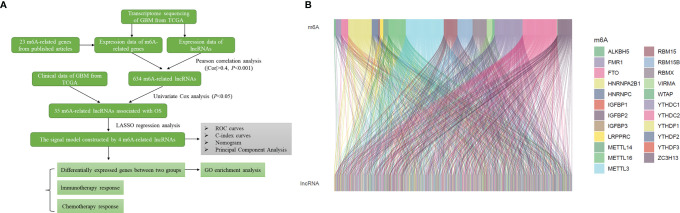
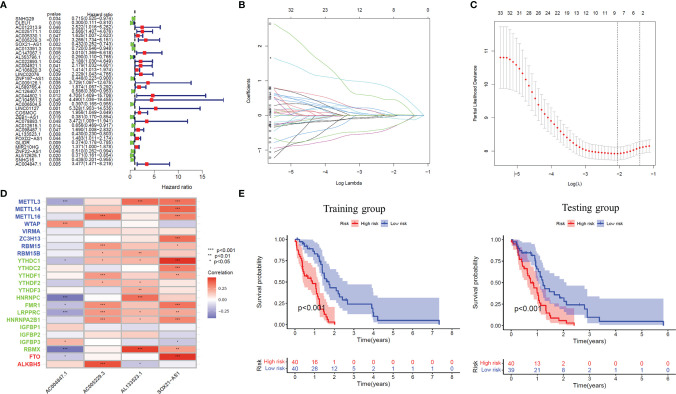
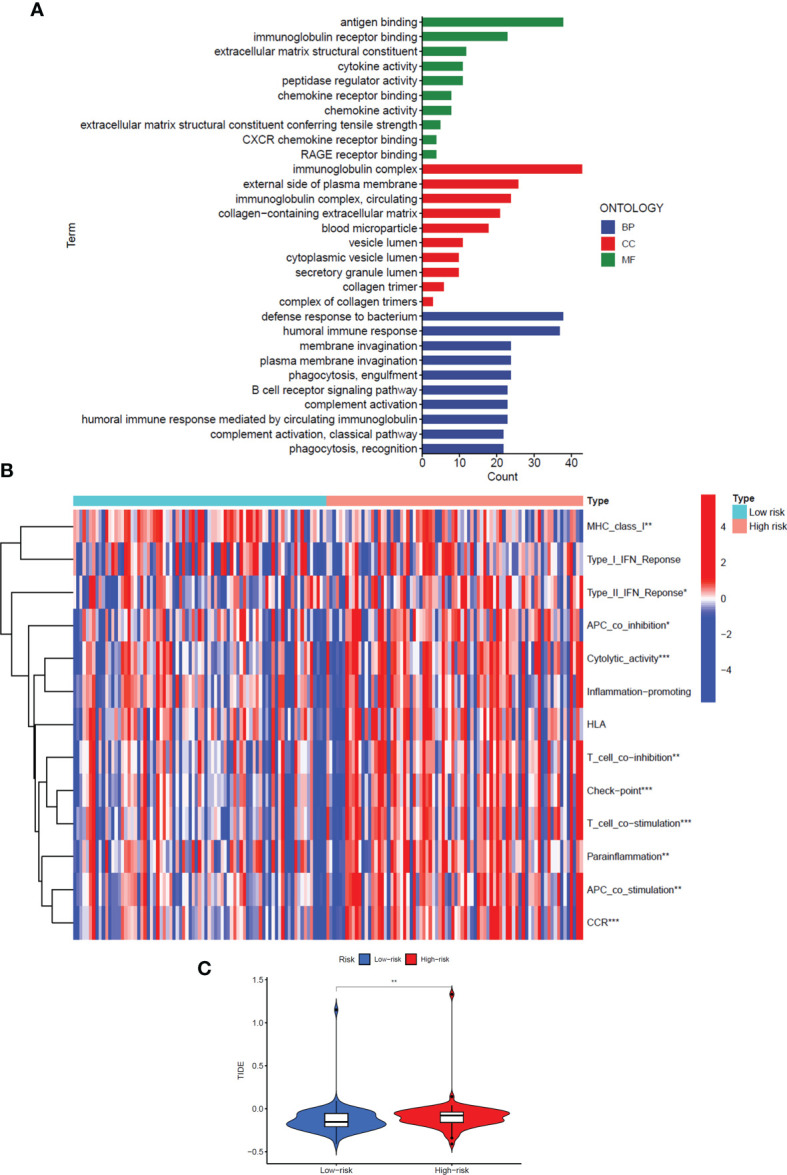
Methods: RNA sequencing data and clinical data of GBM patients were obtained from TCGA data. First, m6A-associated lncRNAs were screened and lncRNAs associated with overall survival in GBM patients were obtained. Subsequently, the signal model was established using LASSO regression analysis, and its accuracy and validity are further verified. Finally, GO enrichment analysis was performed, and the influence of this signature on the immune regulation response and anticancer drug sensitivity of GBM patients was discussed.
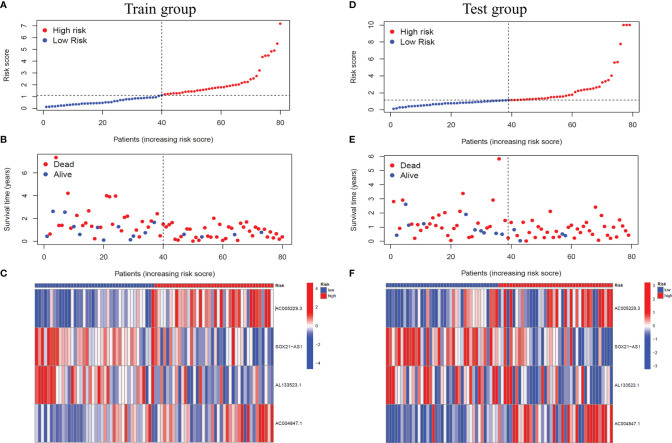
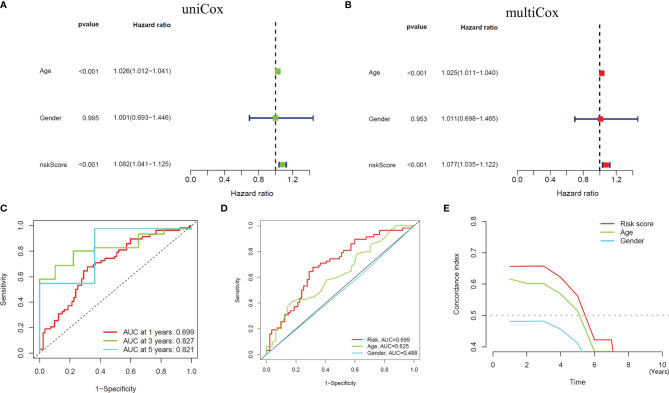
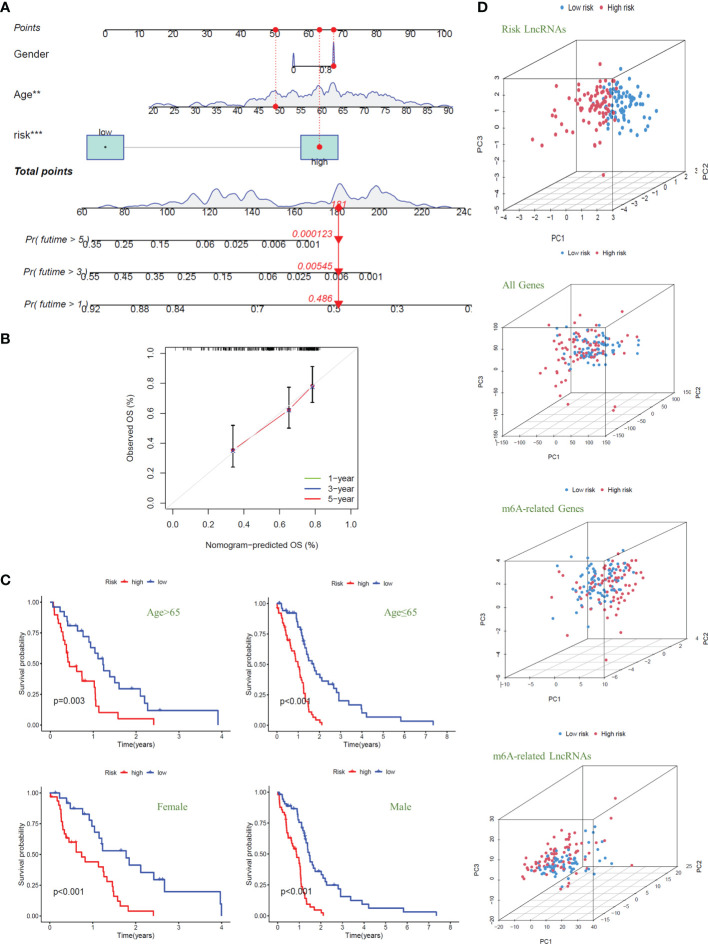
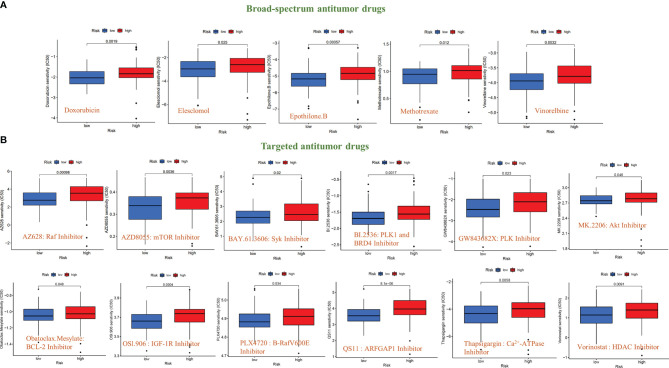
Results: The signature constructed by four lncRNAs AC005229.3, SOX21-AS1, AL133523.1, and AC004847.1 is obtained. Furthermore, the signature proved to be effective and accurate in predicting and assessing the survival of GBM patients and could function independently of other clinical characteristics (Age, Gender and IDH1 mutation). Finally, Immunosuppression-related factors, including APC co-inhibition, T-cell co-inhibition, CCR and Check-point, were found to be significantly up-regulated in GBM patients in the high-risk group. Some chemotherapeutic drugs (Doxorubicin and Methotrexate) and targeted drugs (AZD8055, BI.2536, GW843682X and Vorinostat) were shown to have higher IC50 values in patients in the high-risk group.
Conclusion: We constructed an m6A-associated lncRNA risk model to predict the prognosis of GBM patients and provide new ideas for the treatment of GBM. Further biological experiments can be conducted on this basis to validate the clinical value of the model.
Keywords: Glioblastoma multiforme; Immunotherapy; LncRNAs; Prognosis; m6A.
Copyright © 2022 Xie, Yan, Gao, Li, Zhou and Liu.
Conflict of interest statement
The authors declare that the research was conducted in the absence of any commercial or financial relationships that could be construed as a potential conflict of interest.
Figures
Similar articles
-
Comprehensive analysis of prognosis of patients with GBM based on 4 m6A-related lncRNAs and immune cell infiltration.Heliyon. 2023 Jan 5;9(2):e12838. doi: 10.1016/j.heliyon.2023.e12838. eCollection 2023 Feb. Heliyon. 2023. PMID: 36747529 Free PMC article.
-
Identification and validation of lncRNAs involved in m6A regulation for patients with ovarian cancer.Cancer Cell Int. 2021 Jul 8;21(1):363. doi: 10.1186/s12935-021-02076-7. Cancer Cell Int. 2021. PMID: 34238292 Free PMC article.
-
Identification of Immune-Related lncRNA Prognostic Signature and Molecular Subtypes for Glioblastoma.Front Immunol. 2021 Nov 25;12:706936. doi: 10.3389/fimmu.2021.706936. eCollection 2021. Front Immunol. 2021. PMID: 34899682 Free PMC article.
-
Systematic integration of m6A regulators and autophagy-related genes in combination with long non-coding RNAs predicts survival in glioblastoma multiforme.Sci Rep. 2023 Oct 11;13(1):17232. doi: 10.1038/s41598-023-44087-6. Sci Rep. 2023. PMID: 37821547 Free PMC article.
-
Evolving Insights Into the Biological Function and Clinical Significance of Long Noncoding RNA in Glioblastoma.Front Cell Dev Biol. 2022 Apr 21;10:846864. doi: 10.3389/fcell.2022.846864. eCollection 2022. Front Cell Dev Biol. 2022. PMID: 35531099 Free PMC article. Review.
Cited by
-
Systematic transcriptomic analysis of childhood medulloblastoma identifies N6-methyladenosine-dependent lncRNA signatures associated with molecular subtype, immune cell infiltration, and prognosis.Acta Neuropathol Commun. 2024 Aug 28;12(1):138. doi: 10.1186/s40478-024-01848-2. Acta Neuropathol Commun. 2024. PMID: 39198884 Free PMC article.
-
Using integrated analysis from multicentre studies to identify RNA methylation-related lncRNA risk stratification systems for glioma.Cancer Cell Int. 2023 Aug 5;23(1):156. doi: 10.1186/s12935-023-03001-w. Cancer Cell Int. 2023. PMID: 37542290 Free PMC article.
-
Comprehensive machine learning-based integration develops a novel prognostic model for glioblastoma.Mol Ther Oncol. 2024 Jun 17;32(3):200838. doi: 10.1016/j.omton.2024.200838. eCollection 2024 Sep 19. Mol Ther Oncol. 2024. PMID: 39072291 Free PMC article.
-
Comprehensive analysis of cuproptosis-related lncRNAs model in tumor immune microenvironment and prognostic value of cervical cancer.Front Pharmacol. 2022 Nov 30;13:1065701. doi: 10.3389/fphar.2022.1065701. eCollection 2022. Front Pharmacol. 2022. PMID: 36532719 Free PMC article.
-
METTL3-induced DLGAP1-AS2 promotes non-small cell lung cancer tumorigenesis through m6A/c-Myc-dependent aerobic glycolysis.Cell Cycle. 2022 Dec;21(24):2602-2614. doi: 10.1080/15384101.2022.2105885. Epub 2022 Aug 16. Cell Cycle. 2022. PMID: 35972892 Free PMC article.
References
-
- Tamimi AF, Juweid M. Epidemiology and Outcome of Glioblastoma. De Vleeschouwer S, editor. Brisbane, AU: Glioblastoma, Codon Publications; (2017). - PubMed
LinkOut - more resources
Full Text Sources
Miscellaneous