

KCNN4 is a Potential Biomarker for Predicting Cancer Prognosis and an Essential Molecule that Remodels Various Components in the Tumor Microenvironment: A Pan-Cancer Study
- PMID: 35720112
- PMCID: PMC9205469
- DOI: 10.3389/fmolb.2022.812815
KCNN4 is a Potential Biomarker for Predicting Cancer Prognosis and an Essential Molecule that Remodels Various Components in the Tumor Microenvironment: A Pan-Cancer Study
Abstract
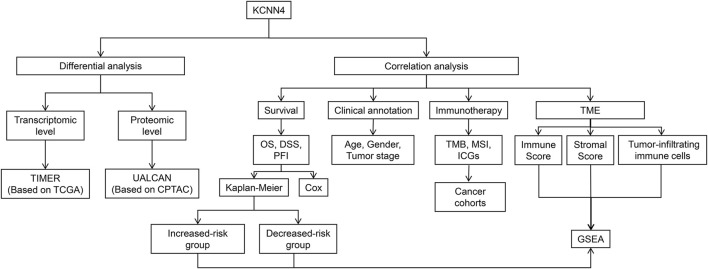
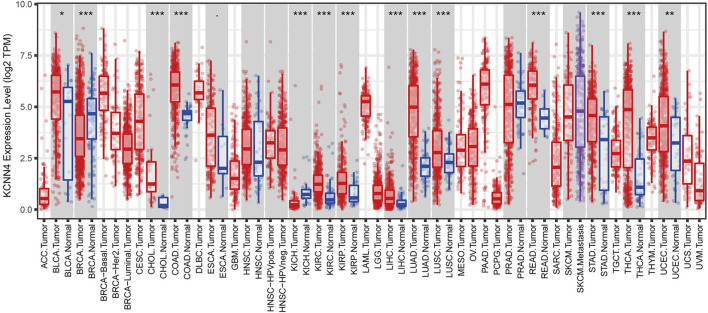
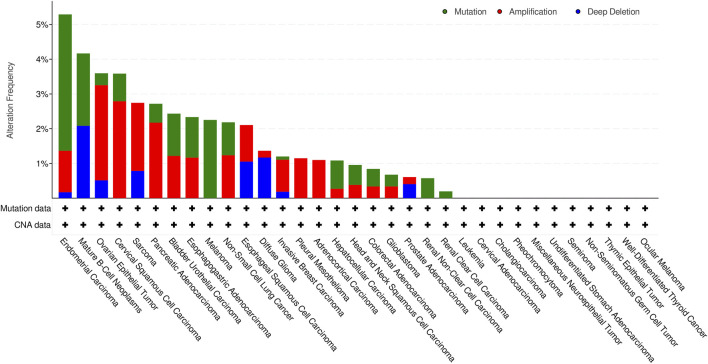
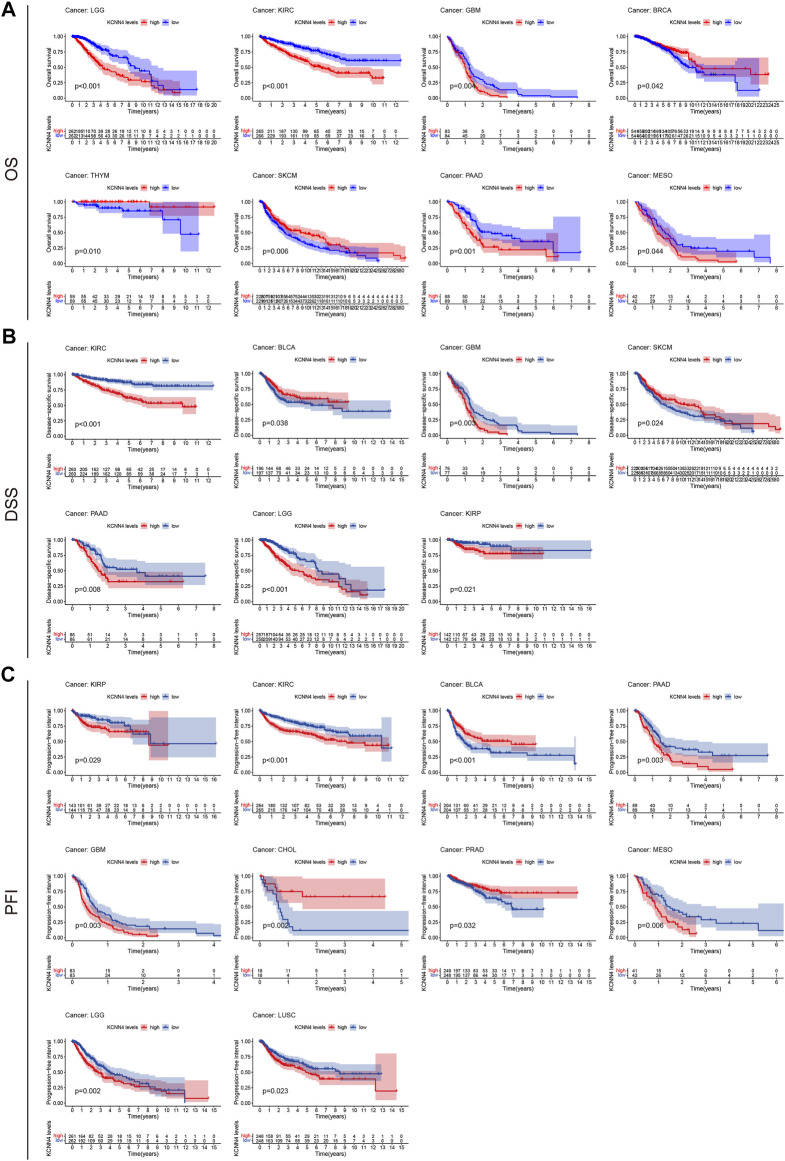
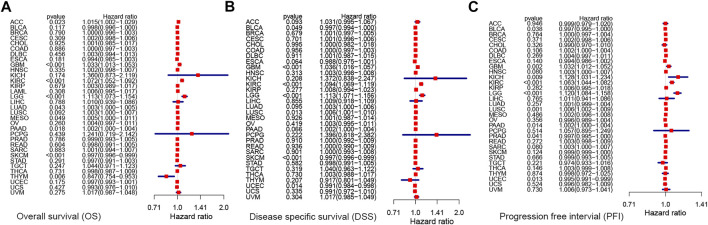
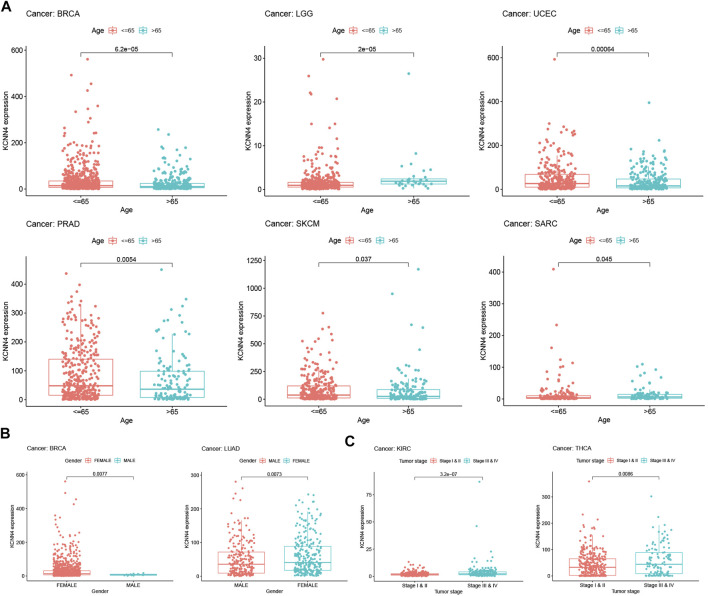
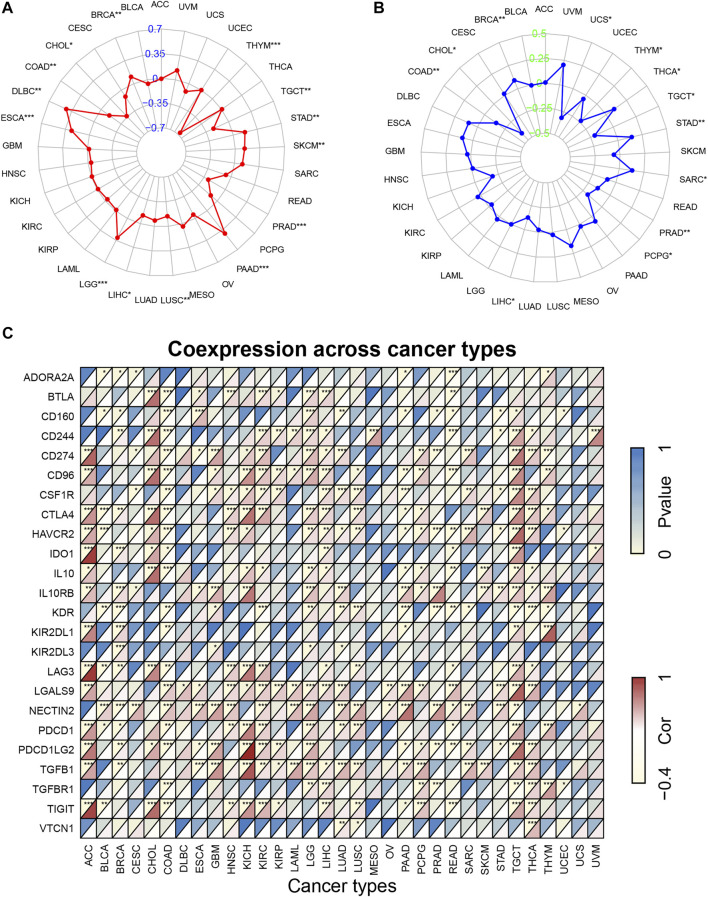
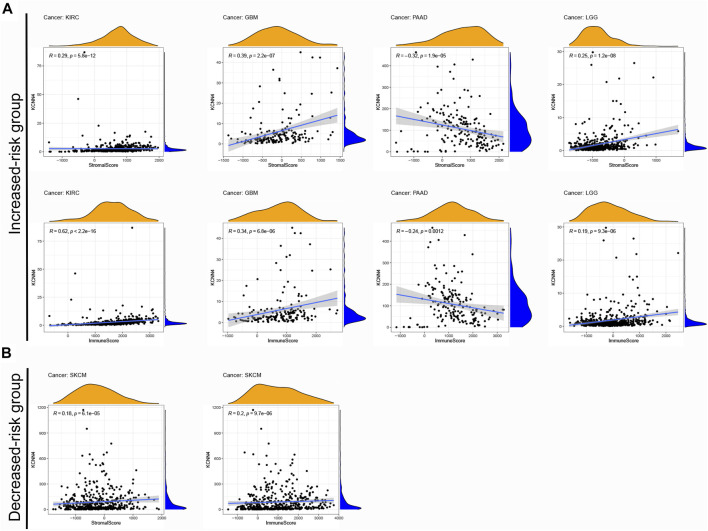
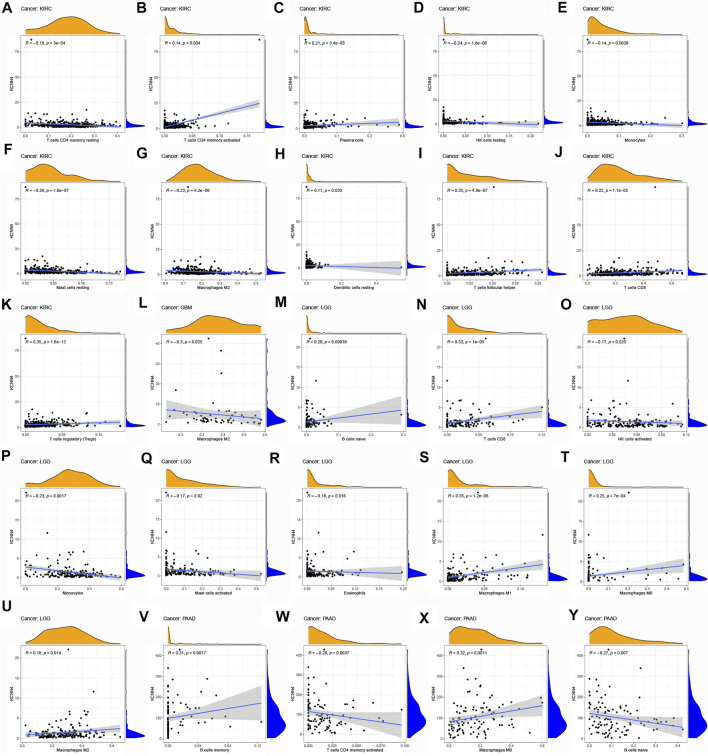
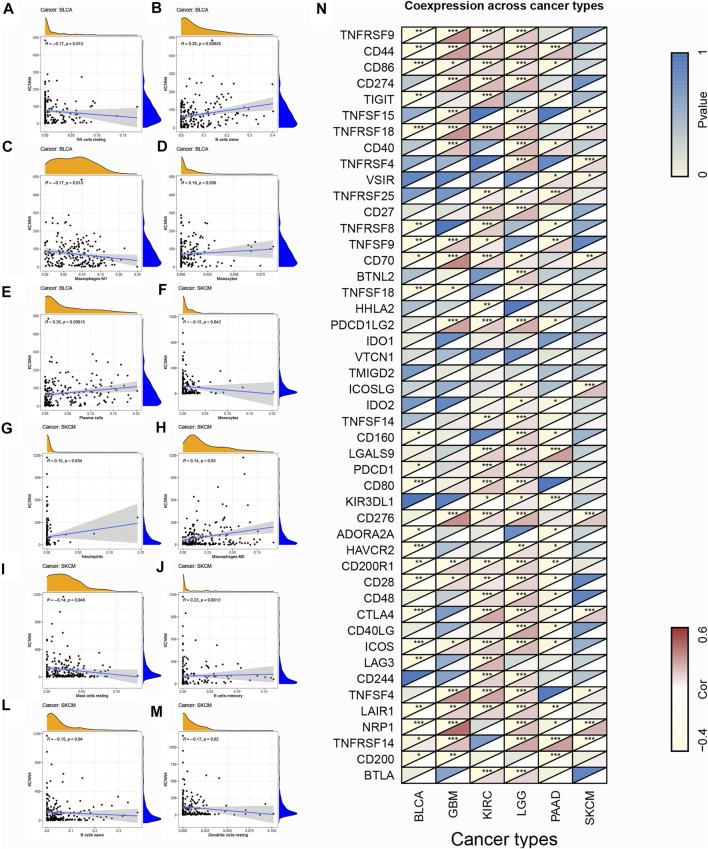
Objectives: Potassium Calcium-Activated Channel Subfamily N Member 4 (KCNN4) is a member of the KCNN family. Studies have revealed that KCNN4 is implicated in various physiological processes as well as promotes the malignant phenotypes of cancer cells. However, little is known about its associations with survival outcomes across varying cancer types. Methods: Herein, we systematically explored the prognostic value of KCNN4 in the pan-cancer dataset retrieved from multiple databases. Next, we performed correlation analysis of KCNN4 expression with tumor mutational burden (TMB) and microsatellite instability (MSI), and immune checkpoint genes (ICGs) to assess its potential as a predictor of immunotherapy efficacy. Afterwards, patients were divided into increased-risk group and decreased-risk group based on the contrasting survival outcomes in various cancer types. Furthermore, the underlying mechanisms of the distinctive effects were analyzed using ESTIMATE, CIBERSORT algorithms, and Gene Set Enrichment Analysis (GSEA) analysis. Results: KCNN4 expression levels were aberrant in transcriptomic and proteomic levels between cancer and normal control tissues in pan-cancer datasets, further survival analysis elucidated that KCNN4 expression was correlated to multiple survival data, and clinical annotations. Besides, KCNN4 expression was correlated to TMB and MSI levels in 14 types and 12 types of pan-cancers, respectively. Meanwhile, different types of cancer have specific tumor-infiltrating immune cell (TICs) profiles. Conclusions: Our results revealed that KCNN4 could be an essential biomarker for remodeling components in the tumor microenvironment (TME), and a robust indicator for predicting prognosis as well as immunotherapy response in pan-cancer patients.
Keywords: KCNN4; biomarker; pan-cancer; tumor microenvironment; tumor-infiltrating immune cells.
Copyright © 2022 Chen, Su and Mo.
Conflict of interest statement
The authors declare that the research was conducted in the absence of any commercial or financial relationships that could be construed as a potential conflict of interest.
Figures

Similar articles
-
A Systematic Immune and Prognostic Analysis of CD48 Interaction with Tumor Microenvironment in Pan-Cancer.Int J Gen Med. 2023 Nov 13;16:5255-5269. doi: 10.2147/IJGM.S431696. eCollection 2023. Int J Gen Med. 2023. PMID: 38021043 Free PMC article.
-
KCNN4 is a potential prognostic marker and critical factor affecting the immune status of the tumor microenvironment in kidney renal clear cell carcinoma.Transl Androl Urol. 2021 Jun;10(6):2454-2470. doi: 10.21037/tau-21-332. Transl Androl Urol. 2021. PMID: 34295732 Free PMC article.
-
The prognostic value and immunological role of CD44 in pan-cancer study.Sci Rep. 2023 Apr 28;13(1):7011. doi: 10.1038/s41598-023-34154-3. Sci Rep. 2023. PMID: 37117249 Free PMC article.
-
A Pan-Cancer Analysis Reveals the Prognostic and Immunotherapeutic Value of Stanniocalcin-2 (STC2).Front Genet. 2022 Jul 22;13:927046. doi: 10.3389/fgene.2022.927046. eCollection 2022. Front Genet. 2022. PMID: 35937984 Free PMC article. Review.
-
Tumor Mutational Burden Predicting the Efficacy of Immune Checkpoint Inhibitors in Colorectal Cancer: A Systematic Review and Meta-Analysis.Front Immunol. 2021 Sep 29;12:751407. doi: 10.3389/fimmu.2021.751407. eCollection 2021. Front Immunol. 2021. PMID: 34659255 Free PMC article.
Cited by
-
Predicting prognosis and immunotherapeutic response of clear cell renal cell carcinoma.Front Pharmacol. 2022 Oct 14;13:984080. doi: 10.3389/fphar.2022.984080. eCollection 2022. Front Pharmacol. 2022. PMID: 36313281 Free PMC article.
-
Increased KCNN4 Expression Is Correlated With Poor Survival in Lower Grade Glioma.Cancer Diagn Progn. 2023 Jul 3;3(4):428-432. doi: 10.21873/cdp.10235. eCollection 2023 Jul-Aug. Cancer Diagn Progn. 2023. PMID: 37405224 Free PMC article.
-
A Systematic Immune and Prognostic Analysis of CD48 Interaction with Tumor Microenvironment in Pan-Cancer.Int J Gen Med. 2023 Nov 13;16:5255-5269. doi: 10.2147/IJGM.S431696. eCollection 2023. Int J Gen Med. 2023. PMID: 38021043 Free PMC article.
-
ACYP2 functions as an innovative nano-therapeutic target to impede the progression of hepatocellular carcinoma by inhibiting the activity of TERT and the KCNN4/ERK pathway.J Nanobiotechnology. 2024 Sep 12;22(1):557. doi: 10.1186/s12951-024-02827-4. J Nanobiotechnology. 2024. PMID: 39267048 Free PMC article.
-
The Ion Channel Gene KCNAB2 Is Associated with Poor Prognosis and Loss of Immune Infiltration in Lung Adenocarcinoma.Cells. 2022 Oct 31;11(21):3438. doi: 10.3390/cells11213438. Cells. 2022. PMID: 36359834 Free PMC article.
References
-
- Attali D., Baker C. (2019). ggExtra: Add Marginal Histograms to ‘ggplot2’, and More ‘ggplot2’enhancements. R package version.
LinkOut - more resources
Full Text Sources