. 2022 Jun 3:9:904098.
doi: 10.3389/fmolb.2022.904098. eCollection 2022.

Comprehensive Analyses of Ferroptosis-Related Alterations and Their Prognostic Significance in Glioblastoma

Affiliations

Comprehensive Analyses of Ferroptosis-Related Alterations and Their Prognostic Significance in Glioblastoma

Yuan Tian et al. Front Mol Biosci. .

Abstract

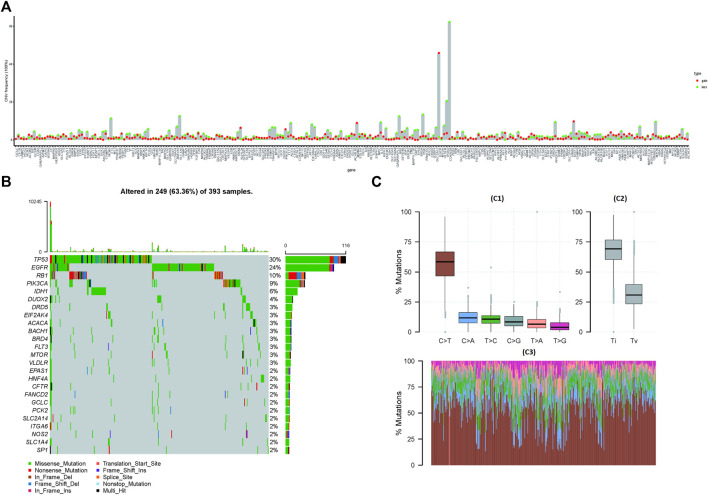
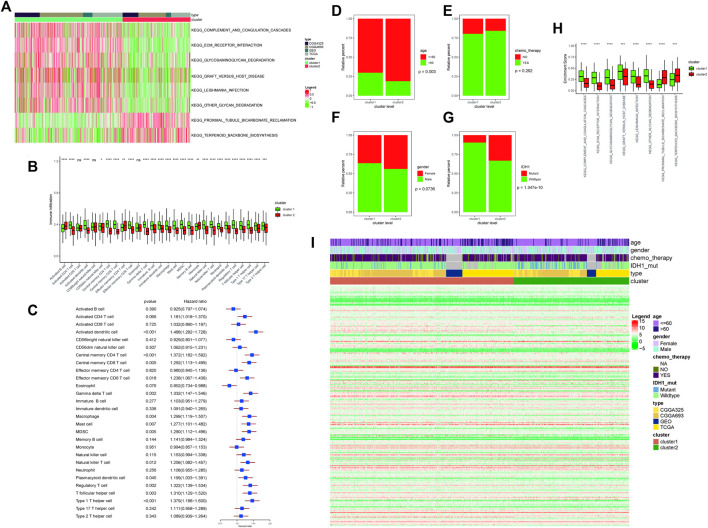
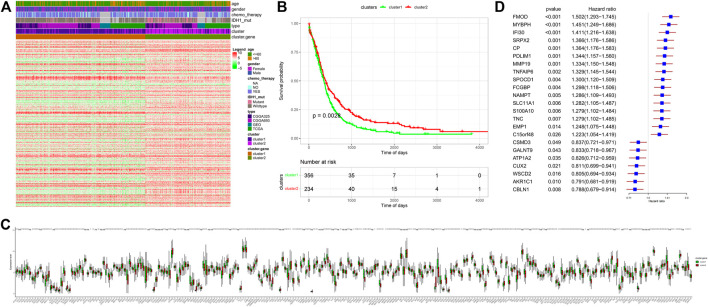
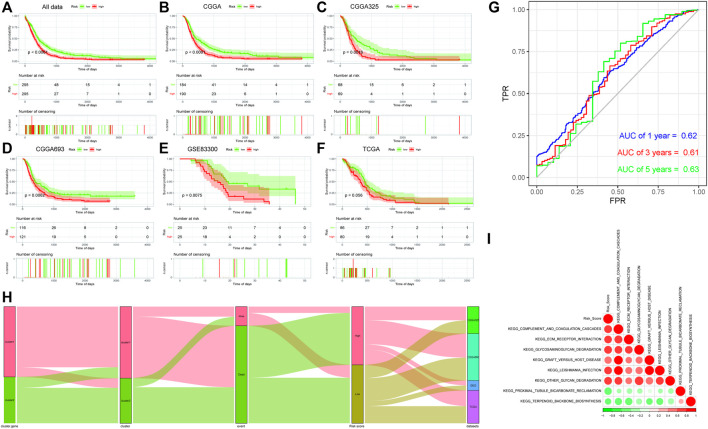
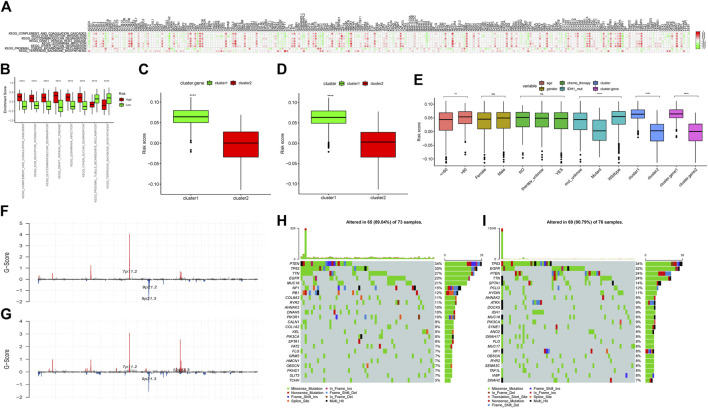
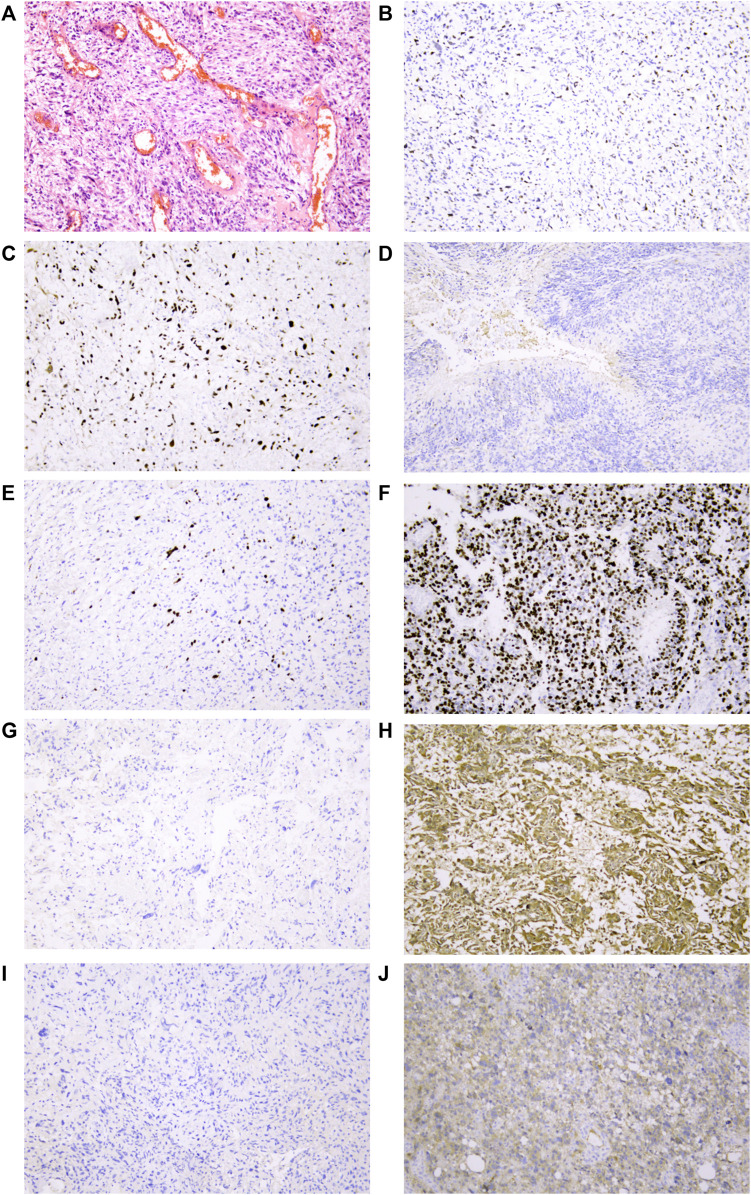
Background: This study was designed to explore the implications of ferroptosis-related alterations in glioblastoma patients. Method: After obtaining the data sets CGGA325, CGGA623, TCGA-GBM, and GSE83300 online, extensive analysis and mutual verification were performed using R language-based analytic technology, followed by further immunohistochemistry staining verification utilizing clinical pathological tissues. Results: The analysis revealed a substantial difference in the expression of ferroptosis-related genes between malignant and paracancerous samples, which was compatible with immunohistochemistry staining results from clinicopathological samples. Three distinct clustering studies were run sequentially on these data. All of the findings were consistent and had a high prediction value for glioblastoma. Then, the risk score predicting model containing 23 genes (CP, EMP1, AKR1C1, FMOD, MYBPH, IFI30, SRPX2, PDLIM1, MMP19, SPOCD1, FCGBP, NAMPT, SLC11A1, S100A10, TNC, CSMD3, ATP1A2, CUX2, GALNT9, TNFAIP6, C15orf48, WSCD2, and CBLN1) on the basis of "Ferroptosis.gene.cluster" was constructed. In the subsequent correlation analysis of clinical characteristics, tumor mutation burden, HRD, neoantigen burden and chromosomal instability, mRNAsi, TIDE, and GDSC, all the results indicated that the risk score model might have a better predictive efficiency. Conclusion: In glioblastoma, there were a large number of abnormal ferroptosis-related alterations, which were significant for the prognosis of patients. The risk score-predicting model integrating 23 genes would have a higher predictive value.

Keywords: alterations; ferroptosis; glioblastoma; predictive models; prognosis.


Conflict of interest statement

The authors declare that the research was conducted in the absence of any commercial or financial relationships that could be construed as a potential conflict of interest.

Figures

FIGURE 1
FIGURE 1
Mutations and copy number variations (CNVs) in ferroptosis-related genes. (A) CNV of ferroptosis-related genes. The abscissa axis represents the name of the related genes; the ordinate axis represents the CNV frequency. The type of CNV represented by red is gain; the type of CNV represented by green is loss. (B) Waterfall chart of ferroptosis-related gene mutations. The ordinate axis on the left represents the names of the top 25 genes, and the ordinate axis on the right represents the mutation frequency of the corresponding genes; different colors represent different types of gene alterations. (C) SNP of TCGA-GBM samples (C1): the abscissa axis represents the type of SNP; the ordinate axis represents the mutation percentage. (C2): the abscissa axis represents the type of variants (transitions or transversions); the ordinate axis represents the percentage of mutations. (C3): the abscissa axis represents the TCGA-GBM samples, in which different colors represent different SVP types, and the ordinate axis represents the percentage of variation in each sample.
FIGURE 2
FIGURE 2
(A) Enrichment score results of differential enrichment items between the two subtypes. Legend column: different colors represent different scores; cluster column: green represents cluster 1, and red represents cluster 2; type column: different colors represent the names of different databases. (B) Differences in immune-infiltrating cells in different ferroptosis clusters; the abscissa axis represents different immune-infiltrating cells; the ordinate axis represents the degree of immune cell infiltration. Cluster column: green represents cluster 1, and red represents cluster 2; ∗∗∗∗means p < 0.0001, ∗∗∗means p < 0.001, ∗∗means p < 0.01, and means p < 0.05. (C) Survival risk analysis of immune-infiltrating cells. The type of immune-infiltrating cells was listed on the left side; the HR and the forest plot corresponding to immune-infiltrating cells were listed on the right side. (D) Correlation analyses between ferroptosis clusters and clinical characteristics: the distribution of different age patients in cluster 1 and cluster 2. The abscissa axis represents different cluster levels; the ordinate axis represents relative percent. Age column: red means age≤ 60; green means age >60. (E) Correlation analyses between ferroptosis clusters and clinical characteristics: the distribution of patients receiving chemotherapy in cluster 1 and cluster 2. The abscissa axis represents different cluster levels; the ordinate axis represents relative percent. Chemotherapy column: red represents no chemotherapy, and green represents chemotherapy. (F) Correlation analyses between ferroptosis clusters and clinical characteristics: the distribution of patients’ gender ratio in cluster 1 and cluster 2. The abscissa axis represents different cluster levels; the ordinate axis represents relative percent. Gender column: red represents female, and green represents male. (G) Correlation analyses between ferroptosis clusters and clinical characteristics: the distribution of IDH1 mutation status in cluster 1 and cluster 2. The abscissa axis represents different cluster levels; the ordinate axis represents relative percent. IDH1 column: red represents mutant status, and green represents wild type. (H) Correlation analyses between ferroptosis clusters and clinical characteristics: the distribution of differential enrichment pathway scores in the two subtypes. The abscissa axis represents different signal pathways; the ordinate axis represents enrichment scores. Cluster column: green represents cluster 1, and red represents cluster 2. (I) Display of ferroptosis-related genes in different ferroptosis clusters. Age column: different colors represent different age ranges; gender column: different colors represent different genders; chemotherapy column: different colors represent the status of chemotherapy; IDH1 column: different colors represent IDH1 mutation status; type column: different colors represent different data types; cluster column: different colors represent different clusters.
FIGURE 3
FIGURE 3
“Ferroptosis.gene.cluster” obtained by the clustering analysis of DEGs. (A) Heatmap of DEGs. Age column: different colors represent different age ranges; gender column: different colors represent different genders; chemotherapy column: different colors represent the status of chemotherapy; IDH1 column: different colors represent IDH1 mutation status; type column: different colors represent different data types; cluster column: different colors represent different clusters; Cluster.gene column: different colors represent different cluster.gene. (B) Kaplan–Meier survival analysis curve of Ferroptosis.gene.cluster grouping. The abscissa axis represents survival time, and the ordinate axis represents survival probability. (C) Expression differences of ferroptosis-related genes in the “Ferroptosis.gene.cluster” group. The abscissa axis represents the name of ferroptosis-related genes; the ordinate axis represents the expression level of the corresponding ferroptosis-related genes. (D) Risk score forest plot constructed by 23 key genes. The left column represents 23 key genes. The middle parts are p-value and hazard ratio. The right column is the forest plot of 23 key genes.
FIGURE 4
FIGURE 4
(A–F): Kaplan–Meier survival analysis results of risk score subgroups in different data cohorts. The abscissa axis represents survival time, and the ordinate axis represents survival probability. (A) Kaplan–Meier survival analysis results of risk score subgroups in the comprehensive data cohort. (B) Kaplan–Meier survival analysis results of risk score subgroups in the CGGA data cohort. (C) Kaplan–Meier survival analysis results of risk score subgroups in the CGGA325 data cohort. (D) Kaplan–Meier survival analysis results of risk score subgroups in the CGGA693 data cohort. (E) Kaplan–Meier survival analysis results of risk score subgroups in the GSE83300 data cohort. (F) Kaplan–Meier survival analysis results of risk score subgroups in the TCGA data cohort. (G) Time-based ROC curve: the abscissa axis represents FPR (false-positive rate), and the ordinate axis represents TPR (true-positive rate). (H) Sankey diagram based on the distribution of characteristics. (I) Correlation analyses between the risk score and differential enrichment pathway score.
FIGURE 5
FIGURE 5
(A) Correlation analyses between ferroptosis-related genes and differential enrichment pathway scores. The abscissa axis represents the names of ferroptosis-related genes; the ordinate axis represents differential enrichment pathways. The legend on the right represents different Pearson correlation coefficients. (B) Difference in the enrichment scores of the subgroups with high- and low-risk scores. The abscissa axis represents pathways with different enrichment scores; the ordinate axis represents enrichment scores. Red represents the high-score group; green represents the low-score group. ∗∗∗∗∗means p < 0.0001; ∗∗∗ means p < 0.001; ∗∗ means p < 0.01; and means p < 0.05. (C) Risk score difference analysis between the two “Ferroptosis.gene.cluster”. The abscissa axis represents different clusters; the ordinate axis represents risk score. ∗∗∗∗ means p < 0.0001; ∗∗∗ means p < 0.001; ∗∗ means p < 0.01; and means p < 0.05. (D) Risk score difference analysis between ferroptosis clusters. The abscissa axis represents different ferroptosis clusters; the ordinate axis represents different risk scores. ∗∗∗∗ means p < 0.0001; ∗∗∗ means p < 0.001; ∗∗ means p < 0.01; and means p < 0.05. (E) Risk score difference analysis for different clinical characteristics and different molecular types. The abscissa axis represents different clinical features and molecular types; the ordinate axis represents different risk scores. ∗∗∗∗means p < 0.0001; ∗∗∗ means p < 0.001; ∗∗means p < 0.01; and means p < 0.05. (F) Difference of CNV sites in the high-risk score group. The abscissa axis represents the location of CNV on the chromosome; the ordinate axis represents G-score. (G) Difference of CNV sites in the low-risk score group. The abscissa axis represents the location of CNV on the chromosome; the ordinate axis represents G-score. (H) Mutations in the high-risk score group. The left column represents the name of the mutant genes; the right column represents the percentage of genes with mutations; different colors represent different mutation types. (I) Mutations in the low-risk score group. The left column represents the name of the mutant genes; the right column represents the percentage of genes with mutations; different colors represent different mutation types.
FIGURE 6
FIGURE 6
Representative IHC analyses of p53/Ki-67/MGMT/IDH1R132H protein expression in cancer cells of glioblastoma patients. (A) Representative glioblastoma with HE staining. (B) Normal/wild-type p53 protein expression pattern with partly and weakly positive expression in tumor nuclei. Two patterns were identified as abnormal/mutant-staining pattern. (C) Abnormal overexpression of p53 protein with strong staining in nearly all tumor nuclei compared to internal control central fibroblasts. (D). Abnormal complete absence of p53 staining with sufficient staining of internal controls (fibroblasts, endothelial cells, or lymphocytes). (E) Low proportion of Ki-67 protein expression in tumor nuclei suggested that the tumor has low proliferative activity. (F) High proportion of Ki-67 protein expression in tumor nuclei suggested that the tumor has high proliferative activity. (G) Negative expression of MGMT protein in tumor nuclei might be related to MGMT methylation. (H) Strong positive expression of MGMT protein in tumor nuclei. (I) IDH1 R132H wild-type protein expression pattern with cytoplasmic negative staining of tumor cells. (J) IDH1 R132H mutation protein expression pattern with cytoplasmic positive staining of tumor cells. All mages were taken at 10 ×10 magnification on the Leica DM2000 microscope.

Similar articles

Cited by

References

    1. Adolfsson A., Ackerman M., Brownstein N. C. (2019). To Cluster, or Not to Cluster: An Analysis of Clusterability Methods. Pattern Recognit. 88, 13–26. 10.1016/j.patcog.2018.10.026 - DOI
    1. Andrews L. P., Somasundaram A., Moskovitz J. M., Szymczak-Workman A. L., Liu C., Cillo A. R., et al. (2020). Resistance to PD1 Blockade in the Absence of Metalloprotease-Mediated LAG3 Shedding. Sci. Immunol. 5 (49), eabc2728. 10.1126/sciimmunol.abc2728 - DOI - PMC - PubMed
    1. Bayik D., Zhou Y., Park C., Hong C., Vail D., Silver D. J., et al. (2020). Myeloid-Derived Suppressor Cell Subsets Drive Glioblastoma Growth in a Sex-specific Manner. Cancer Discov. 10 (8), 1210–1225. 10.1158/2159-8290.CD-19-1355 - DOI - PMC - PubMed
    1. Bi Y., Wu Z.-H., Cao F. (2022). Prognostic Value and Immune Relevancy of a Combined Autophagy-, Apoptosis- and Necrosis-Related Gene Signature in Glioblastoma. BMC Cancer 22 (1), 233. 10.1186/s12885-022-09328-3 - DOI - PMC - PubMed
    1. Binder Z. A., Thorne A. H., Bakas S., Wileyto E. P., Bilello M., Akbari H., et al. (2018). Epidermal Growth Factor Receptor Extracellular Domain Mutations in Glioblastoma Present Opportunities for Clinical Imaging and Therapeutic Development. Cancer Cell 34 (1), 163–177. 10.1016/j.ccell.2018.06.006 - DOI - PMC - PubMed