. 2022 Jun 16:10:goac028.
doi: 10.1093/gastro/goac028. eCollection 2022.

The association between disruption of the circadian rhythm and aggravation of colitis in mice

Affiliations

The association between disruption of the circadian rhythm and aggravation of colitis in mice

Yi-Dong Chen et al. Gastroenterol Rep (Oxf). .

Abstract

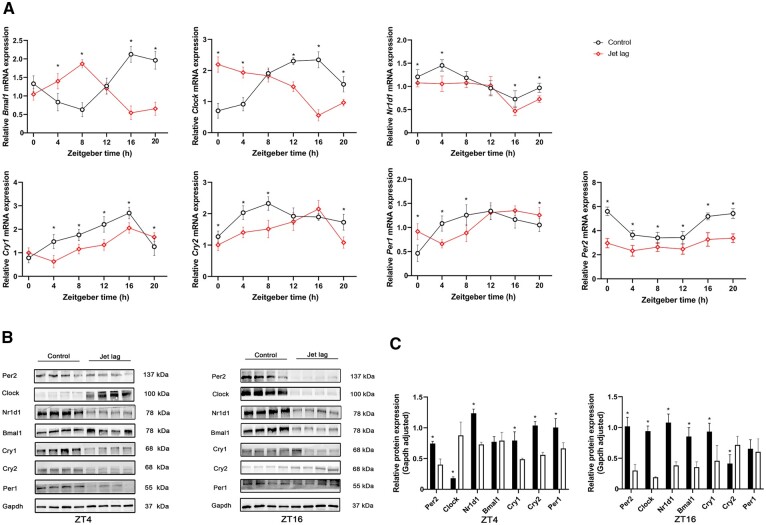
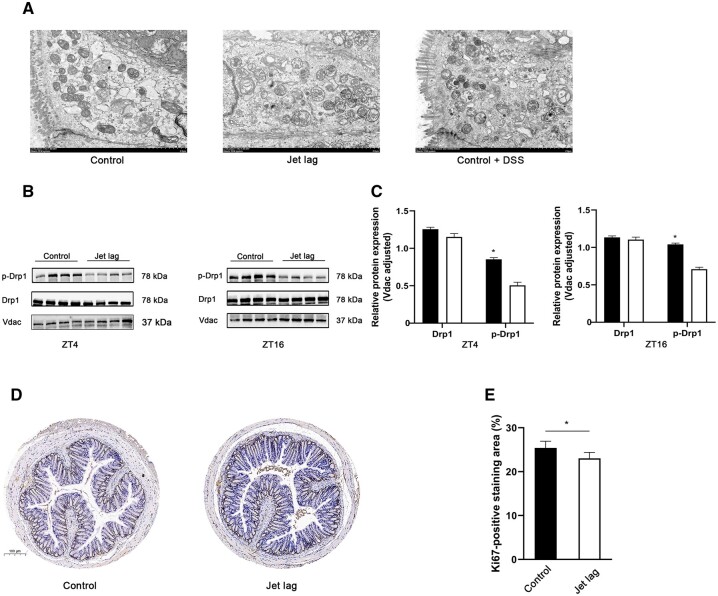
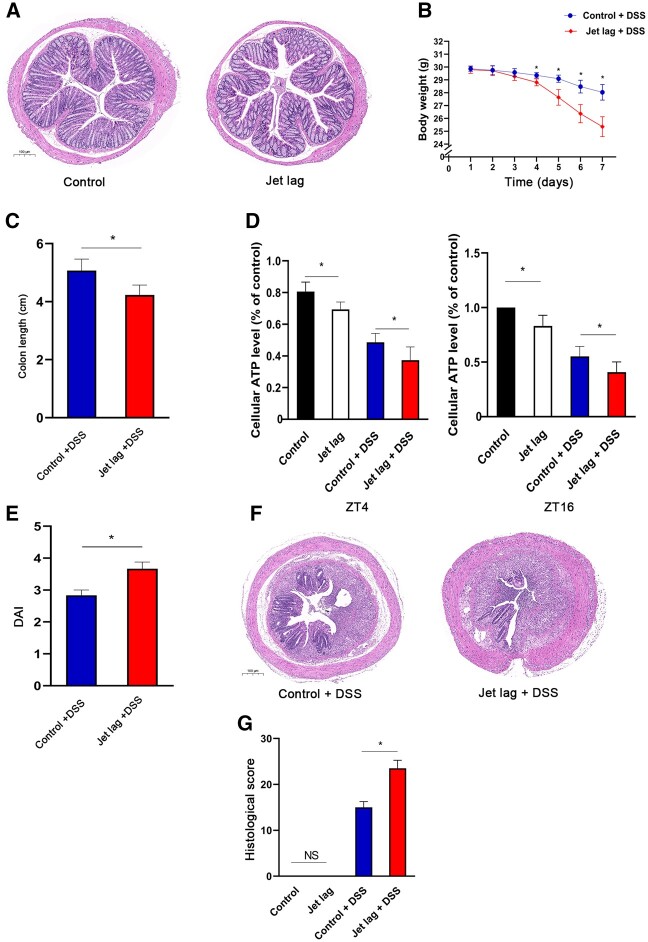
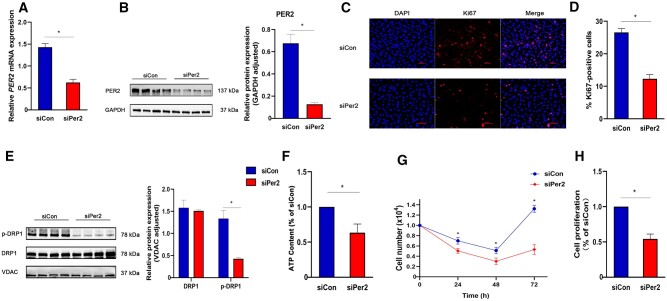
Delayed recovery from ulcerative colitis is mainly due to impaired healing of the intestinal epithelium after inflammation. The circadian rhythm controls cell proliferation and energy metabolism. However, the role of circadian genes in inflammatory bowel disease is largely unknown. The purpose of this study was to investigate whether disrupting the circadian rhythm in mice can worsen colitis by altering mitochondrial energy metabolism. Mice in the experimental groups were under physiologic stress with an 8-h light shift jet-lag schedule every 3 days, whereas those in the control group were not. Subsequently, half of the mice in the control and jet-lagged groups were given dextran sodium sulfate (DSS) to induce colitis. Mice in each group were euthanized at zeitgeber time (ZT)0, ZT4, ZT8, ZT12, ZT16, and ZT20. To investigate the effects of jet lag on the mice, colon specimens were subjected to hematoxylin and eosin staining to analyse mRNA and protein expression of core circadian clock genes (Bmal1, Clock, Per1, Per2, Cry1, Cry2, and Nr1d1). We analysed the mitochondrial morphology, adenosine triphosphate (ATP) levels, and the expression of dynamin-related protein 1 (Drp1) and ser637-phosphorylated (p)-Drp1, which are closely related to ATP production. We further investigated the effect of PER2 knock-down in the colon epithelial cells (CCD 841 CoN) by measuring ATP and cell proliferation levels. Disrupting the circadian rhythm changed the oscillation of clock genes in the colon of mice, altered the mitochondrial morphology of the colon specimens, decreased the expression of p-Drp1, reduced ATP production, and exacerbated inflammatory responses in mice with DSS-induced colitis. Additionally, silencing of PER2 in the colon epithelial cells reduced ATP production and cell proliferation. Disrupting the circadian rhythm in mice decreases mitochondrial energy metabolism in the colon and exacerbates symptoms of colitis.

Keywords: PER2; circadian rhythm; colitis; inflammatory bowel disease; mitochondrial energy metabolism.


Figures

Figure 1.
Figure 1.
Jet lag disrupted the rhythmicity of circadian clock genes. The total mRNA was isolated from the colon tissue and qPCR was carried out using different primers. Gapdh was used as a normalized control. (A) The qPCR assays of the core clock genes in mice in the jet-lag and control groups at different time points (six mice per group). (B) Western blot analysis of the core clock genes at zeitgeber time (ZT)4 and ZT16 (six mice per group). (C) The relative expression of Bmal1, Clock, Per1, Per2, Cry1, Cry2, and Nr1d1 normalized with Gapdh (six mice per group). Presented data are expressed as mean ± SD. *P < 0.05 vs control mice at individual time points (t-test).
Figure 2.
Figure 2.
Mitochondrial alterations after jet lag. (A) Representative mitochondrial morphological changes were detected using transmission electron microscopy (six mice per group). (B) Western blot analysis of Drp1 and p-Drp1 at ZT4 and ZT16 (six mice per group). (C) The relative expression of Drp1 and p-Drp1 normalized with Vdac (six mice per group). (D) Photomicrograph of mice colon tissue immunohistochemical analysis for Ki67. (E) Qualification of Ki67-positive staining area (six mice per group). The values are expressed as mean ± SD. *P < 0.05 vs control mice at individual time points (t-test). ZT, zeitgeber time; DDS, dextran sodium sulfate.
Figure 3.
Figure 3.
Jet lag aggravated DSS-induced colitis. Chronic circadian desynchronization alone did not have significant effects on body weight or colon histology. (A) Representative images of H&E-stained colon tissue sections revealed no significant difference in structure or lymphocyte infiltration between the two groups (six mice per group). (B) From the fourth day after DSS treatment, body weight was significantly decreased in the jet lag + DSS group than in the control + DSS group (six mice per group, t-test). (C) The colon length was significantly shorter in the jet lag + DSS group than in the control + DSS group (six mice per group; t-test). (D) The ATP level was significantly lower in the jet-lag group than in the control group, and there was a further decrease in the jet lag + DSS group compared with the ATP level in the control + DSS group at ZT4 and ZT16 (six mice per group; one-way ANOVA). (E) The disease activity index (DAI) score was significantly higher in the jet lag + DSS mice group than in control + DSS mice group (six mice per group; t-test). (F) DSS-induced colitis was exacerbated in jet-lagged mice, as evidenced by more extensive destruction of the mucosal layer and mucosal ulceration. (G) The histological score was significantly higher in jet lag + DSS mice group than in the control + DSS mice group and there was no significant difference between the control and the jet-lag groups (six mice per group; one-way ANOVA). Data are expressed as mean ± SD. *P < 0.05. ZT, zeitgeber time; DDS, dextran sodium sulfate; H&E, hematoxylin eosin; DAI, disease activity index; NS, not significant.
Figure 4.
Figure 4.
PER2 silencing inhibited proliferation and ATP production of CCD 841 CoN cells in vitro. (A) qPCR was used to detect the expression of PER2 mRNA in CCD 841 CoN cells after transfection with siRNA (n = 6). (B) Protein expressions of PER2 after transfection with siRNA (n = 6). (C) Immunofluorescence images of Ki67 expression after siRNA transfection with CCD 841 CoN cells. Red fluorescence indicated Ki67, DAPI stained nuclei (n = 6). (D) Quantification of Ki67-positive cells (n = 6). (E) Protein expressions of DRP1 and p-DRP1 after transfection with siRNA (n = 6). (F) The ATP content of CCD 841 CoN cells 72 h after transfection with siRNA (n = 6). (G) Counting of CCD 841 CoN cells 72 h after transfection with siRNA (n = 6). (H) Proliferative activity of CCD 841 CoN cells measured using WST-1 assay 72 h after transfection with siRNA (n = 6). Presented values are mean ± SD. *P < 0.05 vs siCon CCD 841 CoN cells (t-test).
None

References

    1. Torres J, Mehandru S, Colombel J-F. et al. Crohn’s disease. Lancet 2017;389:1741–55. - PubMed
    1. Kobayashi T, Siegmund B, Le Berre C. et al. Ulcerative colitis. Nat Rev Dis Primers 2020;6:74. - PubMed
    1. Martini E, Krug SM, Siegmund B. et al. Mend your fences: the epithelial barrier and its relationship with mucosal immunity in inflammatory bowel disease. Cell Mol Gastroenterol Hepatol 2017;4:33–46. - PMC - PubMed
    1. Ordás I, Eckmann L, Talamini M. et al. Ulcerative colitis. Lancet 2012;380:1606–19. - PubMed
    1. Panda S. Circadian physiology of metabolism. Science 2016;354:1008–15. - PMC - PubMed