. 2022 May 31;25(7):104498.
doi: 10.1016/j.isci.2022.104498. eCollection 2022 Jul 15.

Identification of a neural development gene expression signature in colon cancer stem cells reveals a role for EGR2 in tumorigenesis

Affiliations

Identification of a neural development gene expression signature in colon cancer stem cells reveals a role for EGR2 in tumorigenesis

Joseph L Regan et al. iScience. .

Abstract

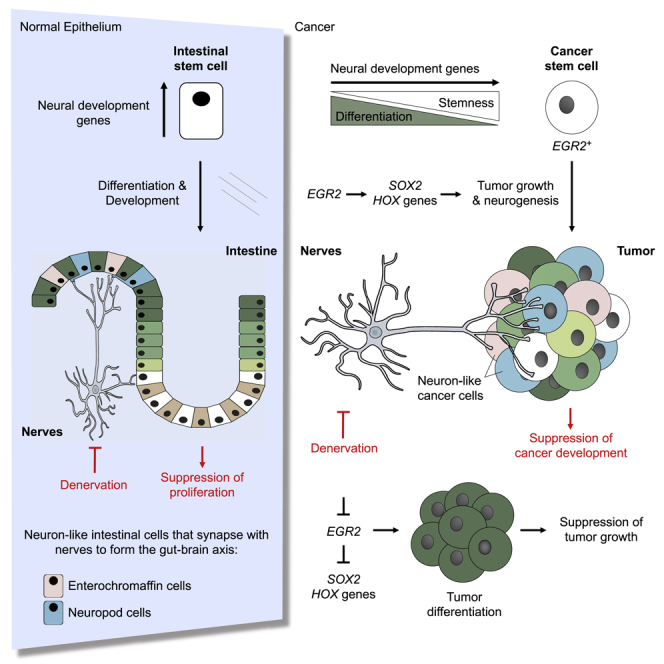
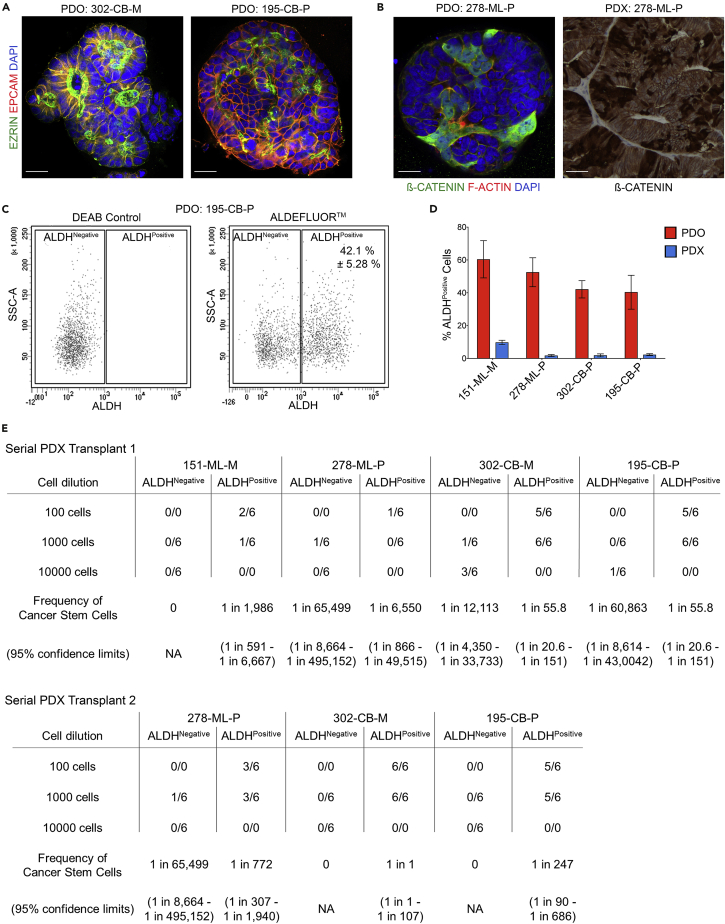
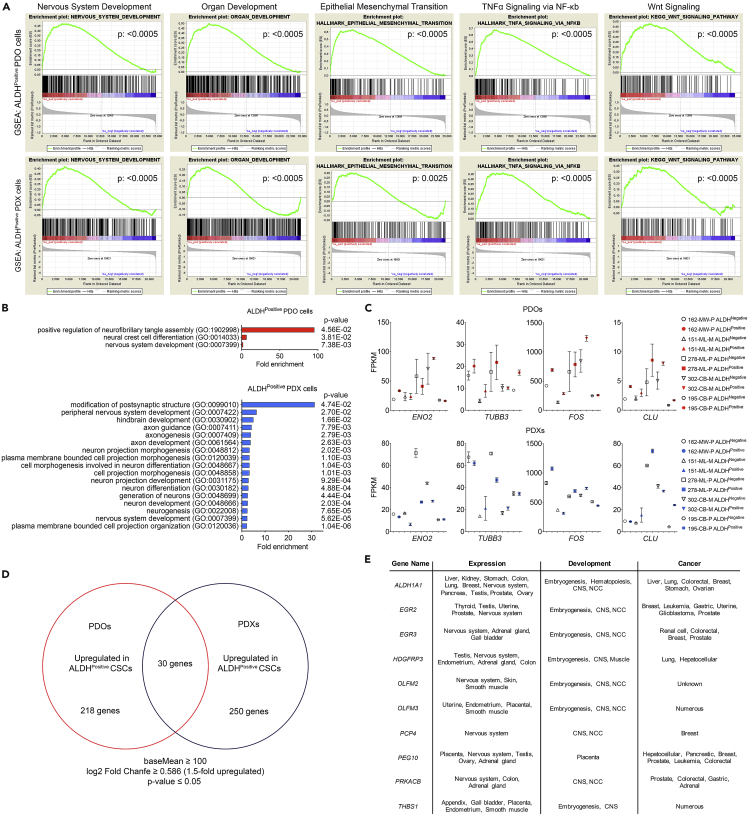
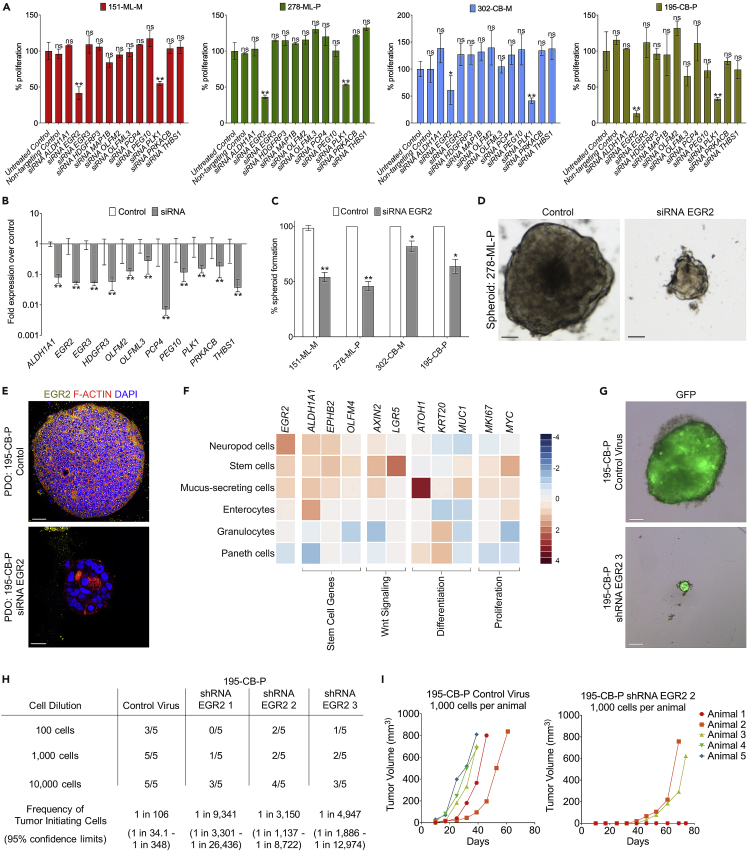
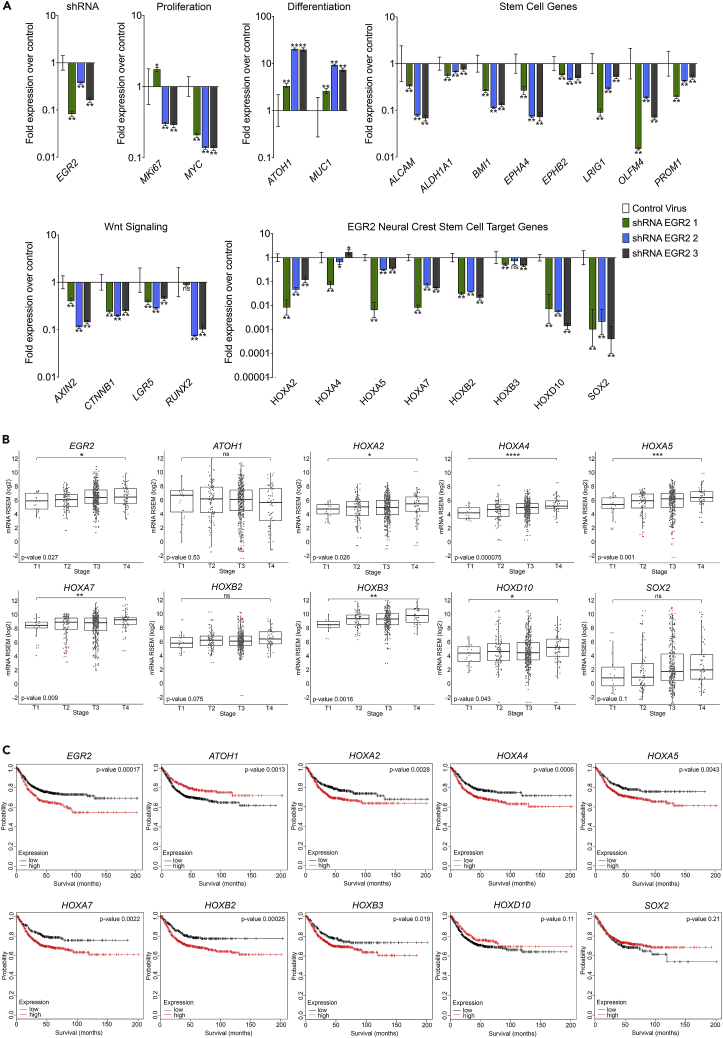
Recent evidence demonstrates that colon cancer stem cells (CSCs) can generate neurons that synapse with tumor innervating fibers required for tumorigenesis and disease progression. Greater understanding of the mechanisms that regulate CSC driven tumor neurogenesis may therefore lead to more effective treatments. RNA-sequencing analyses of ALDHPositive CSCs from colon cancer patient-derived organoids (PDOs) and xenografts (PDXs) showed CSCs to be enriched for neural development genes. Functional analyses of genes differentially expressed in CSCs from PDO and PDX models demonstrated the neural crest stem cell (NCSC) regulator EGR2 to be required for tumor growth and to control expression of homebox superfamily embryonic master transcriptional regulator HOX genes and the neural stem cell and master cell fate regulator SOX2. These data support CSCs as the source of tumor neurogenesis and suggest that targeting EGR2 may provide a therapeutic differentiation strategy to eliminate CSCs and block nervous system driven disease progression.

Keywords: Cancer; Stem cells research; Transcriptomics.


Conflict of interest statement

A.S., T.J., D.M., and. D.H. are employees of Bayer AG. R.L., J.T., and M.L. are employees of Nuvisan ICB GmbH. C.R.A.R. is the founder of CELLphenomics GmbH.

Figures

None
Graphical abstract
Figure 1
Figure 1
Colon cancer PDOs are heterogeneous and enriched for self-renewing ALDHPositive CSCs (A) Immunofluorescence staining of colon cancer PDOs for EZRIN (green) and EPCAM (red). Nuclei are stained blue with DAPI (Bars = 20 μm). (B) Immunofluorescence staining of a PDO for β-CATENIN (green) and F-ACTIN (red) (left hand side) and immunostaining of a PDX for β -CATENIN (right hand side) (Bars = 20 μm). (C) Representative Aldefluor Assay FACS plots of cells derived from PDO model 195-CB-P (data from 10 independent experiments). DEAB (diethylaminobenzaldehyde) is a specific inhibitor of ALDH and is used to control background fluorescence. (D) Frequency (±SD) of ALDHPositive cells in PDOs and corresponding PDX models (data from 10 independent experiments). (E) Tables show results of two rounds of limiting dilution serial xenotransplantation of ALDHPositive and ALDHNegative cells from previously established PDO derived xenograft models. The number of successfully established tumors as a fraction of the number of animals transplanted is given. p values for pairwise tests of differences in CSC frequencies between ALDHPositive versus ALDHNegative cells in 151-ML-M, 278-ML-P, 302-CB-M, and 195-CB-P in serial transplant round one tumors are 1.12 × 10−4, 1.37 × 10−1, 8.39 × 10−14, and 2.92 × 10−17, respectively, and in 278-ML-P, 302-CB-M, and 195-CB-P serial transplant round two tumors are 3.82 × 10−7, 3.67 × 10−22 and 3.78 × 10−15, respectively. (See also Table S1).
Figure 2
Figure 2
ALDHPositive CSCs are enriched for nervous system development gene sets and neural crest stem cell genes (A) Gene set enrichment analysis for nervous system development (nominal p values <0.0005), organ development (nominal p values <0.0005), epithelial to mesenchymal transition (nominal p values <0.0005 and 0.0025), TNFα signaling via NFkB (nominal p values <0.0005), and Wnt signaling (nominal p values <0.0005) in ALDHPositive cells (compared to ALDHNegative cells) from PDO models (top panels) and PDX models (bottom panels) (See also Table S2). (B) Gene ontology analysis of ALDHPositive cells from PDOs (red bars) and PDX models (blue bars) reveals CSCs are enriched for neural crest and nervous system development terms (See also Figure S1). (C) RNA sequencing generated FPKM values for nerve cell markers ENO2, TUBB3, FOS and the neuroendocrine cell marker CLU in ALDHPositive CSCs and ALDHNegative cells from PDO models (top panels) and PDX models (bottom panels). (D) Venn diagram shows the number of RNA-sequencing generated transcripts upregulated in PDO ALDHPositive CSCs (218 genes) and PDX ALDHPositive CSCs (250 genes) and upregulated in both PDO ALDHPositive CSCs and PDX ALDHPositive CSCs (30 genes) (n = 4 separate cell preparations, basemean greater than or equal to 100, log2 fold change = 1.5-fold upregulated, p value <0.05). (E) Table shows 10 genes upregulated in both PDO ALDHPositive CSCs and PDX ALDHPositive CSCs selected for functional analysis by RNAi (relevant literature is cited in brackets below gene names). (See also Figures S1, S2, and S3).
Figure 3
Figure 3
EGR2 is required for CSC survival and tumorigenicity (A) Proliferation of siRNA transfected patient-derived colon cancer cells in nonadherent cell culture compared to untreated control cells (mean ± SD; data from three independent experiments). ∗p value < 0.05; ∗∗p value < 0.01 (t-test). (B) Fold expression of ALDH1A1, EGR2, EGR3, HDGFRP3, OLFML2, OLFML3, PCP4, PEG10, PLK1, PRKACB, and THBS1 RT-PCR gene expression data (±95% confidence intervals) in siRNA transfected 278-ML-P cells (n = 3 independent cell preparations) compared to untreated control cells. Nontargeting siRNA and siRNA PLK1 were used as negative and positive controls, respectively (see also Figure S4, Tables S3 and S5). (C) Frequency of siRNA EGR2 spheroid formation in nonadherent cell culture compared to control transfected cells (mean ± SD; data from three independent experiments). ns = not significant; ∗p value < 0.05; ∗∗p value < 0.01 (t-test). (D) Representative images of a 278-ML-P control spheroid (LHS) and a siRNA EGR2 spheroid (RHS) in nonadherent cell culture (scale bars = 100 μm). (E) Immunofluorescence staining of control (top panel) and siRNA EGR2 (lower panel) PDOs for EGR2 (yellow) and F-ACTIN (red) in Matrigel culture. Nuclei are stained blue with DAPI (scale bars, 20 μm). (F) Heatmap showing scRNA-seq generated log(nTPM) z-scores for EGR2, stem cell genes (ALDH1A1, EPHB2, OLFM2), Wnt signaling genes (AXIN2, LGR5), differentiation (ATOH1, KRT20, MUC1), and proliferation genes (MKI67, MYC) in neuropod cells, stem cells, mucus-secreting cells, enterocytes, granulocytes, and Paneth cells from healthy human colon tissue. Results based on Single Cell Type information from the Human Protein Atlas (Karlsson et al., 2021) (https://www.proteinatlas.org/ENSG00000122877-EGR2/single+cell+type/colon). (G) Representative images of control virus (top panel) and shRNA EGR2 (lower panel) transduced 195-CB-P cells in non-adherent cell culture (scale bars, 100 μm). (H) Table shows results of limiting dilution transplantation of control virus transduced and shRNA EGR2 transduced 195-CB-P cells. The number of established tumors as a fraction of the number of animals transplanted is given. P values for pairwise tests of differences in CSC frequencies between control virus versus shRNA EGR2 1, shRNA EGR2 two, and shRNA EGR2 3 195-CB-P cells are 6.9 × 10−9, 4.9 × 10−6, and 6.92 × 10−8, respectively. (I) Growth curves for xenografts derived from control virus transduced cells and shRNA EGR2 transduced cells. (See also Table S4).
Figure 4
Figure 4
EGR2 regulates CSC differentiation and expression of NCSC HOX genes and SOX2 and, along with HOXA2, HOXA4, HOXA5, HOXA7, HOXB2, and HOXB3, is an indicator of poor prognosis in clinical samples (A) Fold expression of EGR2, proliferation, differentiation, stem cell genes, Wnt signaling, and EGR2 NCSC target genes RT-PCR gene expression data (±95% confidence intervals) in three separate 195-CB-P shRNA EGR2 tumors over the comparator population (three control virus transduced 195-CB-P xenografts). Significant differences are ns: not significant, ∗p < 0.05, and ∗∗p < 0.01 and were determined by inspection of error bars as described by Cumming et al. (2007) (Cumming et al., 2007) (See also Table S5). (B) Expression of EGR2, ATOH1, HOXA2, HOXA4, HOXA5, HOXA7, HOXB2, HOXB3, HOXD10, and SOX2 in colorectal cancer patients across different tumor stages (T1 v T4, p values 0.027, 0.53, 0.026, 0.000075, 0.001, 0.009, 0.075, 0.0016, 0.043, and 0.1, respectively). Of these, HOXA4, HOXA5, HOXA7, and HOXB3 are significant at FDR <5%. RNA-seq and clinical data of 533 patients (n = 378 colon adenocarcinoma, n = 155 rectal adenocarcinoma) was extracted from cBioPortal. The upper whisker extends from the hinge to the highest value that is within 1.5 ∗ interquartile range (IQR) of the hinge. The lower whisker extends from the hinge to the lowest value within 1.5 ∗ IQR of the hinge. Data beyond the end of the whiskers are outliers and plotted as red points (as specified by Tukey). (C) Kaplan-Meier survival curves for EGR2, ATOH1, HOXA2, HOXA4, HOXA5, HOXA7, HOXB2, HOXB3, HOXD10, and SOX2 in colorectal cancer patients comparing lower third percentile to upper third percentile (log rank p values = 0.00017, 0.0013, 0.0028, 0.0006, 0.0043, 0.0022, 0.00025, 0.019, 0.11, and 0.21, respectively). Of these, higher EGR2, HOXA2, HOXA4, HOXA5, and HOXA7 are significant at FDR <5%. Results based upon data generated by the Kaplan-Meier Plotter (www.kmplot.com/analysis) (Nagy et al., 2018).

Similar articles

Cited by

References

    1. Adameyko I., Lallemend F., Aquino J.B., Pereira J.A., Topilko P., Müller T., Fritz N., Beljajeva A., Mochii M., Liste I., et al. Schwann cell precursors from nerve innervation are a cellular origin of melanocytes in skin. Cell. 2009;139:366–379. doi: 10.1016/j.cell.2009.07.049. - DOI - PubMed
    1. Adams J.C., Tucker R.P. The thrombospondin type 1 repeat (TSR) superfamily: diverse proteins with related roles in neuronal development. Dev. Dyn. 2000;218:280–299. - PubMed
    1. Akamatsu S., Wyatt A.W., Lin D., Lysakowski S., Zhang F., Kim S., Tse C., Wang K., Mo F., Haegert A., et al. The placental gene PEG10 promotes progression of neuroendocrine prostate cancer. Cell Rep. 2015;12:922–936. doi: 10.1016/j.celrep.2015.07.012. - DOI - PubMed
    1. Albo D., Akay C.L., Marshall C.L., Wilks J.A., Verstovsek G., Liu H., Agarwal N., Berger D.H., Ayala G.E. Neurogenesis in colorectal cancer is a marker of aggressive tumor behavior and poor outcomes. Cancer. 2011;117:4834–4845. doi: 10.1002/cncr.26117. - DOI - PubMed
    1. Amit M., Takahashi H., Dragomir M.P., Lindemann A., Gleber-Netto F.O., Pickering C.R., Anfossi S., Osman A.A., Cai Y., Wang R., et al. Loss of p53 drives neuron reprogramming in head and neck cancer. Nature. 2020;578:449–454. doi: 10.1038/s41586-020-1996-3. - DOI - PMC - PubMed

LinkOut - more resources