. 2022 Jun 3:13:873382.
doi: 10.3389/fimmu.2022.873382. eCollection 2022.

Adiponectin Ameliorates GMH-Induced Brain Injury by Regulating Microglia M1/M2 Polarization Via AdipoR1/APPL1/AMPK/PPARγ Signaling Pathway in Neonatal Rats

Affiliations

Adiponectin Ameliorates GMH-Induced Brain Injury by Regulating Microglia M1/M2 Polarization Via AdipoR1/APPL1/AMPK/PPARγ Signaling Pathway in Neonatal Rats

Ningbo Xu et al. Front Immunol. .

Abstract

Adiponectin (APN), a fat-derived plasma hormone, is a classic anti-inflammatory agent. Multiple studies have demonstrated the beneficial role of APN in acute brain injury, but the effect of APN in germinal matrix hemorrhage (GMH) is unclear, and the underlying molecular mechanisms remain largely undefined. In the current study, we used a GMH rat model with rh-APN treatment, and we observed that APN demonstrated a protective effect on neurological function and an inhibitory effect on neuroinflammation after GMH. To further explore the underlying mechanisms of these effects, we found that the expression of Adiponectin receptor 1 (AdipoR1) primarily colocalized with microglia and neurons in the brain. Moreover, AdiopR1, but not AdipoR2, was largely increased in GMH rats. Meanwhile, further investigation showed that APN treatment promoted AdipoR1/APPL1-mediated AMPK phosphorylation, further increased peroxisome proliferator-activated receptor gamma (PPARγ) expression, and induced microglial M2 polarization to reduce the neuroinflammation and enhance hematoma resolution in GMH rats. Importantly, either knockdown of AdipoR1, APPL1, or LKB1, or specific inhibition of AMPK/PPARγ signaling in microglia abrogated the protective effect of APN after GMH in rats. In all, we propose that APN works as a potential therapeutic agent to ameliorate the inflammatory response following GMH by enhancing the M2 polarization of microglia via AdipoR1/APPL1/AMPK/PPARγ signaling pathway, ultimately attenuating inflammatory brain injury induced by hemorrhage.

Keywords: GMH; adiponectin; hematoma resolution; microglial polarization; neuroinflammation.


Conflict of interest statement

The authors declare that the research was conducted in the absence of any commercial or financial relationships that could be construed as a potential conflict of interest.

Figures

Figure 1
Figure 1
Endogenous Adiponectin and AdipoR1 were upregulated in the brain after GMH. (A–C) Western blot data revealed that the endogenous Adiponectin (A, B) and AdipoR1 (A, C) expression levels significantly increased from 12 h to 3 d and peaked at 3 d post-GMH. (A, D) AdipoR2 expression levels were comparable among pups with or without GMH at four time points. Values are expressed as normalized to Actin protein expression. Values are expressed as mean ± SD. ANOVA, Dunnett. *P < 0.05 compared to sham, n = 6 for each group. (E, F) Representative images of immunofluorescence staining showing the co-localization of Adiponectin and AdipoR1 (red) with microglia and neurons (Iba1, NeuN, green) in the pups with or without GMH. Adiponectin and AdipoR1 immunoreactivities were greater on microglia and neurons in the periventricular area at 72 h after GMH. Arrows indicated Adiponectin or AdipoR1 colocalized with microglia. Scale bar = 50µm. n = 3 for each group.
Figure 2
Figure 2
Intranasal administration of Adiponectin improved short-term neurological function at 72 h post-GMH. (A) Righting reflex and (B) Geotaxis reflex tests revealed that the medium dosage (0.1mg/kg) of rh-APN significantly improved neurological function when compared with the vehicle-treated pups at 1, 2, and 3 d post-GMH. Values are expressed as mean ± SD. ANOVA, Dunnett. n = 6-9 for each group. *P < 0.05 compared to sham, #P < 0.05 compared to GMH + Vehicle, @P < 0.05 compared to GMH + rh-APN (0.05mg/kg), &P < 0.05 compared to GMH + rh-APN (0.1mg/kg). (C) Western blot data showed that intranasal administration of rh-APN after GMH could be delivered successfully into brain tissue, and it reduced proinflammatory cytokine levels of IL-1β and IL-6 while increasing expression levels of anti-inflammatory cytokine, IL-10, within the brain. ANOVA, Dunnett. n = 6 for each group. *P < 0.05 compared to sham, #P < 0.05 compared to GMH + Vehicle. (D) Immunofluorescence staining assay showed IL-6 immunoreactivity in the choroid plexus was dramatically increased in pups that were subjected to GMH when compared with sham, and rh-APN treatment significantly reduced the IL-6 immunoreactivity compared to GMH.
Figure 3
Figure 3
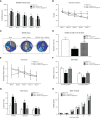
rh-APN administration improved long-term memory and motor function at 21 to 28 days after GMH. Water maze test (A–E) showed that rh-APN treatment significantly improved spatial learning and memory performance with reduced swim distance to find the platform (A), less time to escape (B), and more time spent in the probe quadrant (C, D). However, no significant difference in swim velocity was found among the three groups (E). rh-APN treatment notably improved motor function of pups assessed by rotarod (F) and foot fault (G) tests after GMH. (H) Histograms showing the weight changes of pups with or without rh-APN treatment in 4 weeks post-GMH. Values are expressed as mean ± SD. ANOVA, Dunnett. n = 8 for each group. *P < 0.05 compared to sham, #P < 0.05 compared to GMH + Vehicle.
Figure 4
Figure 4
rh-APN treatment promoted M2 microglia polarization at 72 h post GMH. (A) Representative images of immunofluorescence staining and quantification (B, C) depicting co-localization of CD68 (M1 marker, red) or CD206 (M2 marker, red) and Iba-1 (green). Scale bar = 50μm. (D) Representative image of Western blot data showing the expression of CD68, CD206, PPARγ, and CD36. (E-H) Western blot quantification showed that the expression of CD68 was markedly increased and CD206, PPARγ, and CD36 expression were slightly increased compared to sham after GMH. (D–H) rh-APN significantly decreased CD68 expression, while increased the expression of CD206, PPARγ, and CD36. (D–H) However, these effects were reversed by knockdown of AdipoR1 with AdipoR1 siRNA. Values are expressed as mean ± SD. ANOVA, Dunnett. n = 6 for each group. *P < 0.05 compared to sham, #P < 0.05 compared to GMH + Vehicle, @P < 0.05 compared to GMH + rh-APN or GMH + rh-APN + Scramble siRNA.
Figure 5
Figure 5
rh-APN promoted M2 microglia accumulation in the periventricular region at 72 h after GMH. (A, C) Representative images of immunofluorescence staining and quantification (B, D) depicted accumulation and proliferation (Ki67+/Brdu+, red) of microglia (Iba+, green) in the periventricular region. (E, F) Representative images of immunofluorescence staining and quantification showing activated microglia/macrophages (CD11b/c+, green) in the periventricular region. Scale bar = 50μm. Dots in (A-G) represent data from individual pups. FOV=2.3 × 106 μm3. Values are expressed as mean ± SD. ANOVA, Dunnett. n = 6 for each group. *P < 0.05 compared to sham, #P < 0.05 compared to GMH + Vehicle. (G) Representative images of immunofluorescence staining showing co-localization of AdipoR1 (red) and M2 microglia (CD206+, green) in the periventricular regions after GMH. Scale bar = 50μm. n = 3 for each group. Arrows indicate AdipoR1 colocalized with M2 microglia. (H) qRT-PCR assay showed that rh-APN significantly increased the mRNA expression of Arginase-1 at 72 h post-GMH. Values are expressed as mean ± SD. ANOVA, Dunnett. n = 6 for each group. *P < 0.05 compared to sham, #P < 0.05 compared to GMH + Vehicle.
Figure 6
Figure 6
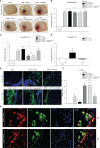
rh-APN promoted hematoma clearance by increasing M2 microglia in the periventricular area after GMH. (A) Representative images of hematoma in the periventricular area of brain at 72 h after GMH. (B–D) Hemoglobin assays were conducted at (B) 24 h, (C) 72 h, and (D) 7 d. (E) Representative images of immunofluorescence staining and (F) quantification showing the accumulation of M2 microglia in the periventricular regions after GMH. Scale bar = 50μm. n = 6 for each group. Values are expressed as mean ± SD. ANOVA, Dunnett. n = 6 for each group. *P < 0.05 compared to sham, #P < 0.05 compared to GMH + Vehicle, @P < 0.05 compared to GMH + si-AdipoR1, &P < 0.05 compared to GMH + rh-APN or GMH + rh-APN + Scramble siRNA. (G) Representative images of immunofluorescence staining showing co-localization of CD206 with hemoglobin in periventricular area after GMH with rh-APN treatment. Scale bar = 50μm, Upper panel; Scale bar = 50μm, lower panel.
Figure 7
Figure 7
AdipoR1/APPL1/LKB1/AMPK signaling is a potential pathway for rh-APN afforded anti-inflammation in GMH pups. (A) Representative images of Western blot data showing the expression of AdipoR1, APPL1, LKB1, p-AMPK, PPARγ, CD36, CD68, CD206, IL-1β, and IL-10 either with rh-APN treatment alone, rh-APN + si-AdipoR1, rh-APN + si-APPL1, or rh-APN + si-LKB1. (B) Western blot analysis of AdipoR1 showed that AdipoR1 levels increased in rh-APN treatment group and decreased in the si-AdipoR1 group, while AdipoR1 expression does not change in si-APPL1 or si-LKB1 pups with rh-APN treatment. (C) Western blot analysis of APPL1 showed that APPL1 expression was increased in the rh-APN-treated group and decreased in si-AdipoR1 and si-APPL1 groups. However, there were no significant changes of APPL1 levels after knockdown of LKB1 with si-LKB1. (D) Western blot analysis of LKB1 showed that LKB1 levels decreased in si-LKB1 treated group. (E) Western blot analysis of p-AMPK to AMPK ratio showed that p-AMPK increased in the rh-APN-treated group and decreased in si-AdipoR1, si-APPL1, and si-LKB1 groups. (F, G, I, K) Western blot data showed that (F) PPARγ, (G) CD36, (I) CD206, and (K) IL-10 expression increased in rh-APN treated group and decreased in si-AdipoR1, si-APPL1, and si-LKB1 groups. (H, J) Western blot data showed that (H) CD68 and (J) IL-1β expression were significantly decreased with rh-APN treatment while si-AdipoR1, si-APPL1, and si-LKB1 reversed the inhibitory effects of rh-APN. Values are expressed as mean ± SD. ANOVA, Dunnett. n = 6 for each group. *P < 0.05 compared to sham, #P < 0.05 compared to GMH + Vehicle, @P < 0.05 compared to GMH + rh-APN or GMH + rh-APN + Scramble siRNA.
Figure 8
Figure 8
Selective inhibition of AMPK/PPARγ signaling in activated microglia cells abolished the effect of rh-APN on inhibiting neuroinflammation and promoting hematoma resolution 72 hours after GMH (A) Representative images of immunofluorescence staining showing fluorescent dye-labeled liposomes (A, green) were swallowed almost entirely in microglia D, E (Iba1+, red) rather than in Neurons (B) (NeuN+, red) and Astrocytes (C) (GFAP+, red) at 72 h after GMH. (B) Representative images of Western blot data showing the expression of p-AMPK, PPARγ and CD36, as well as CD68 and CD206 either with rh-APN treatment alone, rh-APN + Lipo-Dorsomorphin or rh-APN + Lipo-GW9662. (C) No changes observed in the expression of AdipoR1 with Lipo-Dorsomorphin and Lipo-GW9662 intervention. (D) Western blot analysis of p-AMPK to AMPK ratio showed p-AMPK increased in the rh-APN treatment group and decreased in Lipo-Dorsomorphin group. (E, F, H) Western blot data showed (E) PPARγ, (F) CD36 and (H) CD206 expression increased with rh-APN treatment but decreased in Lipo-Dorsomorphin and Lipo-GW9662 groups. (G) Western blot data showed that rh-APN significantly decreased CD68 expression, whereas Lipo-Dorsomorphin and Lipo-GW9662 reversed the inhibitory effect of rh-APN. (All samples of GMH + rh-APN in Western blot were from the same animals which were euthanized after short-term neurobehavioral tests). Values are expressed as mean ± SD. ANOVA, Dunnett. n = 6 for each group. *P < 0.05 compared to sham, #P < 0.05 compared to GMH + Vehicle, @P < 0.05 compared to GMH + rh-APN or GMH + rh-APN + Lipo-PBS.
Figure 9
Figure 9
Adiponectin regulates microglia polarization and exerts neuroprotective effects via AdipoR1/APPL1/AMPK/PPARγ signaling pathway.

References

    1. Tang J, Tao Y, Jiang B, Chen Q, Hua F, Zhang J, et al. . Pharmacological Preventions of Brain Injury Following Experimental Germinal Matrix Hemorrhage: An Up-to-Date Review. Transl Stroke Res (2016) 7(1):20–32. doi: 10.1007/s12975-015-0432-8 - DOI - PubMed
    1. Klebe D, McBride D, Krafft PR, Flores JJ, Tang J, Zhang JH. Posthemorrhagic Hydrocephalus Development After Germinal Matrix Hemorrhage: Established Mechanisms and Proposed Pathways. J Neurosci Res (2020) 98(1):105–20. doi: 10.1002/jnr.24394 - DOI - PMC - PubMed
    1. da Silva LS, Ribeiro GE, Montovani JC, Silva D. The Effect of Peri-Intraventricular Hemorrhage on the Auditory Pathway of Infants. Int J Pediatr Otorhinolaryngol (2018) 112:24–6. doi: 10.1016/j.ijporl.2018.06.026 - DOI - PubMed
    1. Leviton A, Kuban KC, Pagano M, Allred EN, Van Marter L. Antenatal Corticosteroids Appear to Reduce the Risk of Postnatal Germinal Matrix Hemorrhage in Intubated Low Birth Weight Newborns. Pediatrics (1993) 91(6):1083–8. doi: 10.1542/peds.91.6.1083 - DOI - PubMed
    1. Flores JJ, Klebe D, Tang J, Zhang JH. A Comprehensive Review of Therapeutic Targets That Induce Microglia/Macrophage-Mediated Hematoma Resolution After Germinal Matrix Hemorrhage. J Neurosci Res (2020) 98(1):121–8. doi: 10.1002/jnr.24388 - DOI - PubMed

Publication types

MeSH terms