

In the Acute Phase of Trypanosoma cruzi Infection, Liver Lymphoid and Myeloid Cells Display an Ambiguous Phenotype Combining Pro- and Anti-Inflammatory Markers
- PMID: 35720410
- PMCID: PMC9204308
- DOI: 10.3389/fimmu.2022.868574
In the Acute Phase of Trypanosoma cruzi Infection, Liver Lymphoid and Myeloid Cells Display an Ambiguous Phenotype Combining Pro- and Anti-Inflammatory Markers
Abstract
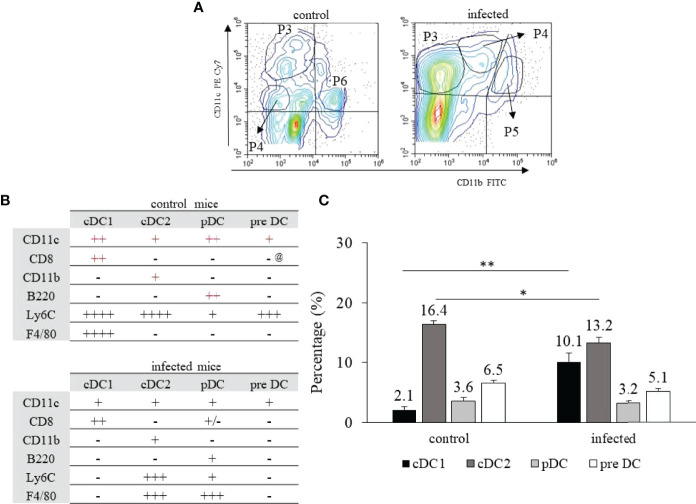
Multiple cell populations, cellular biochemical pathways, and the autonomic nervous system contribute to maintaining the immunological tolerance in the liver. This tolerance is coherent because the organ is exposed to high levels of bacterial pathogen-associated molecular pattern (PAMP) molecules from the intestinal microbiota, such as lipopolysaccharide endotoxin (LPS). In the case of Trypanosoma cruzi infection, although there is a dramatic acute immune response in the liver, we observed intrahepatic cell populations combining pro- and anti-inflammatory markers. There was loss of fully mature Kupffer cells and an increase in other myeloid cells, which are likely to include monocytes. Among dendritic cells (DCs), the cDC1 population expanded relative to the others, and these cells lost both some macrophage markers (F4/80) and immunosuppressive cytokines (IL-10, TGF-β1). In parallel, a massive T cell response occured with loss of naïve cells and increase in several post-activation subsets. However, these activated T cells expressed both markers programmed cell death protein (PD-1) and cytokines consistent with immunosuppressive function (IL-10, TGF-β1). NK and NK-T cells broadly followed the pattern of T cell activation, while TCR-γδ cells appeared to be bystanders. While no data were obtained concerning IL-2, several cell populations also synthesized IFN-γ and TNF-α, which has been linked to host defense but also to tissue injury. It therefore appears that T. cruzi exerts control over liver immunity, causing T cell activation via cDC1 but subverting multiple populations of T cells into immunosuppressive pathways. In this way, T. cruzi engages a mechanism of hepatic T cell tolerance that is familiar from liver allograft tolerance, in which activation and proliferation are followed by T cell inactivation.
Keywords: Trypanosoma cruzi infection; hepatic immune response; immunological tolerance; inflammation; liver.
Copyright © 2022 de Lima Pereira dos Santos, Vacani-Martins, Cascabulho, Pereira, Crispe and Henriques-Pons.
Conflict of interest statement
The authors declare that the research was conducted in the absence of any commercial or financial relationships that could be construed as a potential conflict of interest.
Figures


Similar articles
-
In the presence of Trypanosoma cruzi antigens, activated peripheral T lymphocytes retained in the liver induce a proinflammatory phenotypic and functional shift in intrahepatic T lymphocyte.J Leukoc Biol. 2020 Apr;107(4):695-706. doi: 10.1002/JLB.3A0220-399RR. Epub 2020 Mar 23. J Leukoc Biol. 2020. PMID: 32202341 Free PMC article.
-
Dogs infected with the blood trypomastigote form of Trypanosoma cruzi display an increase expression of cytokines and chemokines plus an intense cardiac parasitism during acute infection.Mol Immunol. 2014 Mar;58(1):92-7. doi: 10.1016/j.molimm.2013.11.007. Epub 2013 Dec 7. Mol Immunol. 2014. PMID: 24317279
-
Cooperation of liver cells in health and disease.Adv Anat Embryol Cell Biol. 2001;161:III-XIII, 1-151. doi: 10.1007/978-3-642-56553-3. Adv Anat Embryol Cell Biol. 2001. PMID: 11729749 Review.
-
IL-10 participates in the expansion and functional activation of CD8+ T cells during acute infection with Trypanosoma cruzi.J Leukoc Biol. 2019 Jan;105(1):163-175. doi: 10.1002/JLB.3A0318-111RR. Epub 2018 Oct 29. J Leukoc Biol. 2019. PMID: 30371945
-
[Role of cytokines in resistance and pathology in Trypanosoma cruzi infection].Rev Argent Microbiol. 1996 Apr-Jun;28(2):99-109. Rev Argent Microbiol. 1996. PMID: 8768488 Review. Spanish.
Cited by
-
CD39 expression by regulatory T cells participates in CD8+ T cell suppression during experimental Trypanosoma cruzi infection.PLoS Pathog. 2024 Apr 29;20(4):e1012191. doi: 10.1371/journal.ppat.1012191. eCollection 2024 Apr. PLoS Pathog. 2024. PMID: 38683845 Free PMC article.
-
Nitazoxanide: A Drug Repositioning Compound with Potential Use in Chagas Disease in a Murine Model.Pharmaceuticals (Basel). 2023 Jun 1;16(6):826. doi: 10.3390/ph16060826. Pharmaceuticals (Basel). 2023. PMID: 37375773 Free PMC article.
-
Efficacy of benznidazole delivery during Chagas disease nanotherapy is dependent on the nanocarrier morphology.Biomaterials. 2025 Nov;322:123358. doi: 10.1016/j.biomaterials.2025.123358. Epub 2025 Apr 22. Biomaterials. 2025. PMID: 40318604
References
-
- Sardinha LR, Mosca T, Elias RM, do Nascimento RS, Gonçalves LA, Bucci DZ, et al. . The Liver Plays a Major Role in Clearance and Destruction of Blood Trypomastigotes in Trypanosoma Cruzi Chronically Infected Mice. PloS neglected Trop Dis (2010) 4(1):e578. doi: 10.1371/journal.pntd.0000578 - DOI - PMC - PubMed
-
- Onofrio LI, Arocena AR, Paroli AF, Cabalén ME, Andrada MC, Cano RC, et al. . Trypanosoma Cruzi Infection Is a Potent Risk Factor for non-Alcoholic Steatohepatitis Enhancing Local and Systemic Inflammation Associated With Strong Oxidative Stress and Metabolic Disorders. PloS neglected Trop Dis (2015) 9(2):e0003464. doi: 10.1371/journal.pntd.0003464 - DOI - PMC - PubMed
Publication types
MeSH terms
Substances
LinkOut - more resources
Full Text Sources
Medical