

Seed Moisture Isotherms, Sorption Models, and Longevity
- PMID: 35720538
- PMCID: PMC9201756
- DOI: 10.3389/fpls.2022.891913
Seed Moisture Isotherms, Sorption Models, and Longevity
Abstract
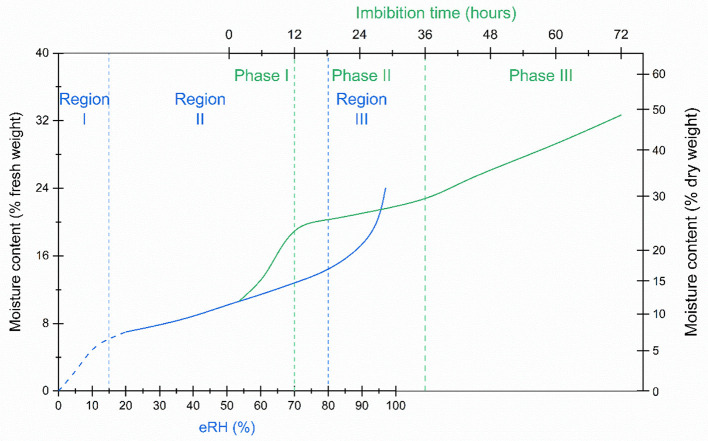
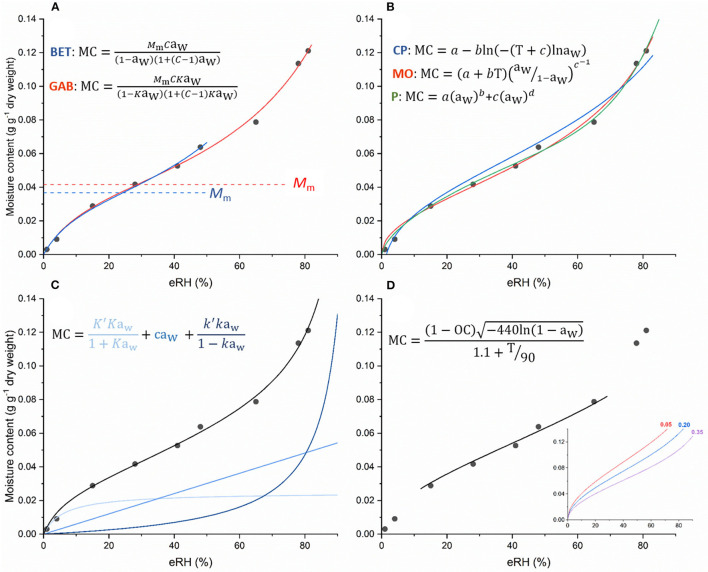
Seed moisture sorption isotherms show the equilibrium relationship between water content and equilibrium relative humidity (eRH) when seeds are either losing water from a hydrated state (desorption isotherm) or gaining water from a dry state (adsorption isotherm). They have been used in food science to predict the stability of different products and to optimize drying and/or processing. Isotherms have also been applied to understand the physiological processes occurring in viable seeds and how sorption properties differ in relation to, for example, developmental maturity, degree of desiccation tolerance, or dormancy status. In this review, we describe how sorption isotherms can help us understand how the longevity of viable seeds depends upon how they are dried and the conditions under which they are stored. We describe different ways in which isotherms can be determined, how the data are modeled using various theoretical and non-theoretical equations, and how they can be interpreted in relation to storage stability.
Keywords: equilibrium relative humidity (eRH); isotherm; moisture content; seed longevity; storage stability.
Copyright © 2022 Hay, Rezaei and Buitink.
Conflict of interest statement
The authors declare that the research was conducted in the absence of any commercial or financial relationships that could be construed as a potential conflict of interest.
Figures
Similar articles
-
Increases in the longevity of desiccation-phase developing rice seeds: response to high-temperature drying depends on harvest moisture content.Ann Bot. 2015 Aug;116(2):247-59. doi: 10.1093/aob/mcv091. Epub 2015 Jul 1. Ann Bot. 2015. PMID: 26133688 Free PMC article.
-
Mutant alleles at the rugosus loci in pea affect seed moisture sorption isotherms and the relations between seed longevity and moisture content.J Exp Bot. 2003 Jan;54(381):445-50. doi: 10.1093/jxb/erg059. J Exp Bot. 2003. PMID: 12493872
-
Mathematical modeling of sorption isotherms and the thermodynamic properties of vacuum-dried and freeze-dried Barhi dates.Sci Rep. 2025 Jun 5;15(1):19781. doi: 10.1038/s41598-025-01935-x. Sci Rep. 2025. PMID: 40473686 Free PMC article.
-
Pollen and seed desiccation tolerance in relation to degree of developmental arrest, dispersal, and survival.J Exp Bot. 2011 Nov;62(15):5267-81. doi: 10.1093/jxb/err154. Epub 2011 Aug 9. J Exp Bot. 2011. PMID: 21831844 Review.
-
Late seed maturation: drying without dying.J Exp Bot. 2017 Feb 1;68(4):827-841. doi: 10.1093/jxb/erw363. J Exp Bot. 2017. PMID: 28391329 Review.
Cited by
-
Experimental rice seed aging under elevated oxygen pressure: Methodology and mechanism.Front Plant Sci. 2022 Dec 1;13:1050411. doi: 10.3389/fpls.2022.1050411. eCollection 2022. Front Plant Sci. 2022. PMID: 36531402 Free PMC article.
-
Modelling the quantitative effect of oxygen on the ageing of primed celery seeds.Plant J. 2025 Apr;122(1):e70066. doi: 10.1111/tpj.70066. Plant J. 2025. PMID: 40245388 Free PMC article.
-
Scalable, economical, and stable sequestration of agricultural fixed carbon.Proc Natl Acad Sci U S A. 2023 Apr 18;120(16):e2217695120. doi: 10.1073/pnas.2217695120. Epub 2023 Apr 11. Proc Natl Acad Sci U S A. 2023. PMID: 37040411 Free PMC article.
-
Orchid seeds are not always short lived in a conventional seed bank!Ann Bot. 2024 May 13;133(7):941-952. doi: 10.1093/aob/mcae021. Ann Bot. 2024. PMID: 38365444 Free PMC article.
-
Seed Longevity and Ageing: A Review on Physiological and Genetic Factors with an Emphasis on Hormonal Regulation.Plants (Basel). 2023 Dec 21;13(1):41. doi: 10.3390/plants13010041. Plants (Basel). 2023. PMID: 38202349 Free PMC article. Review.
References
-
- Al-Muhtaseb A. H., McMinn W. A. M., Magee T. R. A. (2002). Moisture sorption isotherm characteristics of food products: a review. Food Bioprod. Process. 80, 118–128. 10.1205/09603080252938753 - DOI
-
- Andrade E. T., Figueira V. G., Teixeira L. P., Taveira J. H. d.S., Borém F. M. (2017). Determination of the hygroscopic equilibrium and isosteric heat of aji chili pepper. Rev. Bras. Eng. Agr. Amb. 21, 865–871. 10.1590/1807-1929/agriambi.v21n12p865-871 - DOI
-
- Arslan-Tontul S. (2020). Moisture sorption isotherm, isosteric heat and adsorption surface area of whole chia seeds. LWT – Food Sci. Technol. 119, 108859. 10.1016/j.lwt.2019.108859 - DOI
-
- Ayranci E., Duman O. (2005). Moisture sorption isotherms of cowpea (Vigna unguiculata L. Walp) and its protein isolate at 10, 20 and 30°C. J. Food Eng. 70, 83–91. 10.1016/j.jfoodeng.2004.08.044 - DOI
-
- Bair N., Meyer S., Allen P. (2006). A hydrothermal after-ripening time model for seed dormancy loss in Bromus tectorum L. Seed Sci. Res. 16, 17–28. 10.1079/SSR2005237 - DOI
Publication types
LinkOut - more resources
Full Text Sources