. 2022 Apr 14;6(6):e10604.
doi: 10.1002/jbm4.10604. eCollection 2022 Jun.

Functional Properties of Two Distinct PTH1R Mutants Associated With Either Skeletal Defects or Pseudohypoparathyroidism

Affiliations

Functional Properties of Two Distinct PTH1R Mutants Associated With Either Skeletal Defects or Pseudohypoparathyroidism

Ignacio Portales-Castillo et al. JBMR Plus. .

Abstract

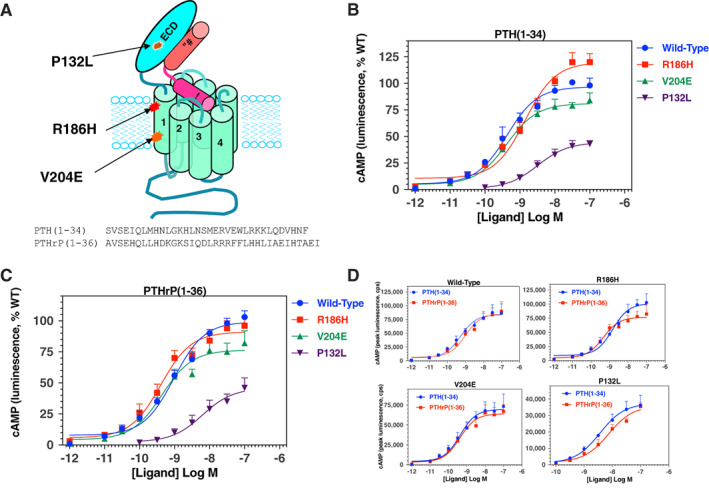
Consistent with a vital role of parathyroid hormone (PTH) receptor type 1 (PTH1R) in skeletal development, homozygous loss-of-function PTH1R mutations in humans results in neonatal lethality (Blomstrand chondrodysplasia), whereas such heterozygous mutations cause a primary failure of tooth eruption (PFE). Despite a key role of PTH1R in calcium and phosphate homeostasis, blood mineral ion levels are not altered in such cases of PFE. Recently, two nonlethal homozygous PTH1R mutations were identified in two unrelated families in which affected members exhibit either dental and skeletal abnormalities (PTH1R-V204E) or hypocalcemia and hyperphosphatemia (PTH1R-R186H). Arg186 and Val204 map to the first transmembrane helix of the PTH1R, and thus to a critical region of this class B G protein-coupled receptor. We used cell-based assays and PTH and PTH-related protein (PTHrP) ligand analogs to assess the impact of the R186H and V204E mutations on PTH1R function in vitro. In transiently transfected HEK293 cells, PTH1R-R186H mediated cyclic adenosine monophosphate (cAMP) responses to PTH(1-34) and PTHrP(1-36) that were of comparable potency to those observed on wild-type PTH1R (PTH1R-WT) (half maximal effective concentrations [EC50s] = 0.4nM to 1.2nM), whereas the response-maxima were significantly reduced for the PTH1R-V204E mutant (maximum effect [Emax] = 81%-77% of PTH1R-WT, p ≤ 0.004). Antibody binding to an extracellular hemagglutinin (HA) tag was comparable for PTH1R-R186H and PTH1R-WT, but was significantly reduced for PTH1R-V204E (maximum binding level [Bmax] = 44% ± 11% of PTH1R-WT, p = 0.002). The potency of cAMP signaling induced by a PTH(1-11) analog was reduced by ninefold and threefold, respectively, for PTH1R-R186H and PTH1R-V204E, relative to PTH1R-WT, and a PTH(1-15) radioligand analog that bound adequately to PTH1R-WT exhibited little or no specific binding to either mutant receptor. The data support a general decrease in PTH1R surface expression and/or function as a mechanism for PFE and a selective impairment in PTH ligand affinity as a potential PTH1R-mutation-based mechanism for pseudohypoparathyroidism. © 2022 The Authors. JBMR Plus published by Wiley Periodicals LLC on behalf of American Society for Bone and Mineral Research.

Keywords: HYPERPHOSPHATEMIA; HYPOCALCEMIA; PARATHYROID; PRIMARY FAILURE OF TOOTH ERUPTION; PSEUDOHYPOPARATHYROIDISM; PTH; PTH1R; PTHrP.


Conflict of interest statement

The authors have no conflicts of interest for the generation of this manuscript.

Figures

Fig. 1
Fig. 1
PTH1R mutations and impact on cAMP signaling responses to PTH(1‐34) and PTHrP(1‐36). (A) Schematic of the human PTH1R showing the location of the three disease‐causing mutations (P132L, R186H and V204E) and bound PTH(1‐34); amino acid sequences of PTH(1‐34) and PTHrP(1‐36) are shown below. (B) cAMP signaling responses to PTH(1‐34) in GS‐22a (HEK293/GloSensor) cells transiently transfected to express PTH1R‐WT, PTH1R‐R186H, or PTH1R‐V204E. Time‐dependent increases in cAMP‐dependent luminescence were measured in a PerkinElmer Envision plate reader following addition of PTH(1‐34), and the peak signal observed on each receptor and each ligand concentration, occurring ~10–20 minutes after ligand addition, was obtained and normalized to the maximum peak luminescence signal obtained with PTH(1‐34) on PTH1R‐WT (100%) and plotted versus ligand concentration. Cells without ligand are represented by the −12 Log M concentration. (C) Cells were treated as in B, but with varying concentrations of PTHrP(1‐36) and responses were normalized to the maximum response observed for that ligand on PTH1R‐WT. (D) The non‐normalized luminescence data, as counts per second (cps), from the experiments of B and C are replotted to compare the responses observed for PTH(1‐34) versus PTHrP(1‐36) on each receptor. The y axes of each graph are adjusted to best display the response at each receptor. Data are means (±SEM) of five experiments. Curves were fit to the data by nonlinear regression analysis; the corresponding potency, maximum and minimum values are reported in Table 1 and Supplementary Table S1.
Fig. 2
Fig. 2
Cell surface expression of WT and mutant PTH receptors. GS22a cells transiently transfected with PTH1R‐WT, PTH1R‐R186H, or PTH1R‐V204E, each with an extracellular HA tag, or pCDNA3.1 (control), were assessed for binding anti‐HA antibody (HA.11) conjugated to either horseradish peroxidase (HRP) for chemiluminescence detection, or to AlexaFluor488 for fluorescence detection by flow cytometry. (A) Chemiluminescence of HRP‐anti‐HA.11 antibody bound to confluent cells was measured in black 96‐well plates using an Envision plate reader. After antibody incubation (1 hour at 4°C) and HRP‐substrate addition, luminescence, as counts per second (cps), was measured at 2‐minute intervals for 12 minutes (inset) and the mean cumulative luminescence obtained for each receptor was corrected for the mean luminescence in pcDNA3.1‐transfected cells (black trace in inset) and normalized to the corresponding value obtained for PTHR‐WT (100%). The experiment was done at both a 1/1000 and a 1/5000 dilution of antibody, and similar relative changes in signal for the mutants versus the WT receptor were obtained at each dilution; data displayed are for the 1/1000 dilution. Results for the 1/5000 dilution, as the percentage of signal observed at PTH1R‐WT, were: 97 ± 22 for PTH1R‐R186H and 47 ± 16 for PTH1R‐V204E (p = 0.9 and p = 0.03, respectively, versus PTH1R‐WT). (B) Fluorescence of AlexaFluor488‐conjugated anti‐HA.11 antibody bound to single cells in suspension was assessed by Flow cytometry. For each transfected cell population, the single cell fluorescence is plotted versus the count of individual cells, detected as side‐scattered light (SSC‐A), and the percentage of HA‐Alexa‐fluorescence‐positive cells, contained within the gated area enclosed by the blue lines, was quantified (shown within each graph). Data are from a single experiment representative of three. (C) Summary of the expression studies depicted in A and B; values in bold font are background‐subtracted and normalized to the corresponding value obtained with PTH1R‐WT (100%, font), and those directly below in plain font are the total observed values of HRP‐chemiluminescence (cps × 10−5), Alexa488 fluorescence (relative counts × 10−3), and percentage of cells gated. The background values observed in cells transfected with pCDNA 3.1, were 71 ± 57 × 10−5 cps for HRP‐chemiluminescence, 6.9 ± 1.0 × 10−3 counts for Alexa488 fluorescence, and 5.4 ± 2.0% for gated cells. Values of p show Student's t test comparisons to PTH1R‐WT. Data are means ± SEM of three (AlexaFluor488) or four (HRP) experiments.
Fig. 3
Fig. 3
Fluorescent microscopy of receptor cell surface expression and PTH(1‐34)TMR binding. GS‐22a cells transiently transfected to express PTH1R‐WT, PTH1R‐R186H, or PTH1R‐V204E were treated on coverslips with AlexaFluor488‐conjugated anti‐HA.11 antibody for 60 minutes at 4°C, then with PTH(1‐34)TMR (30nM) for 30 minutes at 4°C, followed by a shift to room‐temperature for a final 30 minutes. The cells were then rinsed, fixed, stained with DAPI, and imaged using a fluorescence microscope (magnification = ×400). Transfected cells stain positively for both HA.11‐Alexa488 (green) and PTH(1‐34)TMR (red), which appear to co‐localize along the cell perimeter and to internalized vesicles for each receptor variant, with the signals qualitatively weaker for the PTH1R‐V204E mutant. The rightmost column shows 5× enlarged views of the boxed regions in the merged images. ImageJ analyses performed on selected cells in the fields shown are presented in Supplemental Table S3.
Fig. 4
Fig. 4
Recruitment of β‐arrestin and signaling via the Gq/PLC/IP3/iCa2+ pathway. (A) GBR‐24 (HEK293/GloSensor/βarrestin2YFP stable) cells( 30 ) were transiently transfected to express the WT or a mutant PTH1R and then treated on coverslips with PTH(1‐34)TMR (30nM) for 30 minutes at room temperature. The cells were then rinsed, fixed, stained with DAPI, and imaged using a fluorescence microscope (magnification = ×400). Areas enclosed in dashed boxes are shown digitally enlarged 7×. ImageJ‐derived colocalization plots of β‐arrestin2YFP and with PTH(1‐34)TMR in individual cells, with corresponding Pearson correlation coefficients (R), are shown in the rightmost columns. (B) Analysis of iCa2+ signaling was assessed in transiently transfected GS‐22a cells using the Ca‐sensitive fluorophore Fura2‐AM. After preloading the cells with Fura2‐AM, baseline ratiometric fluorescence (sequential excitation at 340 nm and 380; emission at 515 nm) was measured in a PerkinElmer Envision plate reader for 20 seconds prior to (baseline) and for 140 seconds after addition of PTH(1‐34) or PTHrP(1‐36) each at a concentration of 100nM. Shown are the means (±SEM) of data from five or four (PTHrP(1‐36) ligand) separate experiments.
Fig. 5
Fig. 5
cAMP signaling responses of WT and mutant PTH receptors to N‐terminal PTH fragment analogs. (A) Amino acid sequences of the PTH(1‐28), PTHrP(1‐28), and M‐PTH(1‐11) analog peptides used to assess cAMP signaling responses at the WT and mutant PTH1Rs (Z = aminocyclopetylcarboxyl, B = aib, H = homoarginine). (BD) cAMP responses to the peptide analogs were assessed in GS‐22a cells transiently transfected to express PTH1R‐WT, PTH1R‐R186H, or PTH1R‐V204E. (B) cAMP responses to varying concentrations of PTH(1‐28). (C) cAMP responses to varying concentrations of PTHrP(1‐28). (D) cAMP responses to varying concentrations of M‐PTH(1‐11). For each receptor and ligand concentration, the peak cAMP‐dependent luminescence response, occurring 10–20 minutes after ligand addition, was normalized to the maximum peak response observed for that ligand on PTH1R‐WT (100%) and is plotted versus ligand concentration. Data are means (±SEM) of four or three (M‐PTH(1‐11) analog) analog) experiments. Curves were fit to the data by nonlinear regression analysis; the corresponding potency and maximum luminescence values are reported in Table 2.
Fig. 6
Fig. 6
Ligand binding properties of WT and mutant PTH receptors. (A) Amino acid sequences of relevant peptides (nL = norleucine, hR = homoarginine, B = Aib). (B) Competition radioligand binding assays performed in intact GS22a cells transfected with the WT or the indicated mutant PTH receptors using 125I‐LA‐PTH* as tracer radioligand and unlabeled PTH(1‐34) as competitor. The total binding of radioligand as counts per minute (CPM) is plotted versus the concentration of competing ligand. For each receptor, the total binding observed at PTH(1‐34) concentrations of 1 × 10−8M and higher was significantly different (p < 0.05) from the total binding observed in the absence of unlabeled competitor. (C) Data from the experiment of B plotted with specific binding normalized to the maximum SB observed at each receptor (100%). (D) Competition radioligand binding assays performed in intact GS22a cells transfected with the WT or the indicated mutant PTH receptors using 125I‐M‐PTH(1‐15) as a tracer radioligand and varying concentrations of M‐PTH(1‐15) as competitor. Data are plotted as in B. Total binding was significantly different (p < 0.05) from total binding observed in the absence of unlabeled competitor only on PTHR1‐WT and at the highest concentration of unlabeled M‐PTH(1‐15). Data are means (±SEM) of four experiments, each performed in duplicate. pIC50 and maximum binding parameters obtained from curve fitting the data obtained with 125I‐LA‐PTH* are reported in Table 3.
Fig. 7
Fig. 7
Sites of disease‐associated missense mutations in the PTH1R and PTH or PTHrP ligands. The cryogenic electron microscopy (cryo‐EM) structure (Protein Data Bank [PDB] file 6nbf) of the PTH1R in complex with LA‐PTH is shown in cartoon format with the receptor scaffold shaded gray and the ligand shaded blue. Residues at which missense mutations have been identified in patients are shown with side‐chains in stick format and colored orange if mutations are associated with dental and/or skeletal abnormalities, including a primary failure of tooth eruption (PFE): P119L, P132L, Y145C, R147C, V197E, L232R, R233H, I381S, L292P, W298V, R383Q, H442D, Q451R, and G452E( 9 , 10 , 11 , 12 , 46 ); PFE with clinodactyly: V204E( 21 ); Blomstrand osteochondrodysplasia (BOC), P132L( 4 , 6 ); Eiken syndrome with PFE: E35K,( 18 ) Y134S,( 17 ) and brachydactyly type E with short stature and PFE: Leu8Pro and Leu24Pro in PTHrP( 47 ); residues are colored purple if the mutations are associated with alterations in calcium homeostasis resembling a pseudohypoparathyroidism (PHP) phenotype: R186H in the PTH1R, Arg25Cys( 44 ) and Ser1Pro in PTH,( 48 ) or residues are colored green if mutations are gain‐of‐function and associated with Jansen's metaphyseal chondrodysplasia: H223R, T410P/R, and I458R/K.( 49 ) Asterisks indicate residues at which mutations are homozygous (Pro132Leu is homozygous in BOC and heterozygous in PFE). Transmembrane helices 1, 3, 4, 6, and 7 are labeled at their extracellular ends by helix number. Receptor residues R186 and V204 located in TM helix 1 are sites of the homozygous mutations associated with defects in calcium homeostasis and dental/skeletal development, respectively, and studied here are boxed.

References

    1. Duchatelet S, Ostergaard E, Cortes D, Lemainque A, Julier C. Recessive mutations in PTHR1 cause contrasting skeletal dysplasias in Eiken and Blomstrand syndromes. Hum Mol Genet. 2005;14:1‐5. - PubMed
    1. Hoogendam J, Farih‐Sips H, Wynaendts LC, Lowik CW, Wit JM, Karperien M. Novel mutations in the parathyroid hormone (PTH)/PTH‐related peptide receptor type 1 causing Blomstrand osteochondrodysplasia types I and II. J Clin Endocrinol Metab. 2007;92:1088‐1095. - PubMed
    1. Jobert AS, Zhang P, Couvineau A, et al. Absence of functional receptors for parathyroid hormone and parathyroid hormone‐related peptide in Blomstrand chondrodysplasia. J Clin Invest. 1998;102:34‐40. - PMC - PubMed
    1. Karaplis AC, He B, Nguyen MT, et al. Inactivating mutation in the human parathyroid hormone receptor type 1 gene in Blomstrand chondrodysplasia. Endocrinology. 1998;139:5255‐5258. - PubMed
    1. Oostra RJ, van der Harten JJ, Rijnders WP, Scott RJ, Young MP, Trump D. Blomstrand osteochondrodysplasia: three novel cases and histological evidence for heterogeneity. Virchows Arch. 2000;436:28‐35. - PubMed