Review
. 2022 Jun 2:16:878869.
doi: 10.3389/fnins.2022.878869. eCollection 2022.

General Principles Underpinning Amyloid Structure

Affiliations
Review

General Principles Underpinning Amyloid Structure

Alexander I P Taylor et al. Front Neurosci. .

Abstract

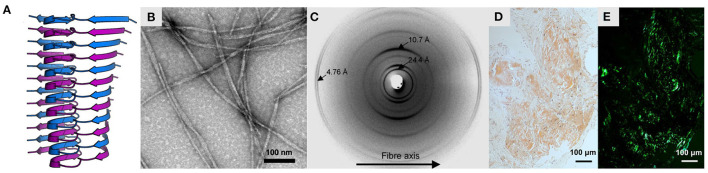
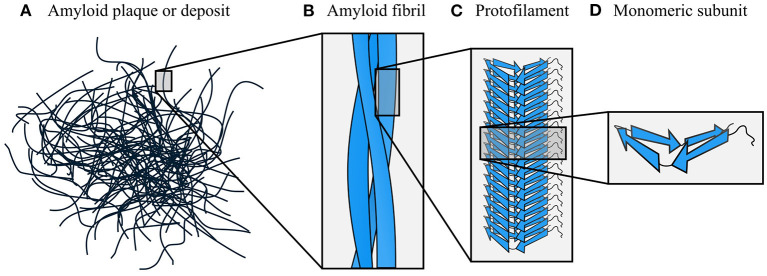
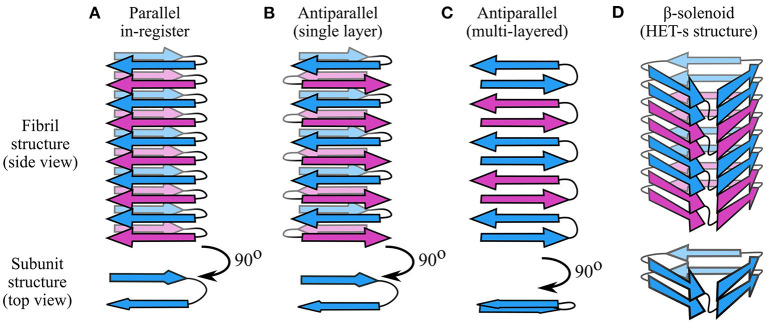
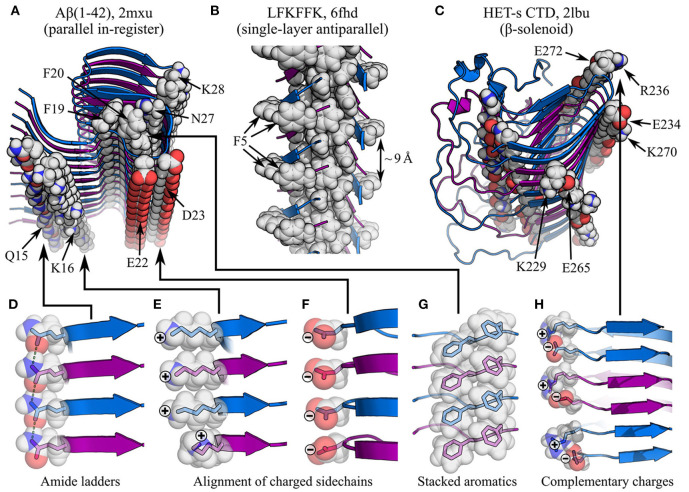
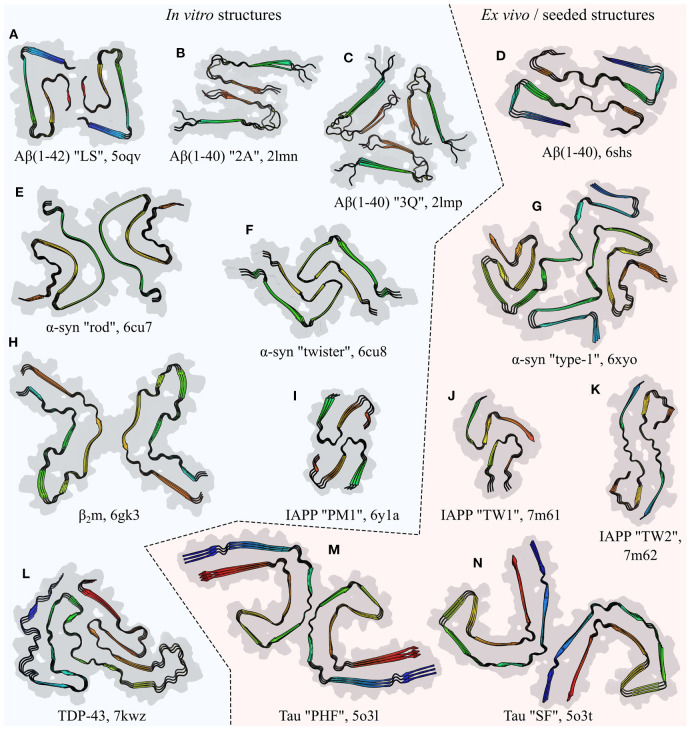
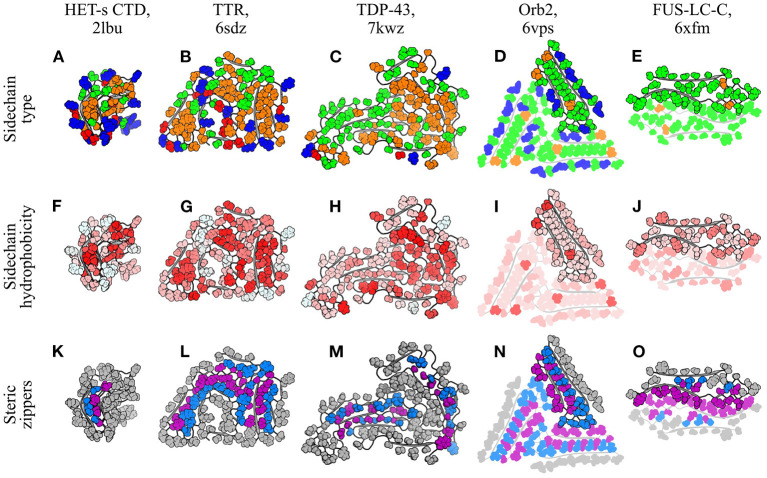
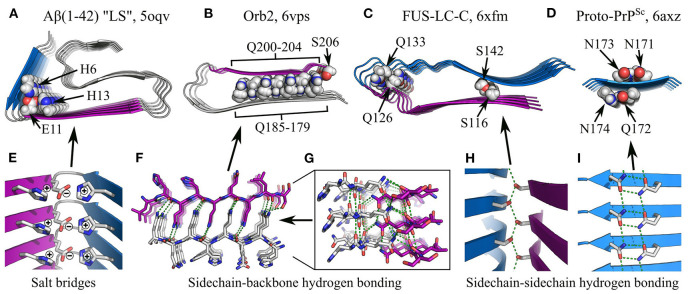
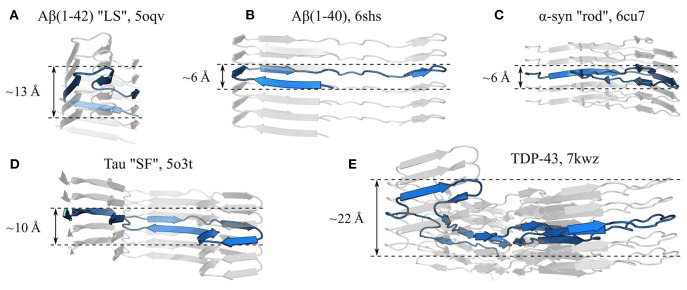
Amyloid fibrils are a pathologically and functionally relevant state of protein folding, which is generally accessible to polypeptide chains and differs fundamentally from the globular state in terms of molecular symmetry, long-range conformational order, and supramolecular scale. Although amyloid structures are challenging to study, recent developments in techniques such as cryo-EM, solid-state NMR, and AFM have led to an explosion of information about the molecular and supramolecular organization of these assemblies. With these rapid advances, it is now possible to assess the prevalence and significance of proposed general structural features in the context of a diverse body of high-resolution models, and develop a unified view of the principles that control amyloid formation and give rise to their unique properties. Here, we show that, despite system-specific differences, there is a remarkable degree of commonality in both the structural motifs that amyloids adopt and the underlying principles responsible for them. We argue that the inherent geometric differences between amyloids and globular proteins shift the balance of stabilizing forces, predisposing amyloids to distinct molecular interaction motifs with a particular tendency for massive, lattice-like networks of mutually supporting interactions. This general property unites previously characterized structural features such as steric and polar zippers, and contributes to the long-range molecular order that gives amyloids many of their unique properties. The shared features of amyloid structures support the existence of shared structure-activity principles that explain their self-assembly, function, and pathogenesis, and instill hope in efforts to develop broad-spectrum modifiers of amyloid function and pathology.

Keywords: amide ladder; amyloid structure; cryo-EM; neurodegeneration; protein aggregation; protein folding; ssNMR; steric zipper.


Conflict of interest statement

The authors declare that the research was conducted in the absence of any commercial or financial relationships that could be construed as a potential conflict of interest.

Figures

Figure 1
Figure 1
Characteristics of amyloid fibrils. (A) Structure of Aβ(1-42) fibrils produced in vitro, obtained by solid-state NMR spectroscopy (PDB ID: 2mxu; Xiao et al., 2015). The structure is shown as a ribbon diagram, with stacked monomeric subunits alternately colored blue and purple. (B) Negative-stain electron micrograph of the same fibrils, adapted with permission from Xiao et al. (2015). (C) X-ray fiber diffraction pattern of partially aligned amyloid fibrils formed by the KFFEAAAKKFFE peptide, reproduced with permission from Makin et al. (2005) (Copyright 2005 National Academy of Sciences). (D,E) Light microscopy images of light chain amyloid stained with Congo red dye, under (D) normal illumination and (E) polarized light, reproduced with permission from Swuec et al. (2019). Note the green birefringence under polarized light, indicative of cross-β structure.
Figure 2
Figure 2
Hierarchical organization of amyloid fibrils. The dominant components of amyloid plaques or deposits are amyloid fibrils (A,B), which are formed by close lateral association of protofilaments (C). In turn, protofilaments are formed by stacking of monomeric subunits, and usually consist of a single stack (D). The density map obtained by Mizuno et al. (2011) was used as a template for the fibril schematic in part (B).
Figure 3
Figure 3
Types of cross-β structures. (A) In parallel in-register structures, each subunit contributes a single strand per intermolecular β-sheet, and the strands are oriented parallel and in-register with one another. Thus, the hairpin-like structure shown in this figure has two intermolecular β-sheets. (B) In single-layered antiparallel cross-β structures, each subunit contributes a single β-strand per β-sheet, but the strand direction alternates. (C) In multi-layered antiparallel structures, each subunit contributes more than one strand per β-sheet. (D) In β-solenoids such as HET-s (Wasmer et al., 2008), subunits occupy more than one layer by coiling in a solenoidal fashion. In these schematics, adjacent subunits are alternately colored blue and purple. Each monomeric subunit in the parallel in-register and antiparallel structures is a two-strand hairpin, differing only in orientation of the strands; a different monomer structure is used for the β-solenoid, based on a simplification of the HET-s structure (Wasmer et al., 2008).
Figure 4
Figure 4
Impact of sidechain interactions on subunit stacking. (A–C) show of segments of amyloid fibrils with different types of cross-β structure, with specific interactions highlighted: (A) parallel in-register Aβ(1-42) fibrils (Xiao et al., 2015), showing amide ladders (Q15 and N27), alignment of charged sidechains (K16, E22, D23, and K28), and π-stacking (F19 and F20); (B) antiparallel LFKFFK fibrils (Salinas et al., 2018), showing a π-stacked core, but sub-optimal spacing of aromatic rings around the periphery (F5); (C) the β-solenoidal HET-s CTD (Wasmer et al., 2008), showing alignment of complementarily charged sidechains (K229-E265, E234-K270, and R236-E272) and amide ladders (unlabelled). The name of the polypeptide is given above each structure, alongside the PDB ID. Structures are shown as ribbon diagrams, with adjacent subunits alternately colored blue and purple for discrimination. Sidechains of interest are highlighted as spheres, with the color scheme: gray, carbon/hydrogen; red, oxygen; blue, nitrogen. (D–H) show close-up views of specific interactions in (A–C), with semi-transparent rendering of the spheres to show the carbon/oxygen/nitrogen bonding structure within. In (D), sidechain-sidechain hydrogen bonds are highlighted as green dashed lines. Note that the favorable stacking of aromatics in (A,G) contrasts with the suboptimal spacing between F5 rings in (B), although the sequence degeneracy of LFKFFK means it is still possible to form stacks of aromatics within the fibril core.
Figure 5
Figure 5
Comparison of the folds of amyloid fibril subunits, illustrated by examples from six polypeptides: amyloid-β (Aβ; Paravastu et al., ; Gremer et al., ; Kollmer et al., 2019), α-synuclein (α-syn; Li et al., ; Schweighauser et al., 2020), β2-microglobulin (β2m; Iadanza et al., 2018b), islet amyloid polypeptide (IAPP; Röder et al., ; Cao et al., 2021), TDP-43 (Li et al., 2021), and Tau (Fitzpatrick et al., 2017). The name of the polypeptide is given below each structure, alongside the polymorph in quotes where relevant, and the PDB ID. Each structure is a stack of three subunit layers, viewed from a perspective facing down the fibril axis and using the same scale for all panels. Structures are composites of the surface (gray) and ribbon diagram (colored) representations, with the color of the latter varying spectrally from the N-terminus (blue) to the C-terminus (red); the true termini are used for spectral coloring of (A–K), whereas the ends of the structured segments are used for (L–N). Unstructured segments are not shown. Fibrils produced entirely in vitro are shown on the left of the central dashed line, while those extracted (D,G,M,N) or seeded (J,K) from living tissue are shown on the right.
Figure 6
Figure 6
Segregation and packing of sidechains in amyloid fibrils. Five different fibril structures are shown, organized by column: (A,F,K), HET-s CTD (Wasmer et al., 2008); (B,G,L), TTR (Schmidt et al., 2019); (C,H,M), TDP-43 (Li et al., 2021); (D,I,N), Orb2 (Hervas et al., 2020); (E,J,O), FUS-LC-C (Lee et al., 2020). The name of the polypeptide is given above each structure, alongside the PDB ID. Each structure is a single subunit layer, viewed from a perspective facing down the fibril axis and using the same scale for all panels. Structures are composites of the ribbon (gray) and spheres (colored) representations, with the latter used to specifically highlight sidechains. Three different color schemes are used for sidechains, with one per row. (A–E) are colored according to sidechain type: red, negatively charged (D/E); blue, positively charged (K/R); green, hydrophilic uncharged (Q/N/S/T/Y); orange, hydrophobic (A/C/F/I/L/M/P/V/W). Histidines are colored blue or green according to the expected protonation state. (F–J) are colored according a normalized hydrophobicity scale (Eisenberg et al., 1984), with the most hydrophobic residues colored red and the most hydrophilic colored white. (K–O) are colored to highlight selected steric zippers, with sidechains in zipper-forming strands alternately colored either blue or purple, so that the two halves of each intra-protofilament zipper are colored differently. For the purpose of this figure, a steric zipper is defined as a chain segment whose sidechains are buried in the fibril core and interdigitated between the sidechains of an opposing chain segment. This includes cases varying from a relatively low [e.g., (K)] to a high [e.g., (N)] level of interdigitation, and reflects the fact that steric zippers, as defined here, exist on a continuum rather than having a simply defined cut-off. For clarity, only some of the zipper segments have been highlighted for TDP-43. For the Orb2 and FUS-LC-C structures, which have multiple protofilaments, additional protofilaments are shown with semi-transparent rendering, to aid in discrimination between protofilaments and identification of inter-protofilament steric zippers. Note that FUS-LC-C contains an inter-protofilament homo-zipper, which is formed by identical chain segments from either side of the protofilament binding interface, and has the same color for each half of the zipper.
Figure 7
Figure 7
Specific interactions in subunit folding. (A–D) show the structures of various individual protofilaments, with specific interactions highlighted: (A), Aβ(1-42) “LS” polymorph, (Gremer et al., 2017), showing the H6-E11-H13 salt bridge; (B), Orb2 (Hervas et al., 2020), with sidechain-backbone hydrogen bonding by interdigitated glutamines, and sidechain-sidechain hydrogen bonding between Q179 and S206; (C), FUS-LC-C (Lee et al., 2020), with sidechain-backbone hydrogen bonding from the sidechain amide of Q126 to the backbone carbonyl of Q133, and sidechain-sidechain hydrogen bonding between S116 and S142; (D), amyloid-like microcrystals of the prion-derived proto-PrPSc peptide (Gallagher-Jones et al., 2018), showing intra-strand sidechain-sidechain hydrogen bonding (“polar clasps”) by the residue pairs N171-N173 and Q172-N174. The name of the polypeptide is given above each structure, alongside the polymorph in quotes where relevant, and the PDB ID. Structures are shown as ribbon diagrams, with chain segments colored gray, blue, or purple for discrimination. Sidechains of interest are highlighted as spheres, with the color scheme: gray, carbon/hydrogen; red, oxygen; blue, nitrogen. For (B,C), missing hydrogens have been modeled in. Throughout panels (A–D), all structures use the same scale. (E–I) show close-up views of specific interactions in (A–D). In (E,H,I), structures are shown as ribbon diagrams with sidechains as sticks, using the same color scheme as (A–D); in (F–G), both the backbone and sidechains are shown as sticks, with carbons in the Q200-S206 segment colored purple. For clarity, and consistency between structures with varying detail, hydrogens are not represented with sticks and are thus implicit. Hydrogen bonds are represented by green dashed lines.
Figure 8
Figure 8
The subunits of amyloid fibrils often occupy a single layer of the protofilament stack, but are not truly planar. Panels show side-on views of single protofilaments from fibrils formed by (A) Aβ(1-42) “LS” polymorph (Gremer et al., 2017), (B) Aβ(1–40) (Kollmer et al., 2019), (C) α-syn “rod” polymorph (Li et al., 2018a), (D) Tau “SF” polymorph (Fitzpatrick et al., 2017), and (E) TDP-43 (Li et al., 2021), with a single subunit highlighted in blue in each case. The name of the polypeptide is given above each structure, alongside the polymorph in quotes where relevant, and the PDB ID. Measurements show the approximate subunit height variation along the protofilament axis. All panels use the same scale.
Figure 9
Figure 9
Schematic of common modes of protofilament organization. Fibrils can be (A) a single protofilament, (B–D) a twisted ribbon or tubular structure formed by association of several protofilaments, often with rotational symmetry about the fibril axis, or (E) a tape-like side-by-side association of protofilaments. In the top-down schematics, blue squares with red arrows represent top-down views of subunits, with the red arrows showing their relative orientation in the subunit plane. In the side-on schematics for (B), blue pentagons represent side views of protofilament subunits. As shown in this panel, twofold-symmetric fibrils or protofilament groups can have an in-register (C2) association of laterally apposed subunit stacks, or a staggered (pseudo-21) organization in which the two stacks are half a β-sheet spacing out of register. While the former optimizes interactions that rely on alignment of the subunits in the same plane, the latter allows interdigitation of sidechains that protrude into the interface. The density map obtained by Mizuno et al. (2011) was used as a template for the schematic in (C).
Figure 10
Figure 10
Specific interactions in supra-protofilament assembly (part 1). (A–C) show various fibril structures with specific inter-protofilament interactions highlighted: (A), human serum amyloid A (hSAA; Liberta et al., 2019), with an inter-protofilament steric zipper; (B), β2m (Iadanza et al., 2018b), with π-stacking by tyrosines and sidechain-sidechain hydrogen bonding between Y67 and E69; (C), murine serum amyloid A (mSAA; Liberta et al., 2019), with salt bridges between D59 and R61. The name of the polypeptide is given above each structure, alongside the PDB ID. Structures are shown as ribbon diagrams, with protofilaments colored gray or purple for discrimination. Sidechains of interest are highlighted as spheres, with the color scheme: gray, carbon/hydrogen; red, oxygen; blue, nitrogen. For (B), missing hydrogens have been modeled in. The same scale is used throughout (A–C), and is shared with that used in Figures 11A,B. (D–G) show close-up views of the highlighted interactions. In (E–G), structures are shown as ribbon diagrams with sidechains as sticks, using the same color scheme as before; (D) is a side view of the steric zipper in hSAA fibrils, shown entirely as sticks and with the carbons on one protofilament colored purple. For clarity and consistency between structures, hydrogens are not represented with sticks and are thus implicit. Hydrogen bonds are represented by green dashed lines, and salt bridges in mSAA are represented by orange dashed lines. Note that the zig-zag alternation of sidechains across the interfaces in (D,G) is due to pseudo-21 symmetry.
Figure 11
Figure 11
Specific interactions in supra-protofilament assembly (part 2). (A,B) show fibril structures with specific inter-protofilament interactions highlighted: (A), Tau “PHF” polymorph (Fitzpatrick et al., 2017), with backbone-backbone hydrogen bonding by triglycine repeats; (B), FUS-LC-C (Lee et al., 2020), with sidechain-backbone hydrogen bonding by interdigitated glutamines, and sidechain-sidechain hydrogen bonding by Y136, Q145, and Q147. The name of the polypeptide is given above each structure, alongside the polymorph in quotes where relevant, and the PDB ID. Structures are shown as ribbon diagrams, with protofilaments colored gray or purple for discrimination. Sidechains of interest are highlighted as spheres, with the color scheme: gray, carbon/hydrogen; red, oxygen; blue, nitrogen. For (B), missing hydrogens have been modeled in. The same scale is used throughout (A,B), and is shared with that used in Figures 10A–C. (C–F) show close-up views of the highlighted interactions. In (F), the structure is shown as a ribbon diagram with the sidechains as sticks, using the same color scheme as before; in (C–E), both the backbone and sidechains are shown as sticks, with carbons on one protofilament colored purple. For clarity and consistency between structures, hydrogens are not represented with sticks and are thus implicit. Hydrogen bonds are represented by green dashed lines. Note that the zig-zag alternation of polypeptide backbones across the interface in (D) is due to pseudo-21 symmetry.

References

    1. Adamcik J., Jung J.-M., Flakowski J., De Los Rios P., Dietler G., Mezzenga R. (2010). Understanding amyloid aggregation by statistical analysis of atomic force microscopy images. Nat. Nanotechnol. 5, 423–428. 10.1038/nnano.2010.59 - DOI - PubMed
    1. Adamcik J., Mezzenga R. (2011). Adjustable twisting periodic pitch of amyloid fibrils. Soft Matter. 7, 5437–5443. 10.1039/c1sm05382e - DOI
    1. Adamcik J., Sánchez-Ferrer A., Ait-Bouziad N., Reynolds N. P., Lashuel H. A., Mezzenga R. (2016). Microtubule-binding R3 fragment from Tau self-assembles into giant multistranded amyloid ribbons. Angew. Chem. Int. Ed. 55, 618–622. 10.1002/anie.201508968 - DOI - PubMed
    1. Ahmed M., Davis J., Aucoin D., Sato T., Ahuja S., Aimoto S., et al. . (2010). Structural conversion of neurotoxic amyloid-β1−42 oligomers to fibrils. Nat. Struct. Mol. Biol. 17, 561–567. 10.1038/nsmb.1799 - DOI - PMC - PubMed
    1. Al-Garawi Z. S., McIntosh B. A., Neill-Hall D., Hatimy A. A., Sweet S. M., Bagley M. C., et al. . (2017). The amyloid architecture provides a scaffold for enzyme-like catalysts. Nanoscale 9, 10773–10783. 10.1039/C7NR02675G - DOI - PubMed