. 2022 Jun 1:13:827215.
doi: 10.3389/fphar.2022.827215. eCollection 2022.

CLP1 is a Prognosis-Related Biomarker and Correlates With Immune Infiltrates in Rheumatoid Arthritis

Affiliations

CLP1 is a Prognosis-Related Biomarker and Correlates With Immune Infiltrates in Rheumatoid Arthritis

Zhenyu Zhao et al. Front Pharmacol. .

Abstract

Rheumatoid arthritis (RA) is a chronic, heterogeneous autoimmune disease with a high disability rate that seriously affects society and individuals. However, there is a lack of effective and reliable diagnostic markers and therapeutic targets. In this study, we identified diagnostic markers of RA based on RNA modification and explored its role as well as degree of immune cell infiltration. We used the gene expression profile data of three synovial tissues (GSE55235, GSE55457, GSE77298) from the Gene Expression Omnibus (GEO) database and the gene of 5 RNA modification genes (including m6A, m1A, m5C, APA, A-1), combined with cluster analysis, identified four RNA modifiers closely related to RA (YTHDC1, LRPPRC, NOP2, and CLP1) and five immune cells namely T cell CD8, CD4 memory resting, T cells regulatory (Tregs) Macrophages M0, and Neutrophils. Based on the LASSO regression algorithm, hub genes and immune cell prediction models were established respectively in RA and a nomogram based on the immune cell model was built. Around 4 key RNA modification regulator genes, miRNA-mRNA, mRNA-TF networks have been established, and GSEA-GO, KEGG-GSEA enrichment analysis has been carried out. Finally, CLP1 was established as an effective RA diagnostic marker, and was highly positively correlated with T cells follicular helper (Tfh) infiltration. On the other hand, highly negatively correlated with the expression of mast cells. In short, CLP1 may play a non-negligible role in the onset and development of RA by altering immune cell infiltration, and it is predicted to represent a novel target for RA clinical diagnosis and therapy.

Keywords: CLP1; RNA modification; diagnostic biomarkers; gene expression profile data; rheumatoid arthritis.


Conflict of interest statement

The authors declare that the research was conducted in the absence of any commercial or financial relationships that could be construed as a potential conflict of interest.

Figures
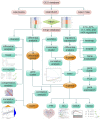
FIGURE 1
FIGURE 1
The flow chart of the current study. This study compared the expression characteristics of RNA modifiers and immune infiltration characteristics in rheumatoid customs and normal synovial tissues, constructed a prediction model and a miRNA/transcription factor-RNA modifier interaction network, and performed molecular subtype analysis to screen out the diagnosis landmark.
FIGURE 2
FIGURE 2
Data integration of typhoon expression matrix. (A): The overall gene expression values of the three GEO data sets before correction, (B): The overall gene expression values of the three GEO data sets after correction.
FIGURE 3
FIGURE 3
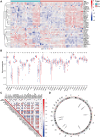
Expression characteristics and gene location of RNA modifiers. (A): Heat map shows the expression characteristics of RNA modifiers in rheumatoid synovial tissues and normal tissues. Red stands for high expression level, and blue for low expression level; (B): box plot shows the difference in the expression of RNA modifiers in synovial tissues and normal tissues, with significant differences in the expression of 8 genes. (C): Correlation analysis of RNA modifiers, positive correlation is represented by red while negative correlation is represented by blue. (D): The position of a differential gene on the chromosome (All figures * represents p <0.05, ** represents p <0.01, *** represents p <0.001)
FIGURE 4
FIGURE 4
Characteristics of Rheumatoid Arthritis Immune Infiltration. (A): Correlation of infiltration degree of 22 kinds of immune cell in synovial tissue, (B–W): Difference analysis of immune cell infiltration degree between synovial tissue and normal tissue in rheumatoid arthritis.
FIGURE 5
FIGURE 5
Molecular cluster of RNA modifiers. (A–C): Clustering of synovial samples based on RNA modifiers. (D): PCA analysis under different groups, where red is cluster A and blue is cluster B. (E–H): Differences in the expression of hub genes under different groups of.
FIGURE 6
FIGURE 6
Model construction of hub gene and immune cell. (A,B): Determine the best penalty value in the LASSO regression algorithm, and screen the RNA modifiers and immune cells most related to rheumatoid arthritis. (C,D): Uses forest plots to display the screened RNA modifiers and immune cells.
FIGURE 7
FIGURE 7
Immune cell prediction model nomogram. The nomogram was constructed using the immune cell prediction model.
FIGURE 8
FIGURE 8
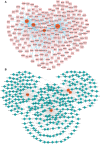
miRNA- and TF-RNA modifier network construction. (A): mRNA-TF network of hub genes related to RA, pink nodes indicate TF, red nodes indicate key genes related to RA. (B): Keys related to RA in the mRNA-miRNA network of genes, the blue nodes represent miRNAs, and the red nodes represent key genes related to RA.
FIGURE 9
FIGURE 9
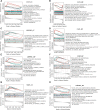
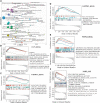
GSEA-GO analysis of key genes. (A–H): The results of functional enrichment of GSEA-GO (including BP, CC, and MF) showing CLP1, YTHDC1, LRPPRC, and NOP2 respectively displayed.
FIGURE 10
FIGURE 10
Key gene GESA-KEGG analysis. (A): Summary of key gene GSEA-KEGG functions, the horizontal axis represents the P-adjust value, (B–E): CLP1, YTHDC1, LRPPRC, NOP2 GSEA-KEGG function enrichment results. (F): NOP2-MF function analysis.
FIGURE 11
FIGURE 11
Correlation between key genes and immunity.
FIGURE 12
FIGURE 12
Differential Genes and Molecular Types of Rheumatoid Arthritis. (A): The heat map depicts the differential genes between RA and normal synovial tissues, the top ten highly expressed genes in RA were selected, (B): The volcano map depicts the differences in gene expression between RA and normal synovial tissues, and the top ten highly expressed genes in RA tissues in the category were chosen. (C–E): Clustering and grouping of synovial samples based on differential genes for rheumatoid arthritis. (D): PCA analysis under different groups, where red is cluster A and blue is cluster B. (E): Differences in the expression of key genes in different groups.
FIGURE 13
FIGURE 13
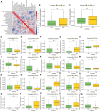
Correlation between key genes and molecular typing of rheumatoid arthritis. (A–H): The expression of different rheumatoid arthritis differential genes and hub genes differed under molecular classification groupings, only CLP1 showed significant differences, thus we define it as a diagnostic marker.
FIGURE 14
FIGURE 14
Diagnostic marker gene and immune correlation analysis. (A–K): CLP1 gene correlation analysis with immune cells, the slope is the correlation size, and the Pvalue represents the significance level.

References

    1. An J., Lai J., Sajjanhar A., Batra J., Wang C., Nelson C. C. (2015). J-circos: an Interactive Circos Plotter. Bioinformatics 31 (9), 1463–1465. 10.1093/bioinformatics/btu842 - DOI - PubMed
    1. Baldwin A. S., Jr. (2001). Series Introduction: the Transcription Factor NF-kappaB and Human Disease. J. Clin. Invest. 107 (1), 3–6. 10.1172/JCI11891 - DOI - PMC - PubMed
    1. Balogh E., Veale D. J., McGarry T., Orr C., Szekanecz Z., Ng C. T., et al. (2018). Oxidative Stress Impairs Energy Metabolism in Primary Cells and Synovial Tissue of Patients with Rheumatoid Arthritis. Arthritis Res. Ther. 20 (1), 95. 10.1186/s13075-018-1592-1 - DOI - PMC - PubMed
    1. Barrett T., Troup D. B., Wilhite S. E., Ledoux P., Rudnev D., Evangelista C., et al. (2007). NCBI GEO: Mining Tens of Millions of Expression Profiles-Ddatabase and Tools Update. Nucleic Acids Res. 35 (Database issue), D760–D765. 10.1093/nar/gkl887 - DOI - PMC - PubMed
    1. Broeren M. G., de Vries M., Bennink M. B., Arntz O. J., Blom A. B., Koenders M. I., et al. (2016). Disease-Regulated Gene Therapy with Anti-inflammatory Interleukin-10 under the Control of the CXCL10 Promoter for the Treatment of Rheumatoid Arthritis. Hum. Gene Ther. 27 (3), 244–254. 10.1089/hum.2015.127 - DOI - PubMed