

Longitudinal Alterations in Gait Features in Growing Children With Duchenne Muscular Dystrophy
- PMID: 35721358
- PMCID: PMC9201072
- DOI: 10.3389/fnhum.2022.861136
Longitudinal Alterations in Gait Features in Growing Children With Duchenne Muscular Dystrophy
Abstract
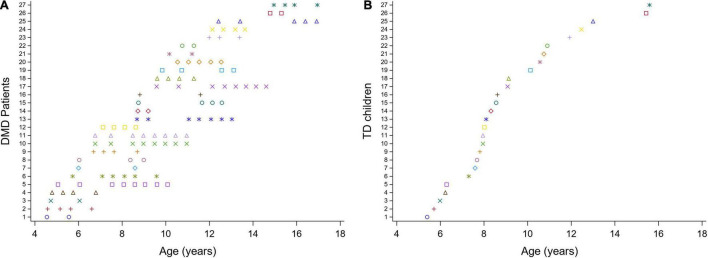
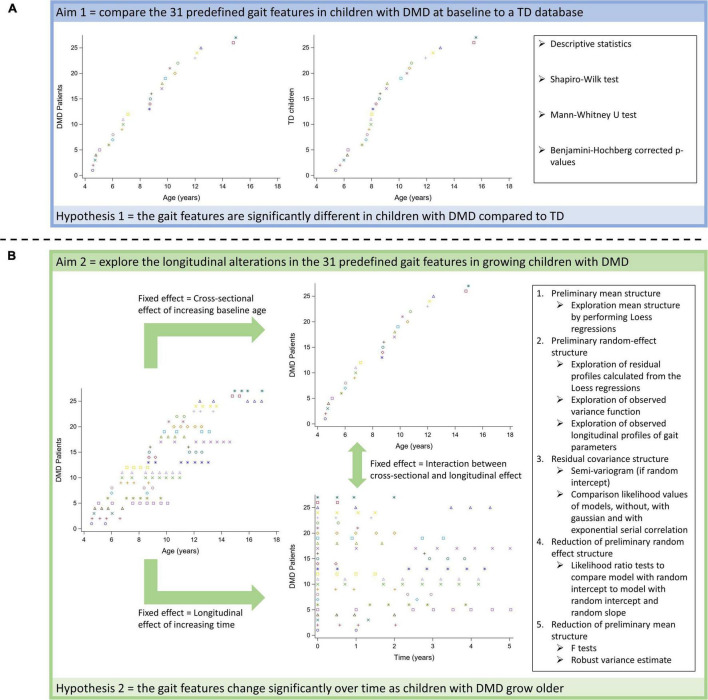
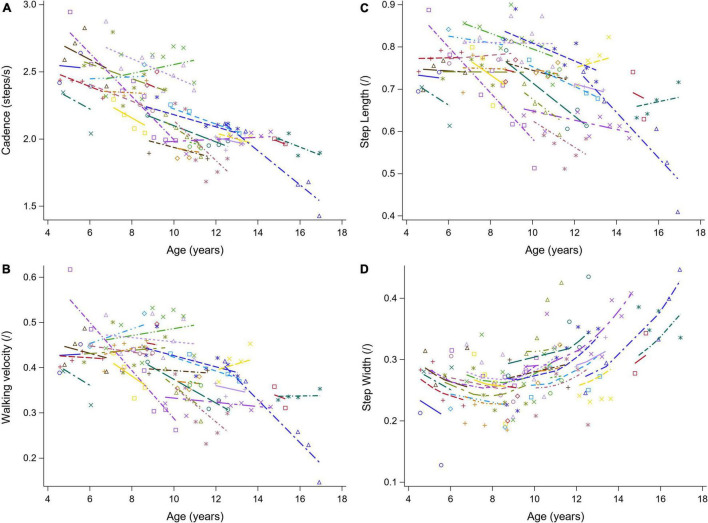
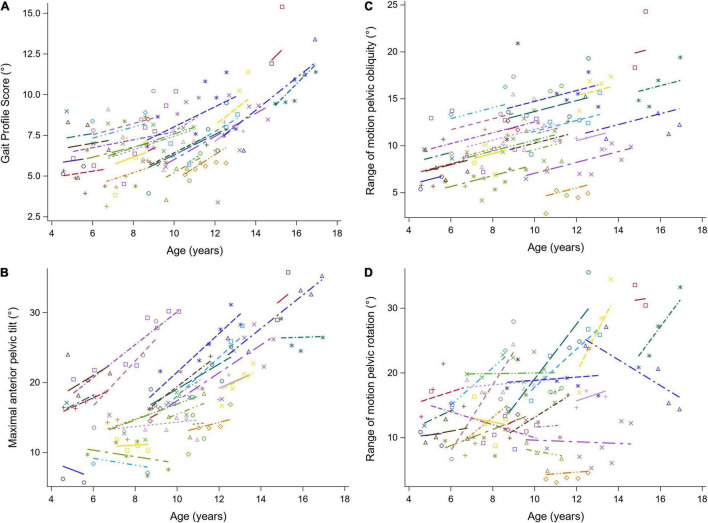
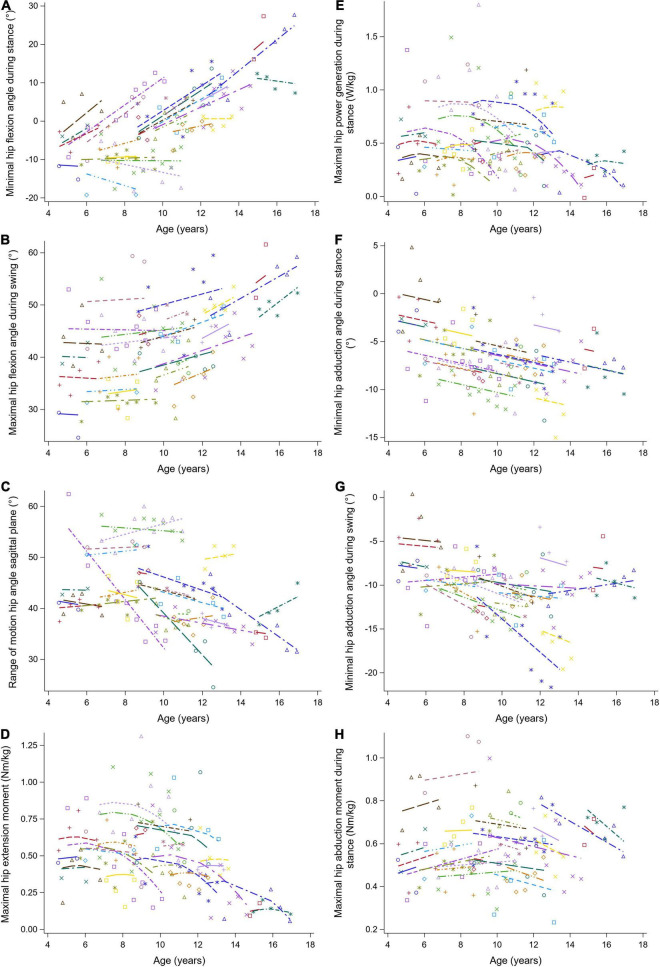
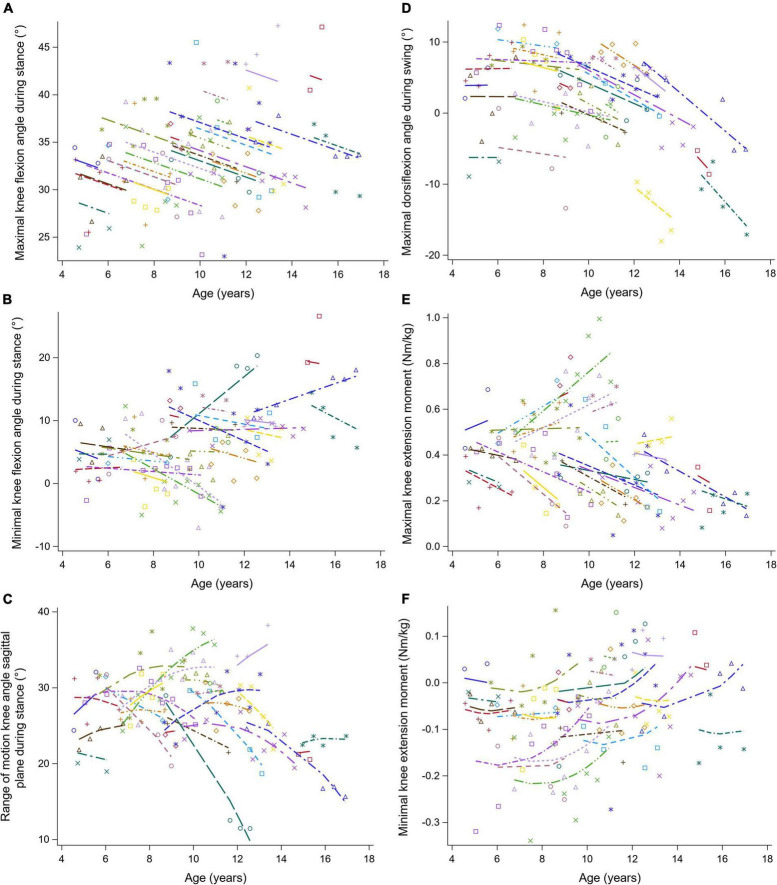
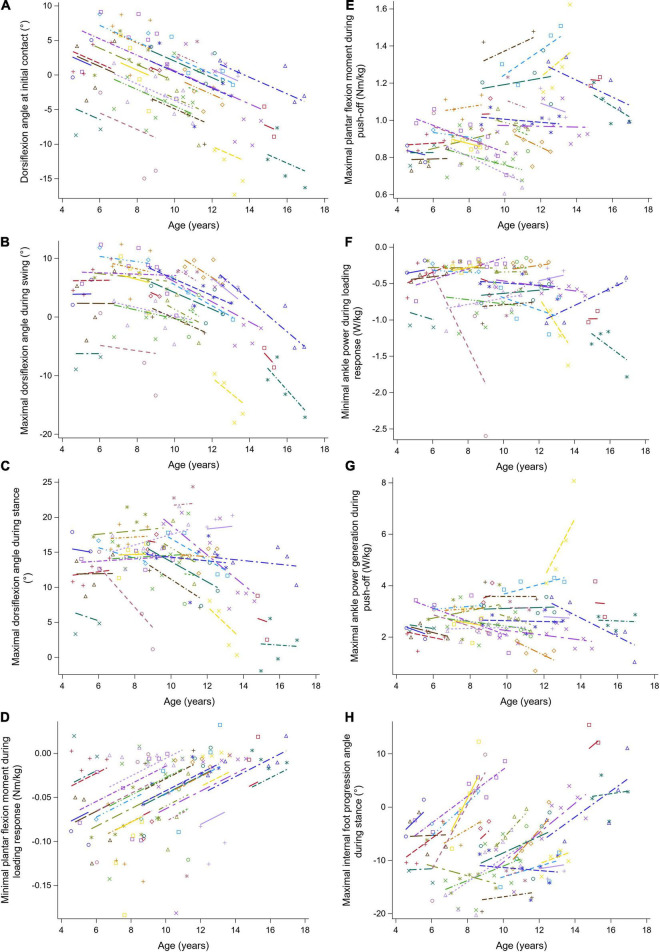
Prolonging ambulation is an important treatment goal in children with Duchenne muscular dystrophy (DMD). Three-dimensional gait analysis (3DGA) could provide sensitive parameters to study the efficacy of clinical trials aiming to preserve ambulation. However, quantitative descriptions of the natural history of gait features in DMD are first required. The overall goal was to provide a full delineation of the progressive gait pathology in children with DMD, covering the entire period of ambulation, by performing a so-called mixed cross-sectional longitudinal study. Firstly, to make our results comparable with previous literature, we aimed to cross-sectionally compare 31 predefined gait features between children with DMD and a typically developing (TD) database (1). Secondly, we aimed to explore the longitudinal changes in the 31 predefined gait features in growing boys with DMD using follow-up 3DGA sessions (2). 3DGA-sessions (n = 124) at self-selected speed were collected in 27 boys with DMD (baseline age: 4.6-15 years). They were repeatedly measured over a varying follow-up period (range: 6 months-5 years). The TD group consisted of 27 children (age: 5.4-15.6 years). Per measurement session, the spatiotemporal parameters, and the kinematic and kinetic waveforms were averaged over the selected gait cycles. From the averaged waveforms, discrete gait features (e.g., maxima and minima) were extracted. Mann-Whitney U tests were performed to cross-sectionally analyze the differences between DMD at baseline and TD (1). Linear mixed effect models were performed to assess the changes in gait features in the same group of children with DMD from both a longitudinal (i.e., increasing time) as well as a cross-sectional perspective (i.e., increasing baseline age) (2). At baseline, the boys with DMD differed from the TD children in 17 gait features. Additionally, 21 gait features evolved longitudinally when following-up the same boys with DMD and 25 gait features presented a significant cross-sectional baseline age-effect. The current study quantitatively described the longitudinal alterations in gait features in boys with DMD, thereby providing detailed insight into how DMD gait deteriorates. Additionally, our results highlight that gait features extracted from 3DGA are promising outcome measures for future clinical trials to quantify the efficacy of novel therapeutic strategies.
Keywords: Duchenne muscular dystrophy; gait pattern; longitudinal study; mixed models for repeated measures; three-dimensional gait analysis; typically developing children.
Copyright © 2022 Vandekerckhove, Van den Hauwe, De Beukelaer, Stoop, Goudriaan, Delporte, Molenberghs, Van Campenhout, De Waele, Goemans, De Groote and Desloovere.
Conflict of interest statement
The authors declare that the research was conducted in the absence of any commercial or financial relationships that could be construed as a potential conflict of interest.
Figures
References
-
- Benjamini Y., Hochberg Y. (1995). Controlling the false discovery rate: a practical and powerful approach to multiple testing. J. R. Stat. Soc. Ser. B 57 289–300. 10.1111/j.2517-6161.1995.tb02031.x - DOI
-
- Boccardi S., Gabardi C., Negrini A., Santambrogio G. C. (1997). Locomotor and posture strategies in patients with Duchenne Muscular Dystrophy (DMD): Part I. Gait analysis. Eur. Med. Phys. 33 13–22.
-
- Bushby K., Bourke J., Bullock R., Eagle M., Gibson M., Quinby J. (2005). The multidisciplinary management of Duchenne muscular dystrophy. Curr. Paediatr. 15 292–300. 10.1016/j.cupe.2005.04.001 - DOI
Associated data
LinkOut - more resources
Full Text Sources