. 2022 May 30;25(6):104486.
doi: 10.1016/j.isci.2022.104486. eCollection 2022 Jun 17.

A combined human gastruloid model of cardiogenesis and neurogenesis

Affiliations

A combined human gastruloid model of cardiogenesis and neurogenesis

Zachary T Olmsted et al. iScience. .

Abstract

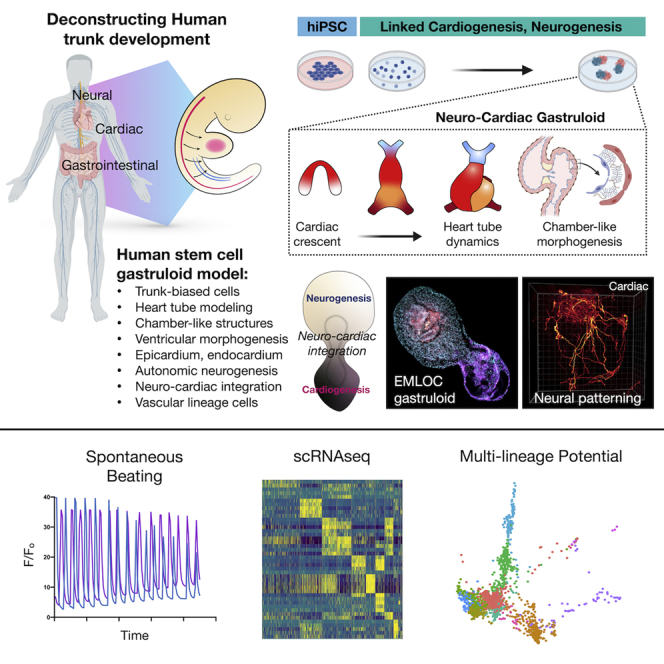
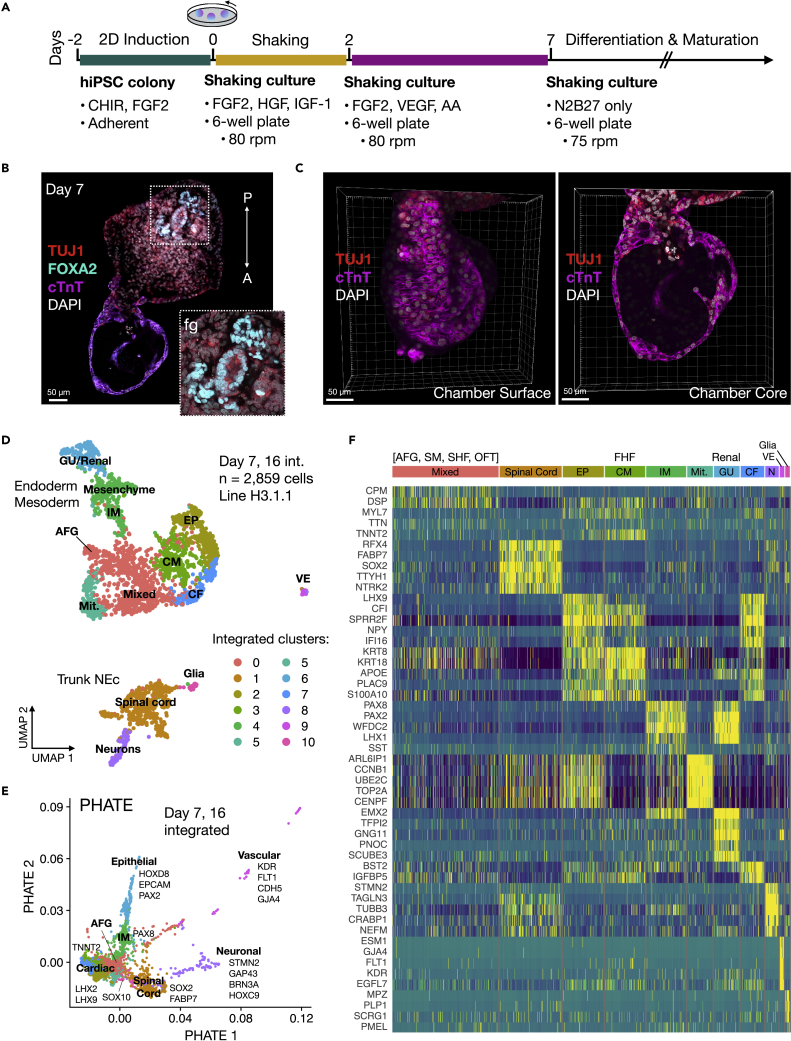
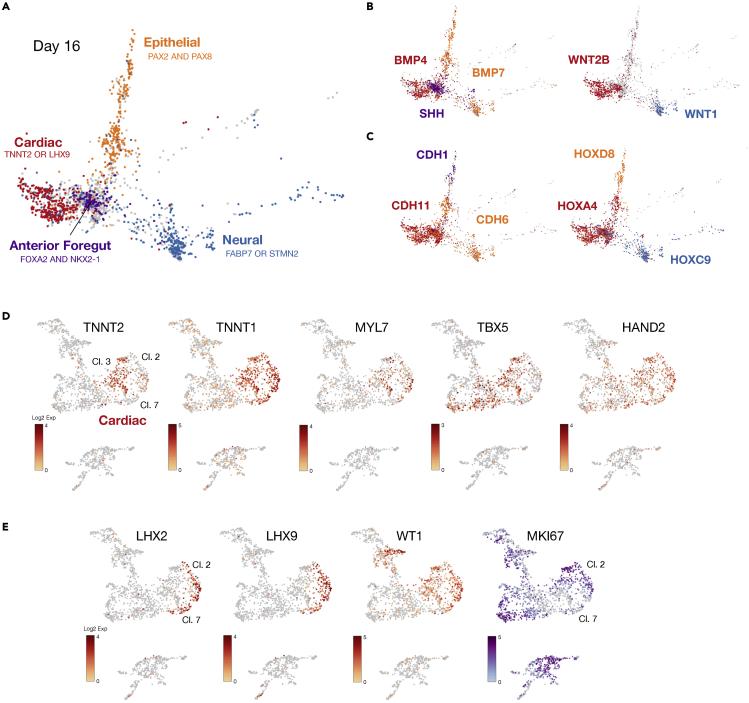
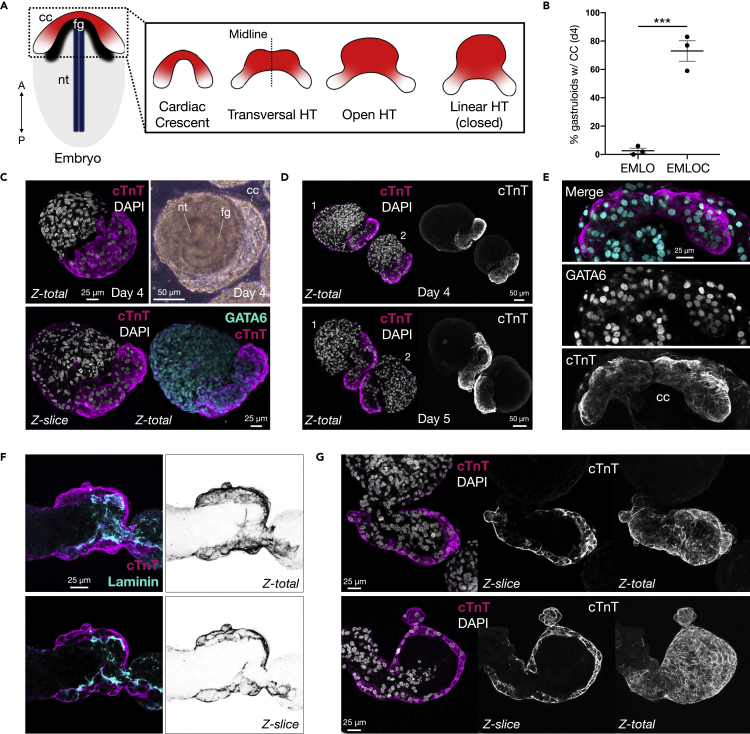
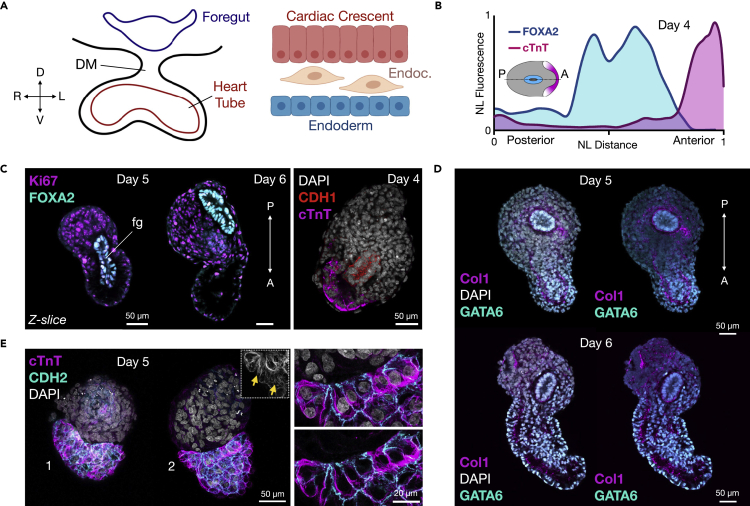
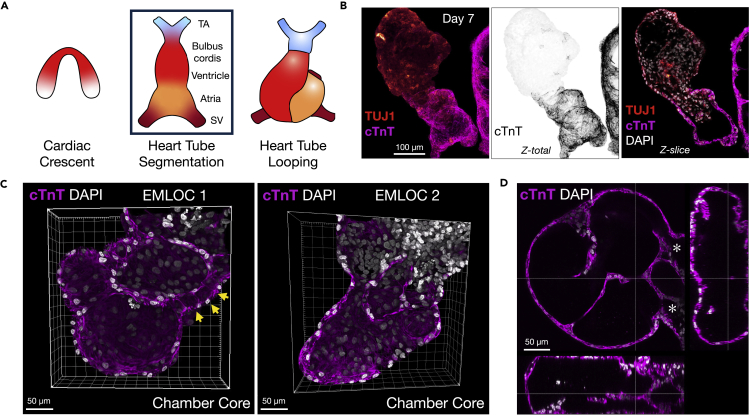
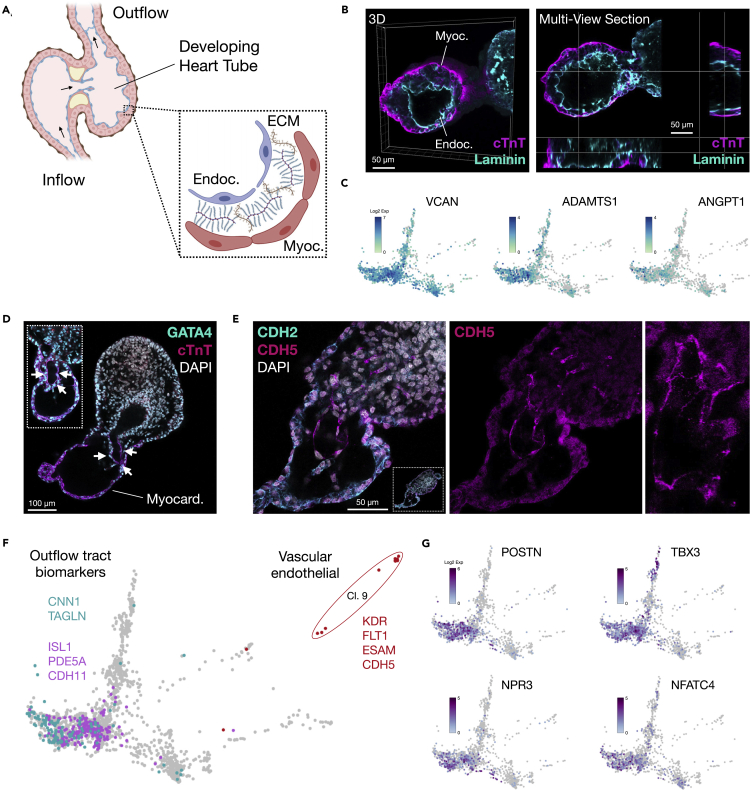
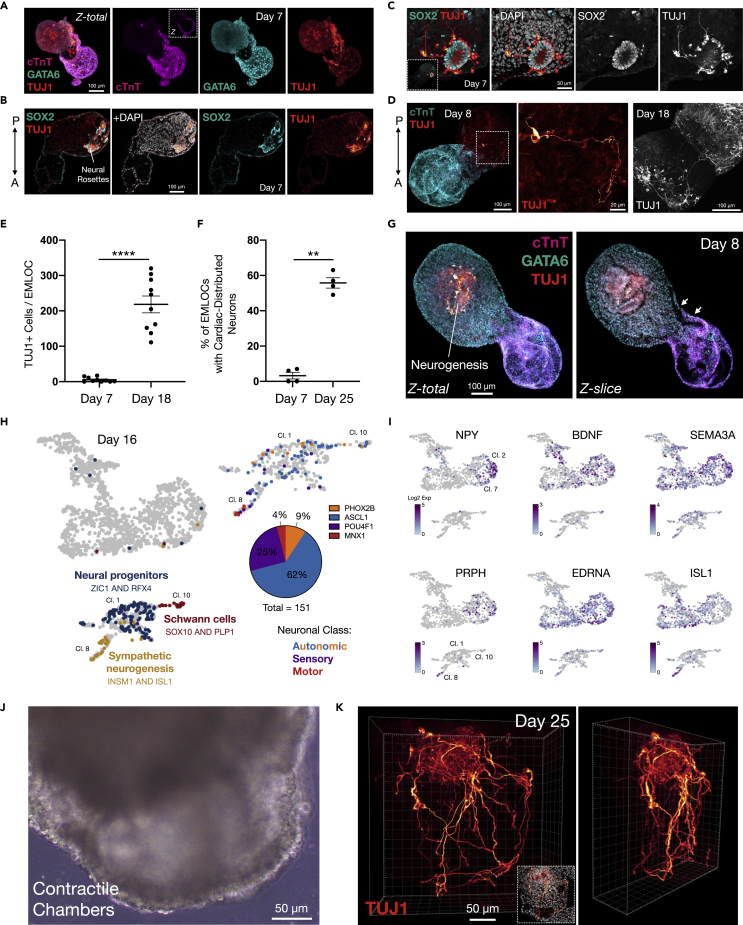
Multi-lineage development from gastruloids is enabling unprecedented opportunities to model and study human embryonic processes and is expected to accelerate ex vivo strategies in organ development. Reproducing human cardiogenesis with neurogenesis in a multi-lineage context remains challenging, requiring spatiotemporal input of paracrine and mechanical cues. Here we extend elongating multi-lineage organized (EMLO) gastruloids to include cardiogenesis (EMLOC) and describe interconnected neuro-cardiac lineages in a single gastruloid model. Contractile EMLOCs recapitulate numerous interlinked developmental features including heart tube formation and specialization, cardiomyocyte differentiation and remodeling phases, epicardium, ventricular wall morphogenesis, chamber-like structures and formation of a putative outflow tract. The EMLOC cardiac region, which originates anterior to gut tube primordium, is progressively populated by neurons in a spatial pattern mirroring the known distribution of neurons in the innervated human heart. This human EMLOC model represents a multi-lineage advancement for the study of coincident neurogenesis and cardiogenesis.

Keywords: Cell biology; Genomics; Stem cells research.


Conflict of interest statement

All affiliations are listed on the title page of the manuscript. All funding sources for this study are listed in the “acknowledgments” section of the manuscript. We, the authors and our immediate family members, have no financial intersts to declare. We, the authors and our immediate family members, have no positions to declare and are not members of the journal’s advisory board. A provisional USPTO patent on EMLOCs has been filed with patent application number 63/311,498. The authors declare no other competing interests.

Figures

None
Graphical abstract
Figure 1
Figure 1
EMLOC gastruloids capture cell type diversity of human cardiogenesis and trunk development (A) Overview of protocol for EMLOC gastruloid generation. Cardiogenesis was induced at 48 h post-aggregation by addition of VEGF and ascorbic acid (AA). (B) Immunofluorescence of day 7H3.1.1 EMLOC immunostained for TUJ1 (red), cTnT (magenta), FOXA2 (cyan) and counterstained with DAPI (gray). Inset is high magnification Z-slice of FOXA2 foregut (fg) initialization. Anterior (A) to posterior (P) orientation is descriptive. (C) 3D reconstruction of anterior cardiac region from (B) with TUJ1 (red), cTnT (magenta) and DAPI (gray). The EMLOC chamber surface (left) and core (right) are shown. Individual scale bars provided. (D) UMAP visualization of ten annotated clusters from the integrated scRNAseq dataset containing day 7 (1,004 cells) and day 16 (1,855 cells) time points in EMLOC formation (2,859 total cells). (E) PHATE visualization from the integrated dataset shown in (D). Cell lineages are labeled along with upregulated DEGs. (F) Heatmap of the top five DEGs for each cluster of the integrated scRNAseq dataset (see also Data S1). Bright yellow depicts upregulated differential gene expression. Abbreviations: anterior foregut (AFG), cardiac fibroblast (CF), cardiomyocyte (CM), epicardial cells (EP), first heart field (FHF), genitourinary (GU), intermediate mesoderm (IM), mitotic (mit), neuronal (N), outflow tract (OFT), second heart field (SHF), splanchnic mesoderm (SM), vascular endothelial cells (VE).
Figure 2
Figure 2
Diverging lineages in EMLOCs advance according to in vivo developmental principles (A) Day 16 EMLOC scRNAseq dataset visualized by PHATE. Superimposed developmental lineages include cardiac (TNNT2 or LHX9), anterior foregut (FOXA2 and NKX2-1), epithelial (PAX2 and PAX8), and neural (FABP7 or STMN2). (B) Signaling pathways segregate along diverging lineages in EMLOCs. BMP4 vs. BMP7 vs. SHH is shown (left) along withWNT2B vs. WNT1. (C) Preserved cadherin and Hox codes in EMLOCs. CDH1 vs. CDH6 vs. CDH11 is shown (left) along withHOXA4 vs. HOXC9 vs. HOXD8 (right). (D and E) Day 16 EMLOC scRNAseq dataset visualized by UMAP. (D) Genes for sarcomere proteins involved in contractility (TNNT2, TNNT1, MYL7) are upregulated primarily in cluster 3. Biomarkers for FHF (TBX5) and SHF (HAND2) are shown. (E) Epicardial cell and cardiac fibroblast biomarkers LHX2, LHX9, WT1 are upregulated in clusters two and 7. Cell proliferation marker MKI67 depicts fewer mitotic cells in cluster 7 vs. cluster 2.
Figure 3
Figure 3
EMLOCs recapitulate early polarized heart tube formation events (A) Cartoon schematic of the embryo depicting anterior cardiac crescent (cc, red/white), foregut cavity (fg, black), and neural tube (nt, dark blue). Anterior-posterior axis is indicated. The bilateral cardiac crescent fuses to form the transversal heart tube (HT), dorsally open heart tube, and linear heart tube (closed). (B) Percentage of day 4 gastruloids with cardiac crescent using the original EMLO protocol (Olmsted and Paluh, 2021a; 2021b) versus the optimized EMLOC protocol (N = 3 repeat experiments; ∗∗∗p = 0.0007, t = 9.474, df = 4 by unpaired two-tailed t-test). (C) Day 4 EMLOCs exhibit cTnT+ cardiac crescent-like structures (magenta, top) with GATA6+ nuclei (bottom, cyan). Phase image of day 4 EMLOC is shown with labeled nt, fg, and cc corresponding structures (top right). (D) Comparison of cTnT+ cardiogenic regions in day 4 versus day 5 EMLOCs. Two adjacent EMLOCs are shown for each time point. (E) High magnification of cardiac crescent structure with cTnT (magenta) and GATA6 (cyan). Individual channels are shown without pseudocolor. (F) Immunofluorescence of cTnT (magenta) and laminin (cyan) with inverted cTnT channels depicts developing heart tube-like structure in EMLOCs (day 6). Z-slices and cTnT maximal projections are shown. (G) Cardiac chamber precursors in two separate EMLOCs (day 7). Z-slices and cTnT maximal projections are shown. Individual scale bars provided.
Figure 4
Figure 4
Cardiogenesis occurs anterior to gut tube endoderm (A) Left: cartoon schematic of foregut and heart tube developmental cross-section with dorsal mesocardium (DM). The dorsal-ventral (D-V) and right-left (R-L) embryonic axes are shown. Right: cardiac crescent differentiation microenvironment. Cardiomyocyte progenitors (red), endocardium (tan), and definitive endoderm (blue) are shown. (B) Biomarker distribution using cTnT (cardiac, pink) and FOXA2 (gut tube, blue) in day 4 EMLOC gastruloids provided as smoothed curves. Normalized fluorescence was plotted over the anterior-posterior(A-P) axis normalized distance. (C) Left: Immunofluorescence Z-slices of FOXA2 (cyan)/Ki67 (magenta) depicts primitive foregut (fg) relative to cardiogenic region in day 5 versus day 6 EMLOC gastruloids. Right: CDH1/E-Cadherin depicts primitive gut tube (red) positioning relative to cTnT+ cardiogenic region (magenta). Cells are counterstained with DAPI. (D) Immunofluorescence Z-slices of GATA6 (cyan)/type 1 collagen (Col1, magenta) depicts primitive gut tube relative to cardiogenic region during chamber precursor formation in day 5 (left) versus day 6 (right) EMLOC gastruloids. (E) cTnT (magenta) and CDH2/N-Cadherin (cyan) co-localization in cardiac crescent reveals epithelization of cardiomyocyte progenitors. Inset depicts cTnT+ without pseudocolor. Yellow arrows depict striations. High magnification images with and without DAPI are provided (right) at the boundary of the EMLOC cardiogenic region. Individual scale bars provided.
Figure 5
Figure 5
Myocardial expansion and heart tube morphogenetic specialization (A) Cartoon schematic of cardiogenesis from cardiac crescent to heart tube specialization and heart tube looping. Truncus arteriosus (TA), sinus venosus (SV). (B) Heart tube staging in day 7 EMLOC gastruloids by cTnT (magenta) and TUJ1 (red), corresponding to the boxed stage in (A). Maximally projected Z-stacks and single Z-slice is shown. (C) 3D reconstruction of the anterior cardiac region with cTnT (magenta) and DAPI (gray) depicting putative outflow tract (yellow arrows) and chambers in two EMLOC gastruloids. (D) Multi-dimensional visualization of cTnT (magenta) and DAPI (gray). Sagittal and transverse planes are shown. Individual scale bars provided. Asterisks (∗) indicate communication with proximal EMLOC compartment. Individual scale bars provided.
Figure 6
Figure 6
Chamber precursor morphogenesis in EMLOCs (A) Cartoon schematic of a developing heart tube. Chamber wall layers are expanded to depict myocardium, extracellular matrix-rich cardiac jelly, and endocardium interior lining. (B) 3D reconstruction of the anterior cardiac chamber-like structures with cTnT+ myocardium (magenta) and Laminin+ interior (top-left). Single Z-slice multi-dimensional view of chamber (top-right). High magnification images are provided below. (C) VCAN, ADAMTS1, ANGPT1 genes involved in cardiac jelly and its spatiotemporal degradation in day 16 EMLOC by scRNAseq, visualized using PHATE. (D) Immunofluorescence of cTnT, GATA4 and DAPI demonstrating putative outflow tract (white arrows) in two day 7 EMLOCs. Z-slice inset provides a second example. (E) Immunofluorescence of N-Cadherin (CDH2, cyan), VE-Cadherin (vascular endothelial cadherin/CD144/CDH5, magenta), and DAPI (gray) depicting endothelial biomarker expression lining the putative outflow tract. Individual scale bars provided. (F) Biomarkers for smooth muscle cells (CNN1/TAGLN) and the outflow tract (ISL1/PDE5A/CDH11) along with vascular endothelial cells (KDR/FLT1/ESAM/CDH5) (cluster 9). (G) POSTN, TBX3, NPR3, NFATC4 genes involved in atrioventricular valve formation.
Figure 7
Figure 7
Neuron co-development and population of the cardiac region (A) Neural rosette biomarkers SOX2 (cyan) and TUJ1 (red) emerging posteriorly in day 7H3.1.1 EMLOC, counterstained with DAPI. (B and C) SOX2+ rosette and neurogenesis (TUJ1) counterstained with DAPI along with high magnification (C). Inset is whole EMLOC. (D) Immunofluorescence of cTnT (cyan) and TUJ1 (red) depicting single neuron in day 8 EMLOC (left, white dotted box) and zoom in (middle panel). Comparison with TUJ1+ neuron tract in day 18 EMLOC (far right panel). (E) Absolute number of TUJ1+ cells in day 7 versus day 18 EMLOCs (n = 10 per time point). ∗∗∗∗p < 0.0001, t = 8.929, df = 18 by unpaired two-tailed t-test. (F) Proportion of EMLOCs with TUJ1+ neuronal fibers distributed within the cardiac region at day 7 versus day 18 (N = 4 replicate experiments; day 7: 3.3 ± 1.9% of population; day 25: 55.8 ± 2.9; ∗∗p = 0.0011, t = 12.58, df = 3 by paired two-tailed t-test). (G) Nidus of neurogenesis posterior to gut tube endodermal cells and cardiogenic region in day 8 EMLOC by TUJ1 (red), GATA6 (cyan), and cTnT (magenta). Maximally projected z stack (Z-total) and single Z-slice shown. White arrows point to communicating channels. Gut tube endoderm is laminated whereas neural rosettes are continuous with surrounding GATA6+ cells. (H) Left: UMAP representation of day 16 EMLOC scRNAseq highlighting trunk neural progenitors (ZIC1/RFX4), sympathetic neurogenesis (INSM1/ISL1) and Schwann cell glia (SOX10/PLP1). Right: quantification of neuronal class proportions in clusters 1, 8, 10 as autonomic (ASCL1 62%, PHOX2B 9%), sensory (POU4F1 25%) and motor (MNX1 4%). (I) Genes in the cardiogenic region involved in neuronal patterning and innervation.NPY, BDNF, SEMA3A, PRPH, EDNRA, ISL1 shown by UMAP (day 16). (J) Phase contrast image of contractile EMLOC chamber-like structures (see also Video S5). (K) 3D reconstruction of TUJ1+ neuronal fiber intercalation with chamber-like myocardium in day 25 EMLOC (see also Video S6). Rotated view is shown. Individual scale bars provided. Data are reported as mean ±SEM.

References

    1. Andersen P., Tampakakis E., Jimenez D.V., Kannan S., Miyamoto M., Shin H.K., Saberi A., Murphy S., Sulistio E., Chelko S.P., et al. Precardiac organoids form two heart fields via Bmp/Wnt signaling. Nat. Commun. 2018;9:3140. doi: 10.1038/s41467-018-05604-8. - DOI - PMC - PubMed
    1. Anderson C., Khan M.A.F., Wong F., Solovieva T., Oliveira N.M.M., Baldock R.A., Tickle C., Burt D.W., Stern C.D. A strategy to discover new organizers identifies a putative heart organizer. Nat. Commun. 2016;7:12656. doi: 10.1038/ncomms12656. - DOI - PMC - PubMed
    1. Ashton J.L., Burton R.A.B., Bub G., Smaill B.H., Montgomery J.M. Synaptic plasticity in cardiac innervation and its potential role in atrial fibrillation. Front. Physiol. 2018;9:240. doi: 10.3389/fphys.2018.00240. - DOI - PMC - PubMed
    1. Asp M., Giacomello S., Larsson L., Wu C., Fürth D., Qian X., Wärdell E., Custodio J., Reimegård J., Salmén F., et al. A spatiotemporal organ-wide gene expression and cell atlas of the developing human heart. Cell. 2019;179:1647–1660.e19. doi: 10.1016/j.cell.2019.11.025. - DOI - PubMed
    1. Beccari L., Moris N., Girgin M., Turner D.A., Baillie-Johnson P., Cossy A.-C., Lutolf M.P., Duboule D., Arias A.M. Multi-axial self-organization properties of mouse embryonic stem cells into gastruloids. Nature. 2018;562:272–276. doi: 10.1038/s41586-018-0578-0. - DOI - PubMed

LinkOut - more resources