. 2022 May 26:66.
doi: 10.29219/fnr.v66.8289. eCollection 2022.

Capsaicin regulates lipid metabolism through modulation of bile acid/gut microbiota metabolism in high-fat-fed SD rats

Affiliations

Capsaicin regulates lipid metabolism through modulation of bile acid/gut microbiota metabolism in high-fat-fed SD rats

Ting Gong et al. Food Nutr Res. .

Abstract

Capsaicin (CAP) is one of the active ingredients found in chili peppers and has been shown to reduce fat. This study aimed to explore the mechanisms of CAP activity by investigating intestinal microorganisms and bile acids (BAs). This study utilized 16S RNA sequencing to detect gut microbiota in cecal contents, and BAs in Sprague Dawley (SD) rats were also investigated. The results showed that 1) CAP increased the levels of chenodeoxycholic acid (CDCA), deoxycholic acid (DCA), β-muricholic acid (β-MCA), and tauro-β-muricholic acid sodium salt (T-β-MCA), which can regulate farnesoid X receptor (FXR) to inhibit Fgf15, increased CYP7A1 expression to lower triglycerides (TG) and total cholesterol (TC); 2) CAP decreased the abundance of Firmicutes and promoted the presence of specific fermentative bacterial populations, like Akkermansia; meanwhile, less optimal dose can reduce Desulfovibrio; 3) CAP decreased inflammatory factors IL-6 and IL-1β, and increased transient receptor potential channel of vanilloid subtype 1 (TRPV1) to regulate lipid metabolism, fasting plasma glucose and insulin resistance. In conclusion, CAP can reduce fat accumulation by regulating BAs, microorganisms, and short-chain fatty acids.

Keywords: bile acid; capsaicin; gut microbiota; high-fat diet; metabolism.


Conflict of interest statement

All authors declare that they have no conflict of interest. The authors have not received any funding or benefits from industry or elsewhere to conduct this study

Figures

Fig. 1
Fig. 1
(A) Weight gain of SD rats fed with different doses of CAP and a high-fat diet. (B) Liver weight of SD rats fed with different doses of CAP and a high-fat diet. (C) Food intake of SD rats fed with different doses of CAP and a high-fat diet. (D) Intake of SD rats fed with different doses of CAP and a high-fat diet. Values are expressed as mean ± SD (n = 8). (a) HF group versus HFL group; (b) NC group versus HFL group; (c) HF group versus HFM group; (d) NC group versus HFM group; (e) NC group versus HF group (one-way ANOVA followed by Dunnett’s test, P < 0.05). NC group: control group; HF group: high-fat diet group; HFL group: high-fat diet treated with suboptimal dose of CAP; HFM group: high-fat diet treated with optimal dose of CAP.
Fig. 2
Fig. 2
(A, B). Levels of plasma inflammatory factors for different doses of CAP in SD rats fed a high-fat diet. (A) Concentrations of serum IL-6. (B) Concentrations of serum IL-1β. Values are expressed as mean ± SD (n = 8). (a) HF group versus HFL group; (b) NC group versus HFL group; (c) HF group versus HFM group; (d) NC group versus HFM group; (e) NC group versus HF group (one-way ANOVA followed by Dunnett’s test, P < 0.05). NC group: control group; HF group: high-fat diet group; HFL group: high-fat diet treated with suboptimal dose of CAP; HFM group: high-fat diet treated with optimal dose of CAP.
Fig. 3
Fig. 3
(A) Principal component analysis (PCA) at OTU level; (B) Shannon index at OTU level. (C) Bray–Curtis distance at OTU level. (D) Phylum-level bar plot and differences in relative abundance of microorganisms at the phylum level. (E) Genus-level bar plot and differences in relative abundance of the first 20 species of microorganisms. (a) HF group versus HFL group; (b) NC group versus HFL group; (c) HF group versus HFM group; (d) NC group versus HFM group; (e) NC group versus HF group (one-way ANOVA followed by Dunnett’s test, P < 0.05). NC group: control group; HF group: high-fat diet group; HFL group: high-fat diet treated with suboptimal dose of CAP; HFM group: high-fat diet treated with optimal dose of CAP.
Fig. 4
Fig. 4
(A) FXR antagonist/agonist BAs in the intestinal microflora were calculated. (B) Total concentration of BAs in plasma. Values are expressed as mean ± SD (n = 8). (a) HF group versus HFL group; (b) NC group versus HFL group; (c) HF group versus HFM group; (d) NC group versus HFM group; (e) NC group versus HF group (one-way ANOVA followed by Dunnett’s test, P < 0.05). NC group: control group; HF group: High fat diet group; HFL group: high-fat diet treated with suboptimal dose of CAP; HFM group: high-fat diet treated with optimal dose of CAP. (C) Pearson correlation heatmap between key gut microbial taxa and BA profiles. Red color denotes a positive association, blue denotes a negative association, and white denotes no association. Data are expressed as mean ± SD. One-way ANOVA with Bonferroni post hoc test was used for data analysis. *P < 0.05.
Fig. 5
Fig. 5
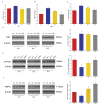
(A, B) FXR and Fgf15 mRNA expression in the colon of SD rats fed a high-fat diet was measured using qRT-PCR to explore the effect of different doses of CAP. (C) The concentration of Fgf15 in plasma to explore the effect of different doses of CAP. (D) Western blotting was used to detect FXR expression in the liver of SD rats and the relative protein expression levels were quantified by densitometry. (E) Western blotting was used to detect CYP7A1 expression in the liver of SD rats, and the relative protein expression levels were quantified by densitometry. (F) Western blotting was used to detect TRPV1 expression in the liver of SD rats, and the relative protein expression levels were quantified by densitometry. Values are expressed as mean ± SD (n = 8). (a) HF group versus HFL group; (b) NC group versus HFL group; (c) HF group versus HFM group; (d) NC group versus HFM group; (e) NC group versus HF group (one-way ANOVA followed by Dunnett’s test, P < 0.05). NC group: control group; HF group: high-fat diet group; HFL group: high-fat diet treated with suboptimal dose of CAP; HFM group: high-fat diet treated with optimal dose of CAP.
None

References

    1. Ley RE, Hamady M, Lozupone C, Turnbaugh PJ, Ramey RR, Bircher JS, et al. . Evolution of mammals and their gut microbes. Science 2008; 320: 1647–51. doi: 10.1126/science.1155725 - DOI - PMC - PubMed
    1. Li X, Guo J, Ji K, Zhang P. Bamboo shoot fiber prevents obesity in mice by modulating the gut microbiota. Sci Rep 2016; 6: 32953. doi: 10.1038/srep32953 - DOI - PMC - PubMed
    1. Martinez KB, Leone V, Chang EB. Microbial metabolites in health and disease: navigating the unknown in search of function. J Biol Chem 2017; 292: 8553–9. doi: 10.1074/jbc.R116.752899 - DOI - PMC - PubMed
    1. Yadav M, Verma MK, Chauhan NS. A review of metabolic potential of human gut microbiome in human nutrition. Archiv Microbiol 2018; 200: 203–17. doi: 10.1007/s00203-017-1459-x - DOI - PubMed
    1. Li JM, Li LY, Xuan Q, Pascal D, Laurent D, Limbu SM, et al. . Inhibited carnitine synthesis causes systemic alteration of nutrient metabolism in zebrafish. Front Physiol 2018; 9: 509. doi: 10.3389/fphys.2018.00509 - DOI - PMC - PubMed