. 2022 May 26:9:890799.
doi: 10.3389/fcvm.2022.890799. eCollection 2022.

Morphological and Physiological Characteristics of Ruptured Plaques in Native Arteries and Neoatherosclerotic Segments: An OCT-Based and Computational Fluid Dynamics Study

Affiliations

Morphological and Physiological Characteristics of Ruptured Plaques in Native Arteries and Neoatherosclerotic Segments: An OCT-Based and Computational Fluid Dynamics Study

Chongying Jin et al. Front Cardiovasc Med. .

Abstract

Background: Intravascular imaging has been used to assess the morphology of lesions causing an acute coronary syndrome (ACS) in native vessels (NV) and identify differences between plaques that ruptured (PR) and caused an event and those that ruptured without clinical manifestations. However, there is no data about the morphological and physiological characteristics of neoatherosclerotic plaques that ruptured (PR-NA) which constitute a common cause of stent failure.

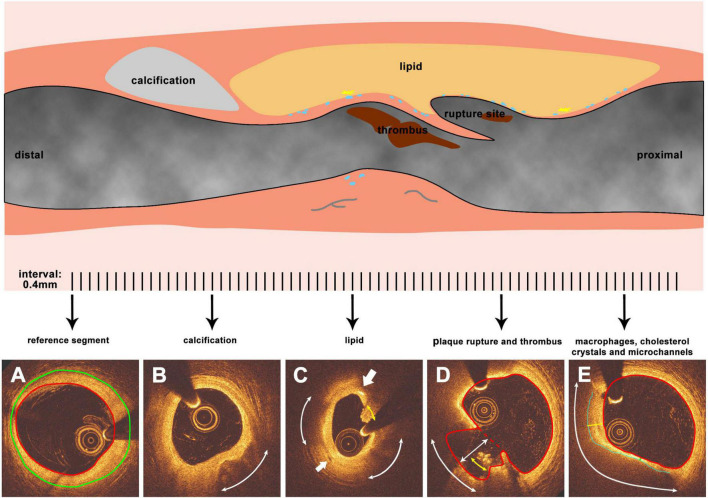
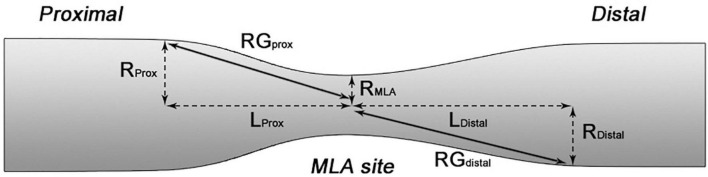
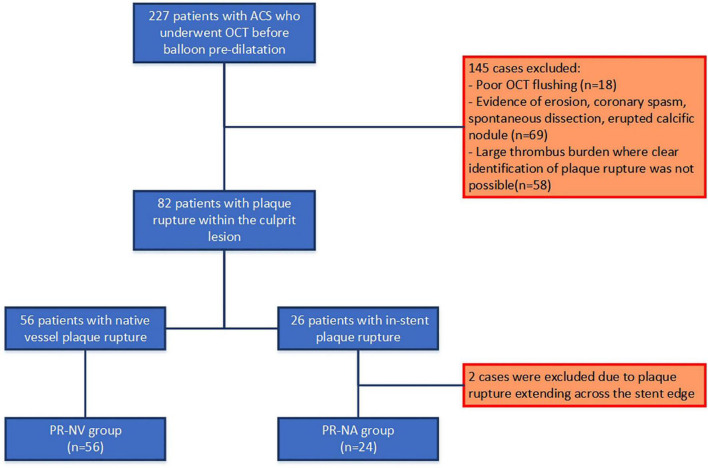
Methods: We retrospectively analyzed data from patients admitted with an acute myocardial infarction that had optical coherence tomography (OCT) imaging of the culprit vessel before balloon pre-dilation. OCT pullbacks showing PR were segmented at every 0.4 mm. The extent of the formed cavity, lipid and calcific tissue, thrombus, and macrophages were measured, and the fibrous cap thickness (FCT) and the incidence of micro-channels and cholesterol crystals were reported. These data were used to reconstruct a representative model of the native and neoatherosclerotic lesion geometry that was processed with computational fluid dynamics (CFD) techniques to estimate the distribution of the endothelial shear stress and plaque structural stress.

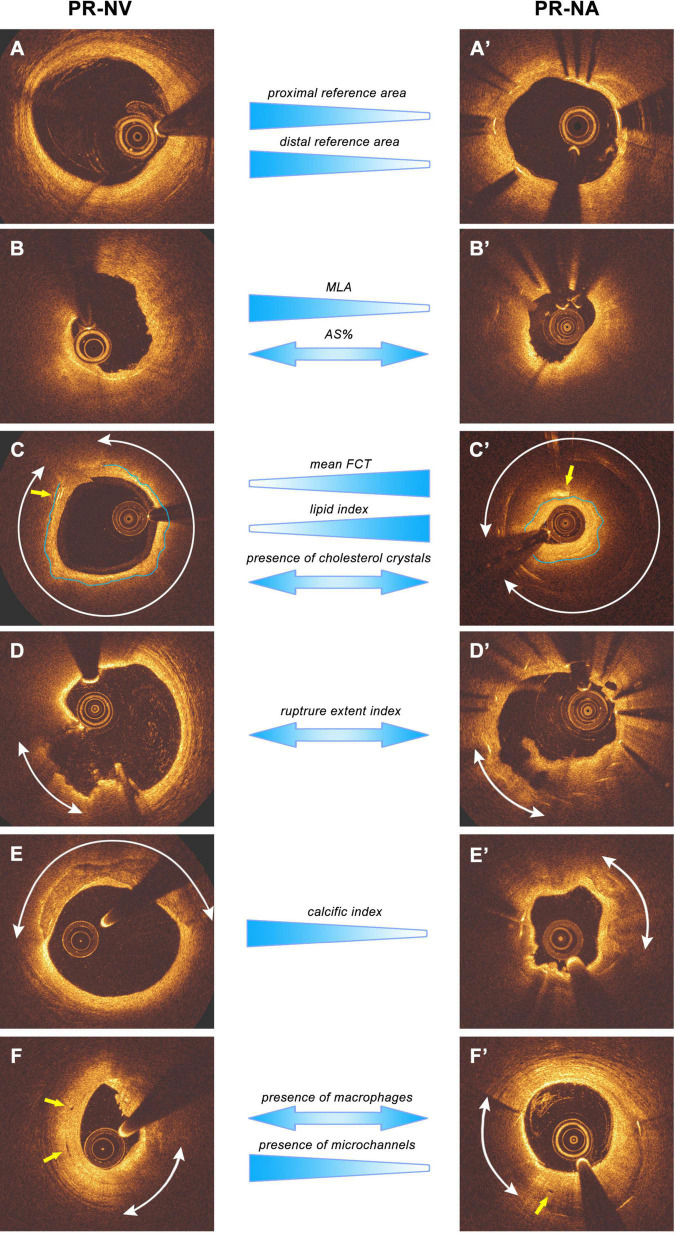
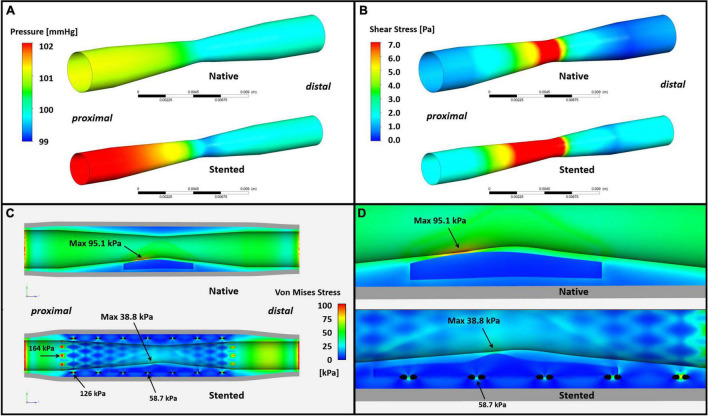
Result: Eighty patients were included in the present analysis: 56 had PR in NV (PR-NV group) and 24 in NA segments (PR-NA group). The PR-NV group had a larger minimum lumen area (2.93 ± 2.03 vs. 2.00 ± 1.26 mm2, p = 0.015) but similar lesion length and area stenosis compared to PR-NA group. The mean FCT (186 ± 65 vs. 232 ± 80 μm, p = 0.009) and the lipid index was smaller (16.7 ± 13.8 vs. 25.9 ± 14.1, p = 0.008) while the of calcific index (8.3 ± 9.5 vs. 2.2 ± 1.6%, p = 0.002) and the incidence of micro-channels (41.4 vs. 12.5%, p = 0.013) was higher in the PR-NV group. Conversely, there was no difference in the incidence of cholesterol crystals, thrombus burden or the location of the rupture site between groups. CFD analysis revealed higher maximum endothelial shear stress (19.1 vs. 11.0 Pa) and lower maximum plaque structural stress (38.8 vs. 95.1 kPa) in the PR-NA compared to the PR-NV model.

Conclusion: We reported significant morphological and physiological differences between culprit ruptured plaques in native and stented segments. Further research is needed to better understand the causes of these differences and the mechanisms regulating neoatherosclerotic lesion destabilization.

Keywords: computational fluid dynamics (CFD); endothelial shear stress; neoatherosclerosis; optical coherence tomography; plaque rupture; plaque structural stress.


Conflict of interest statement

The authors declare that the research was conducted in the absence of any commercial or financial relationships that could be construed as a potential conflict of interest.

Figures

FIGURE 1
FIGURE 1
Representative images and methodology of OCT morphology analysis. The upper part is a representative longitudinal diagram of a ruptured plaque (blue dots represent for macrophages while yellow sharp stars for cholesterol crystals, gray curved lines for microchannels), panels (A–E) are cross sections corresponding to the lesion segment while analyzed at 0.4 mm interval. (A) The reference segment of the vessel, red line indicates the lumen surface while green line indicates the EEM. (B) Calcification tissue in the plaque, the arc indicates the calcific arc. (C) Lipid tissue in the plaque, the arc indicates the lipid arc, the area enclosed by the blue line indicates the fibrous cap. Yellow and green lines which are vertical to the lumen border are maximum and minimal cap thickness respectively. (D) Plaque rupture and thrombus. Red line represents the lumen surface while red dash line indicates the lumen surface before plaque rupture. The white arc represent rupture circumferential extend, while yellow arc indicates thrombus circumferential distribution for generating the thrombus score. Line with arrowheads represents the depth of rupture. (E) Macrophages, cholesterol crystals, and microchannels. The bigger arrow points to the cholesterol crystals while the smaller arrow points to the microchannel. Arcs indicate the arc of macrophages.
FIGURE 2
FIGURE 2
Schematic diagram showing the calculation of RG RGprox = (RProx-RMLA)/LProx while RGdistal = (RDistal-RMLA)/LDistal.
FIGURE 3
FIGURE 3
Study flowchart.
FIGURE 4
FIGURE 4
Main results of lesion level-analysis and representative images. The images are presented as pairs from PR-NV and PR-NA groups. (A,A′) The reference segment, PR-NV group had larger proximal and distal reference area. (B,B′) The MLA site, PR-NV group reveals larger MLA than PR-NA group, while the two groups have similar AS%. (C,C′) Typical fibroatheroma and cholesterol crystals images, arcs indicate the lipid tissue while the yellow arrows are pointing at the cholesterol crystals. Blue lines draw the fibrous cap. PR-NV group reveals smaller mean FCT and lipid index, but similar incidence of cholesterol crystals compares to PR-NA group. (D,D′) Representative plaque rupture images, arcs indicate the ruptured cavity, PR-NV group reveals similar rupture extend index with PR-NA group. (E,E′) Typical calcification images. Arcs indicate the calcific tissue, PR-NV groups had bigger calcific index than PR-NA group. (F,F′) Macrophages and microchannels. Yellow arrows are pointing to the microchannels while arcs indicate the macrophages. PR-NV group has similar incidence of macrophages but more incidence of microchannels than PR-NA group.
FIGURE 5
FIGURE 5
Computational physiological analysis results. (A) The pressure drop across the model is 0.95 and 2.03 mmHg for native and stented vessel, respectively. (B) ESS distribution of the vessel. The stented model reveals higher maximum and minimum ESS value (19.1 vs. 11.0 Pa and 0.32 vs. 0.04 Pa, respectively). The maximum ESS value was located main at the MLA in both two models and 28.5% of the culprit lesion model in the stented segment and 9.0% of the culprit lesion model in NV was exposed to high ESS (>7 Pa). (C,D) PSS analysis results. The maximum superficial PSS in both models were over the thinner segment of the fibrous cap proximally to the MLA and was 95.1 kPa in the native and 38.8 kPa in the stented segment. A total of 95.1 kPa was also the maximum PSS value of the native model while in the stented model the highest PSS was 58.7 kPa in the vicinity of stent struts.

References

    1. Boden WE, O’Rourke RA, Teo KK, Hartigan PM, Maron DJ, Kostuk WJ, et al. Optimal medical therapy with or without PCI for stable coronary disease. N Engl J Med. (2007) 356:1503–16. 10.1056/NEJMoa070829 - DOI - PubMed
    1. Dalby M, Bouzamondo A, Lechat P, Montalescot G. Transfer for primary angioplasty versus immediate thrombolysis in acute myocardial infarction: a meta-analysis. Circulation. (2003) 108:1809–14. 10.1161/01.CIR.0000091088.63921.8C - DOI - PubMed
    1. Fox KA, Clayton TC, Damman P, Pocock SJ, de Winter RJ, Tijssen JG, et al. Long-term outcome of a routine versus selective invasive strategy in patients with non-ST-segment elevation acute coronary syndrome a meta-analysis of individual patient data. J Am Coll Cardiol. (2010) 55:2435–45. 10.1016/j.jacc.2010.03.007 - DOI - PubMed
    1. Otsuka F, Byrne RA, Yahagi K, Mori H, Ladich E, Fowler DR, et al. Neoatherosclerosis: overview of histopathologic findings and implications for intravascular imaging assessment. Eur Heart J. (2015) 36:2147–59. 10.1093/eurheartj/ehv205 - DOI - PubMed
    1. Joner M, Koppara T, Byrne RA, Castellanos MI, Lewerich J, Novotny J, et al. Neoatherosclerosis in patients with coronary stent thrombosis: findings from optical coherence tomography imaging (A Report of the PRESTIGE Consortium). JACC Cardiovasc Interv. (2018) 11:1340–50. 10.1016/j.jcin.2018.02.029 - DOI - PubMed