Review
. 2022 Jun 2:13:889643.
doi: 10.3389/fmicb.2022.889643. eCollection 2022.

A Tale of Three Recent Pandemics: Influenza, HIV and SARS-CoV-2

Affiliations
Review

A Tale of Three Recent Pandemics: Influenza, HIV and SARS-CoV-2

Mafalda N S Miranda et al. Front Microbiol. .

Abstract

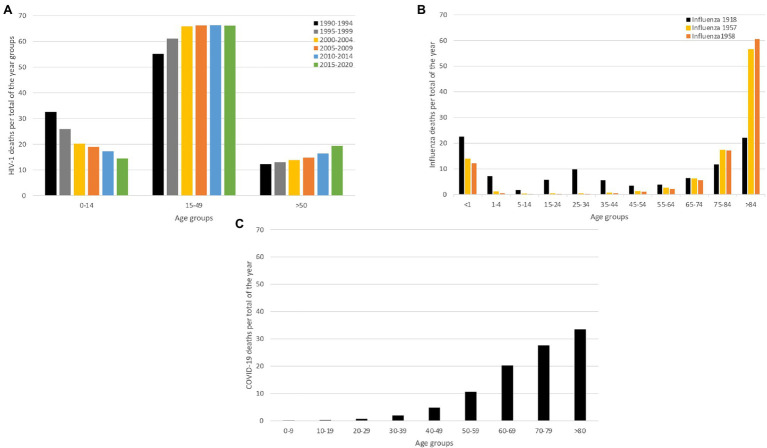
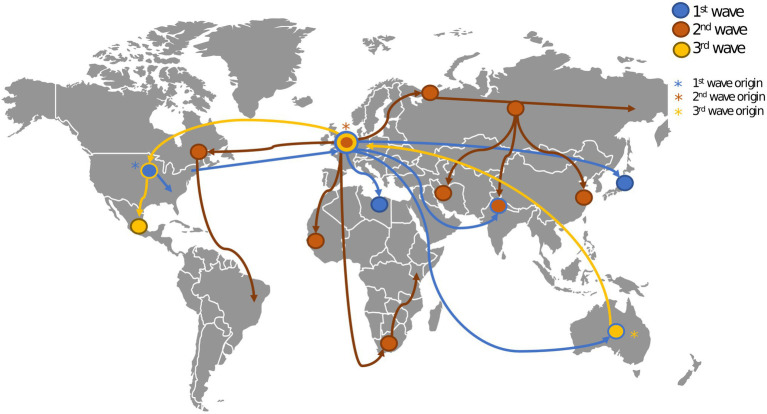
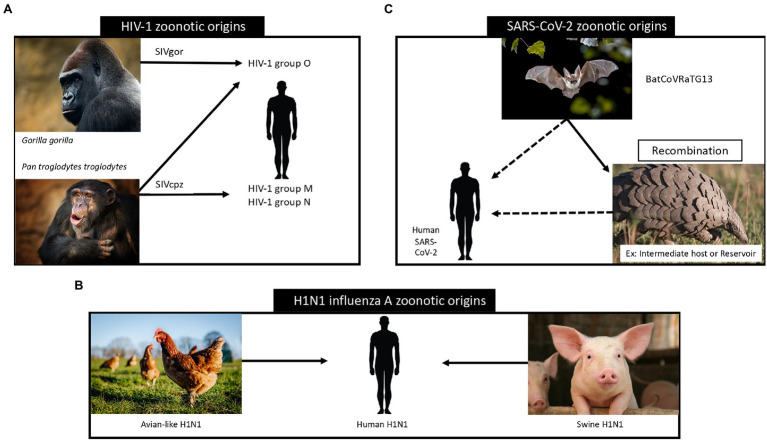
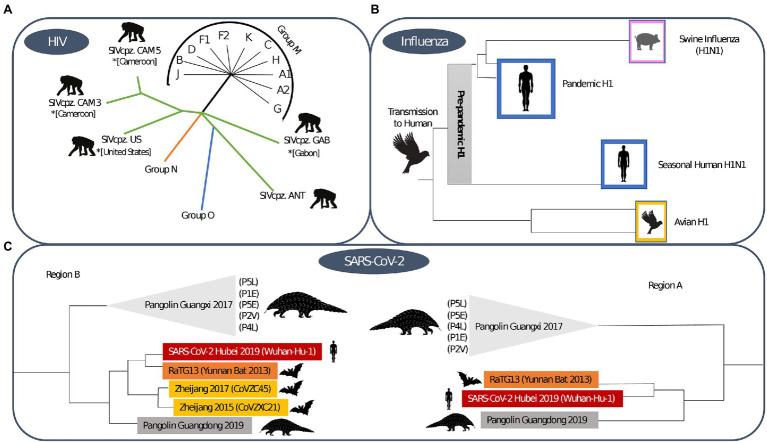
Emerging infectious diseases are one of the main threats to public health, with the potential to cause a pandemic when the infectious agent manages to spread globally. The first major pandemic to appear in the 20th century was the influenza pandemic of 1918, caused by the influenza A H1N1 strain that is characterized by a high fatality rate. Another major pandemic was caused by the human immunodeficiency virus (HIV), that started early in the 20th century and remained undetected until 1981. The ongoing HIV pandemic demonstrated a high mortality and morbidity rate, with discrepant impacts in different regions around the globe. The most recent major pandemic event, is the ongoing pandemic of COVID-19, caused by the severe acute respiratory syndrome coronavirus 2 (SARS-CoV-2), which has caused over 5.7 million deaths since its emergence, 2 years ago. The aim of this work is to highlight the main determinants of the emergence, epidemic response and available countermeasures of these three pandemics, as we argue that such knowledge is paramount to prepare for the next pandemic. We analyse these pandemics' historical and epidemiological contexts and the determinants of their emergence. Furthermore, we compare pharmaceutical and non-pharmaceutical interventions that have been used to slow down these three pandemics and zoom in on the technological advances that were made in the progress. Finally, we discuss the evolution of epidemiological modelling, that has become an essential tool to support public health policy making and discuss it in the context of these three pandemics. While these pandemics are caused by distinct viruses, that ignited in different time periods and in different regions of the globe, our work shows that many of the determinants of their emergence and countermeasures used to halt transmission were common. Therefore, it is important to further improve and optimize such approaches and adapt it to future threatening emerging infectious diseases.

Keywords: HIV-1; SARS-CoV-2; infectious diseases; influenza; pandemics.


Conflict of interest statement

The authors declare that the research was conducted in the absence of any commercial or financial relationships that could be construed as a potential conflict of interest.

Figures

Figure 1
Figure 1
Mortality caused by HIV-1, Influenza and COVID-19. We compare mortality between two acute infectious diseases (SARS-CoV-2 and influenza pandemic) and a chronic infectious disease (HIV), to demonstrate that their impact on mortality is inherently different. For all the infectious diseases, we show deaths proportional to age (panels A–C). (A) Age-proportional deaths divided into six time-periods grouped by 4 years (1990–1994; 1995–1999; 2000–2004; 2005–2009; 2010–2014 and 2015–2020), to show the age-specific mortality evolution over the years (UNAIDS, 2022). (B) Influenza age-proportional deaths for three major influenza pandemics (1918, 1957 and 1958), to show age-specific mortality patterns over the different influenza pandemics (Luk et al., 2001). (C) Age-proportional COVID-19 deaths for the first year of the pandemic (2020), when only non-pharmaceutical interventions were available (Riffe et al., 2021). This panel demonstrates how COVID-19 deaths exponentially increase by age.
Figure 2
Figure 2
Geospatial spread of influenza during the 1918 pandemic. This figure shows the origin (marked with asterisks) and spread (marked with edges) of the three waves of the 1918 influenza pandemic (Earth.Org, 2022). The first wave originated in the United States (US). and spread throughout Europe and the rest of the world. The second wave originated in Europe and spread through the US, Europe, Asia and Africa. The third wave originated in Australia and spread through Europe and the US.
Figure 3
Figure 3
Zoonotic origins of HIV-1 (panel A; Tebit and Arts, 2011), influenza (panel B; Taubenberger and Morens, 2006) and SARS-CoV-2 (panel C; Konda et al., 2020) viruses and their relation to human transmission. In panel A we show the zoonotic transmission of Simian immunodeficiency viruses (SIV) from non-human primates to humans, leading to the development of the human immunodeficiency virus. Panel B depicts the main zoonotic origins of influenza A H1N1 viruses and their transmission to human hosts. In panel C we visualize the assumed zoonotic origin of SARS-CoV-2 virus.
Figure 4
Figure 4
Phylogenetic trees for (A) HIV-1, (B) Influenza and (C) SARS-CoV-2. The HIV-1 phylogenetic tree shows sequences that demonstrate the zoonotic jump of the distinct HIV-1 groups (Thomson et al., 2002). The influenza phylogenetic tree was based on the H1 subtype, the initial origin of the 1918 pandemic and the post-pandemic spread through human and animal species (Xu et al., 2008). The SARS-CoV-2 phylogenetic tree shows the origin of sarbecovirus and is based on distinct regions, where region A is shorter due to the potential of recombination of the genome region and region B is wider (Boni et al., 2020).
Figure 5
Figure 5
Global evolution and chronology of events of spread of the HIV-1 group M subtypes (Tebit and Arts, 2011). We show how HIV-1 group M disseminated from its original epidemic location (Kinshasa, Democratic Republic of Congo) to other regions of the globe. The figure depicts how subtype B is the most widely spread subtype, subtype A spread mostly to the east regions of Africa, Europe and Asia and subtype C spread mostly through Brazil, South Africa and Southeast Asia.
Figure 6
Figure 6
Modelling impact on policy. Two extremes in model space: (A) an SIR compartment model, (C) and individual-based model. We show a meta population model (B), that is situated between the models in (A,C), in terms of complexity.

Similar articles

Cited by

References

    1. Abrams S., Wambua J., Santermans E., Willem L., Kuylen E., Coletti P., et al. . (2021). Modelling the early phase of the Belgian COVID-19 epidemic using a stochastic compartmental model and studying its implied future trajectories. Epidemics 35:100449. doi: 10.1016/j.epidem.2021.100449, PMID: - DOI - PMC - PubMed
    1. Ahsan W., Javed S., Al B. M., Alhazmi H. A., Najmi A. (2020). Treatment of SARS-CoV-2: how far have we reached? Drug Discov. Ther. 14, 67–72. doi: 10.5582/ddt.2020.03008, PMID: - DOI - PubMed
    1. Aidsmap (2021). mRNA vaccine protects monkeys against HIV-like virus | aidsmap [Internet]. Available at: https://www.aidsmap.com/news/mar-2021/mrna-vaccine-protects-monkeys-agai... (Accessed July 29, 2021).
    1. Alcantara L. C. J., Cassol S., Libin P., Deforche K., Pybus O. G., Van Ranst M., et al. . (2009). A standardized framework for accurate, high-throughput genotyping of recombinant and non-recombinant viral sequences. Nucleic Acids Res. 37, W634–W642. doi: 10.1093/nar/gkp455, PMID: - DOI - PMC - PubMed
    1. Allen T., Murray K. A., Zambrana-Torrelio C., Morse S. S., Rondinini C., Di Marco M., et al. . (2017). Global hotspots and correlates of emerging zoonotic diseases. Nat. Commun. 8:1124. doi: 10.1038/s41467-017-00923-8, PMID: - DOI - PMC - PubMed