. 2022 Jul 8;131(2):151-164.
doi: 10.1161/CIRCRESAHA.122.320785. Epub 2022 Jun 20.

Epicardial HDAC3 Promotes Myocardial Growth Through a Novel MicroRNA Pathway

Affiliations

Epicardial HDAC3 Promotes Myocardial Growth Through a Novel MicroRNA Pathway

Jihyun Jang et al. Circ Res. .

Abstract

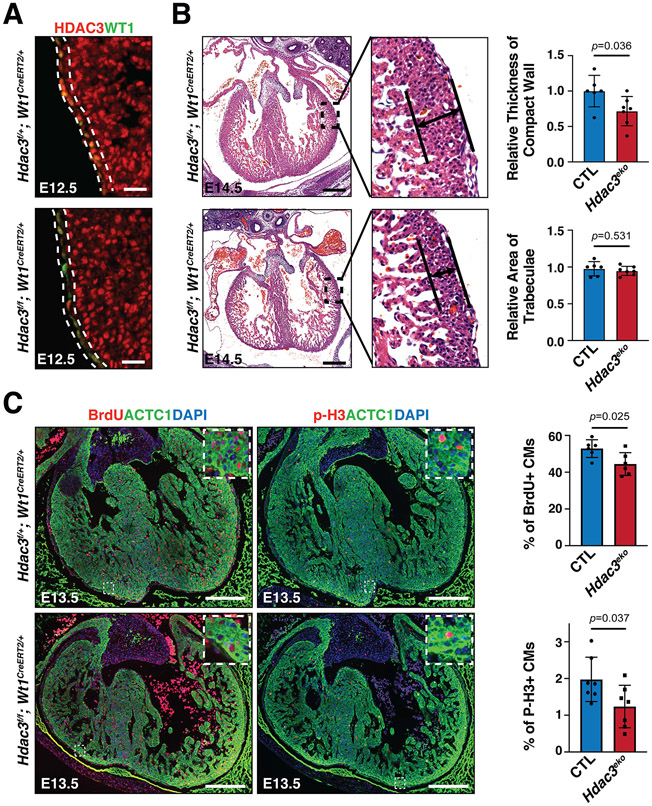
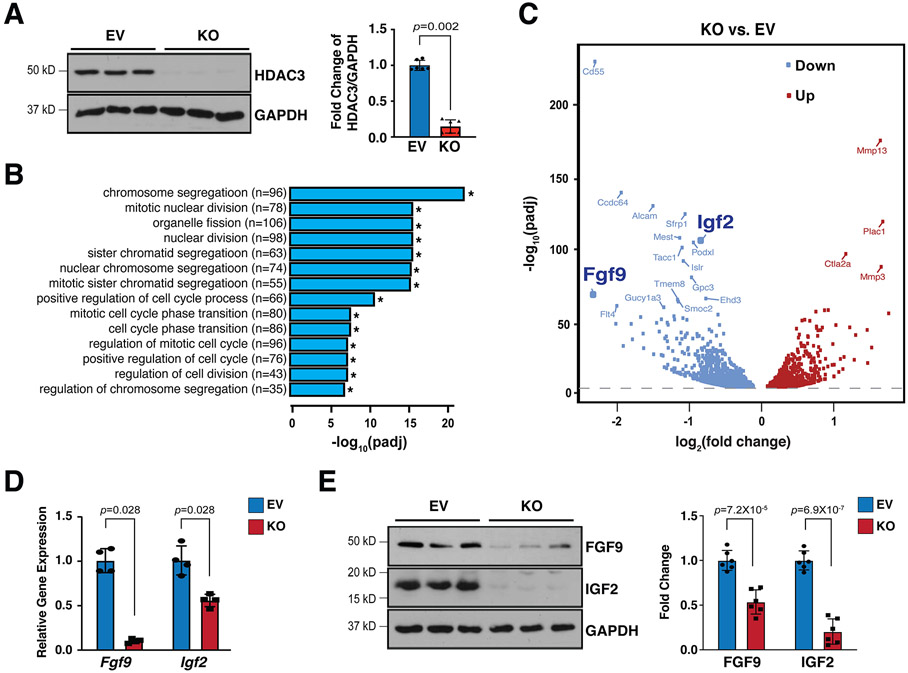
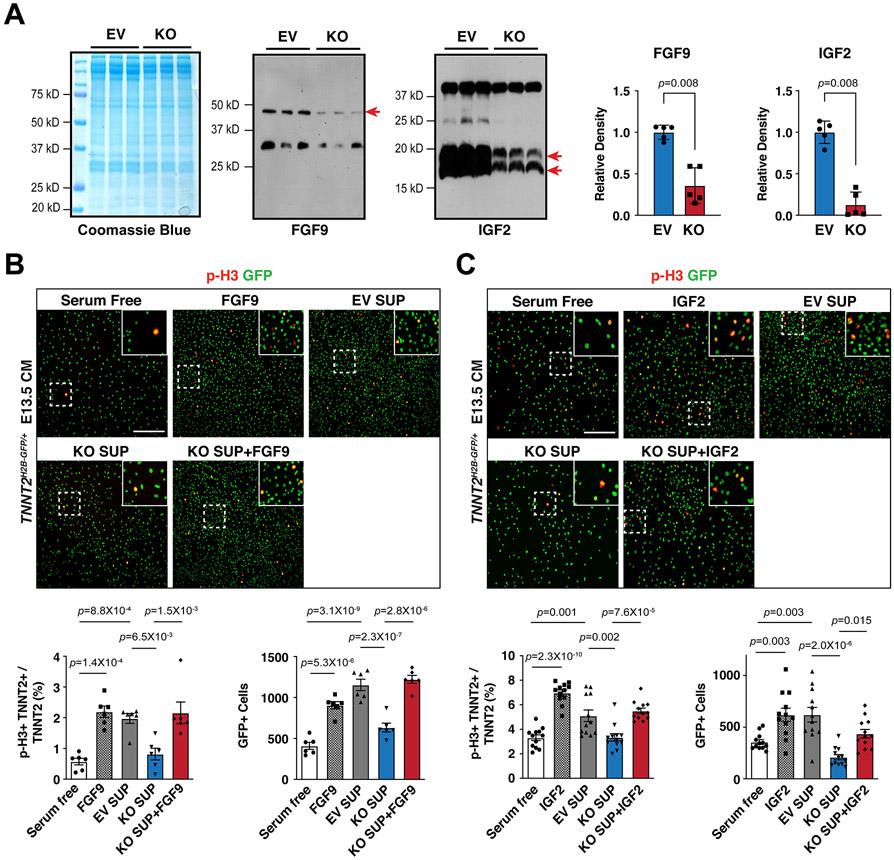
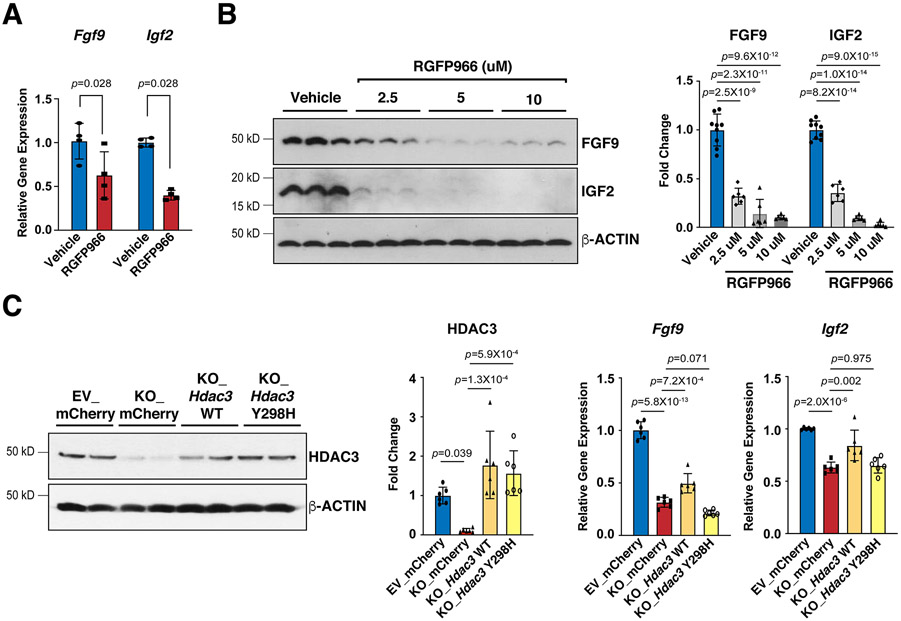
Background: Establishment of the myocardial wall requires proper growth cues from nonmyocardial tissues. During heart development, the epicardium and epicardium-derived cells instruct myocardial growth by secreting essential factors including FGF (fibroblast growth factor) 9 and IGF (insulin-like growth factor) 2. However, it is poorly understood how the epicardial secreted factors are regulated, in particular by chromatin modifications for myocardial formation. The current study is to investigate whether and how HDAC (histone deacetylase) 3 in the developing epicardium regulates myocardial growth.

Methods: Various cellular and mouse models in conjunction with biochemical and molecular tools were employed to study the role of HDAC3 in the developing epicardium.

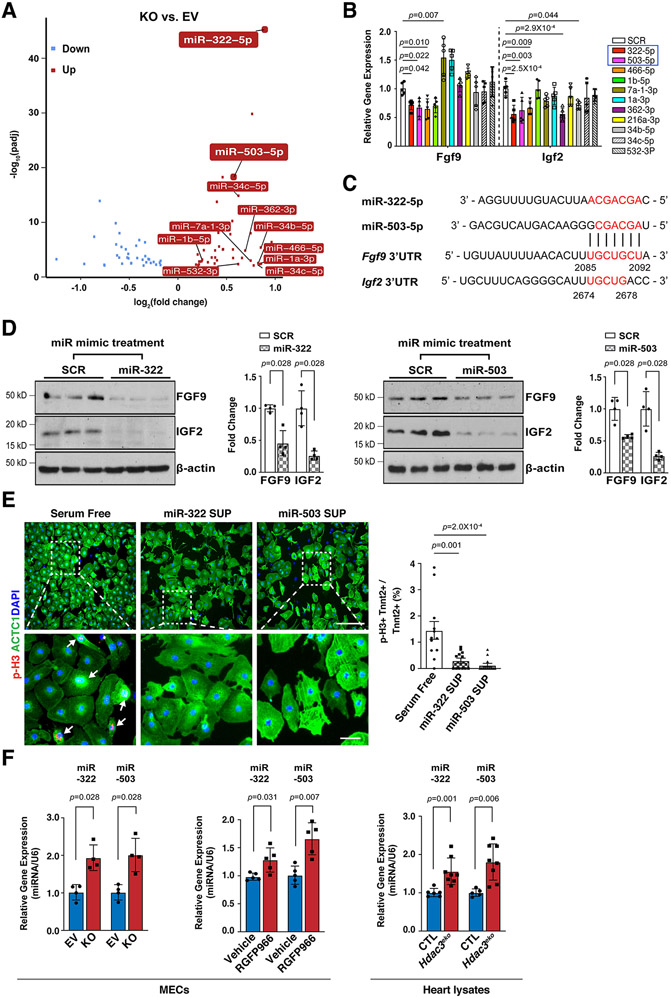
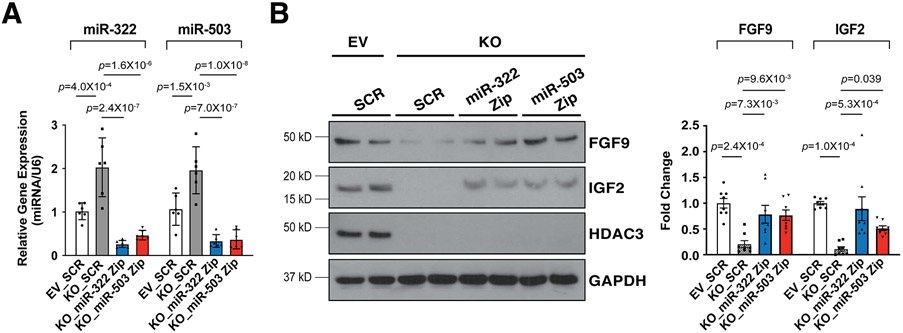
Results: We deleted Hdac3 in the developing murine epicardium, and mutant hearts showed ventricular myocardial wall hypoplasia with reduction of epicardium-derived cells. The cultured embryonic cardiomyocytes with supernatants from Hdac3 knockout (KO) mouse epicardial cells also showed decreased proliferation. Genome-wide transcriptomic analysis revealed that Fgf9 and Igf2 were significantly downregulated in Hdac3 KO mouse epicardial cells. We further found that Fgf9 and Igf2 expression is dependent on HDAC3 deacetylase activity. The supplementation of FGF9 or IGF2 can rescue the myocardial proliferation defects treated by Hdac3 KO supernatant. Mechanistically, we identified that microRNA (miR)-322 and miR-503 were upregulated in Hdac3 KO mouse epicardial cells and Hdac3 epicardial KO hearts. Overexpression of miR-322 or miR-503 repressed FGF9 and IGF2 expression, while knockdown of miR-322 or miR-503 restored FGF9 and IGF2 expression in Hdac3 KO mouse epicardial cells.

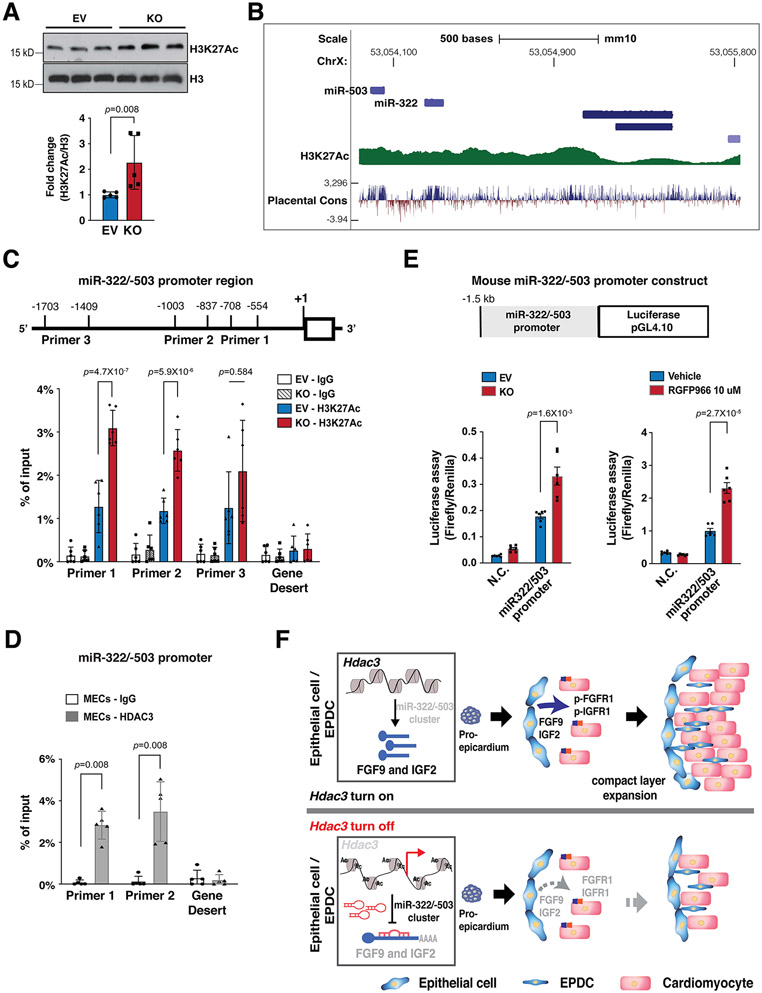
Conclusions: Our findings reveal a critical signaling pathway in which epicardial HDAC3 promotes compact myocardial growth by stimulating FGF9 and IGF2 through repressing miR-322 or miR-503, providing novel insights in elucidating the etiology of congenital heart defects and conceptual strategies to promote myocardial regeneration.

Keywords: chromatin; cues; fetal heart; pericardium; transcriptome.


Figures

Figure 1.
Figure 1.. Epicardial deletion of Hdac3 resulted in hypoplasia of ventricular compact wall.
(A) Representative immunofluorescence staining of HDAC3 and WT1 in Hdac3eko (Hdac3f/f; Wt1CreERT2/+) hearts and control (CTL; Hdac3f/+; Wt1CreERT2/+) hearts. Tamoxifen was given to dams intraperitoneally (150 mg/kg body weight) at E8.5. Scale bars: 25 μm. (B) Representative H&E staining of Hdac3eko and CTL hearts. Scale bars: 250 μm. Quantification is shown on the right. CTL: n=6, Hdac3eko: n=7. The relative thickness of compact wall and the relative area of trabeculae for each sample was derived by dividing its actual measured thickness or trabecular area by the mean measured thickness or area value of the CTL group. (C) Representative immunofluorescence staining of BrdU and p-H3 in Hdac3eko hearts and CTL hearts. Scale bars: 250 μm. Quantification is shown on the right. For BrdU, CTL: n=6, Hdac3eko: n=6; For P-H3, CTL: n=7, Hdac3eko: n=7. P-values were determined by unpaired two tailed Student’s t-test for (B) and (C).
Figure 2.
Figure 2.. Hdac3 deletion resulted in downregulation of FGF9 and IGF2.
(A) Generation of Hdac3 knockout (KO) and empty vector control (EV) MECs by CRISPR/Cas9. Deletion of Hdac3 was verified by western blot. n=4 in each group. (B) Gene ontology (GO) pathway analyses and (C) Volcano plot of RNA Sequencing in Hdac3 KO and EV MECs. n=3 in each group. Log2 fold changes were calculated by RPKM (Reads per kilo base of transcript per million mapped reads) per gene in the KO group divided by the mean RPKM per gene in the EV group then followed by calculation of Log (fold change, 2). Significantly downregulated genes are shown in light blue, and significantly up-regulated genes are shown in red. Cut-off criteria: adjusted P-value<0.01. (D) Quantification of Fgf9 and Igf2 in Hdac3 KO MECs by qRT-PCR. Gapdh was used as cDNA loading control. n=4 in each group. (E) Quantification of FGF9 and IGF2 in Hdac3 KO and EV MECs by western blot. GAPDH was used as protein loading control. n=6 in each group. P-values were determined by the Mann-Whitney U test for (A), (D) and unpaired two tailed Student’s t-test for (E).
Figure 3.
Figure 3.. Supplementation of FGF9 or IGF2 rescues CM proliferation defects.
(A) Secretion of FGF9 and IGF2 from Hdac3 KO and EV MECs. Coomassie brilliant blue staining of total extracted proteins from supernatants served as protein loading controls. FGF9 and IGF2 in the MEC supernatants were detected by western blot. Arrows point to the target bands. Quantifications are shown on the right. n=5 in each group. (B and C) The effects of MEC supernatants and/or recombinant FGF9 or IGF2 on E13.5 Tnnt2nGFP/+ CM proliferation. Representative immunofluorescence micrographs are shown. Scale bars: 275 μm. Percentage of p-H3+ CMs and total number of CMs were quantitated. Independent samples: FGF9, n=6 in each group; IGF2, n=12 in each group. P-values were determined by the Mann-Whitney U test for (A) and One-way ANOVA followed by the Tukey post hoc test for (B) and (C).
Figure 4.
Figure 4.. HDAC3 induces the expression of FGF9 and IGF2 dependent on its deacetylase activity.
(A) Decease of Fgf9 and Igf2 mRNAs after RGFP966 (a selective Hdac3 inhibitor) treatment. MECs were treated with 10 uM RGFP966 or vehicle for 24 hours. mRNA levels were quantified by qRT-PCR. Gapdh was used as a cDNA loading control. Fgf9, n=4 in each group; Igf2, n=5 in each group. (B) Decease of FGF9 and IGF2 protein levels after RGFP966 treatment. MECs were treated with 2.5 uM (n=6), 5 uM (n=6) or 10 uM (n=6) RGFP966 or vehicle (n=9) for 24 hours. FGF9 and IGF2 were quantified by western blot. GAPDH was used as a protein loading control. (C) mRNA levels of Fgf9 and Igf2 in Hdac3 KO and EV MECs after 24 hours treatment with Hdac3 WT (wild type), Y298H mutant, or mCherry (CTL) lentivirus. The expression of HDAC3 was quantified by western blot. n=6 in each group. The mRNA levels of Fgf9 and Igf2 were quantified by qRT-PCR. n=6 in each group. P-values were determined by the Mann-Whitney U test for (A) and One-way ANOVA followed by the Tukey post hoc test for (B) and (C).
Figure 5.
Figure 5.. miR-322 and miR-503 repress the expression of FGF9 and IGF2 and CM proliferation.
(A) Volcano plot of miR sequencing of Hdac3 KO and EV MECs. n=3 in each group. MiRNAs with reads less than 100 were discarded and miRNA expression levels were normalized by TPM (transcript per million) values (TPM = (miRNA total reads/total clean reads) × 106). Log2 fold changes were calculated by TPM per miR in the KO group divided by the mean TPM per miR in the EV group then followed by calculation of Log (fold change, 2). Significantly downregulated miRs are shown in light blue, and significantly up-regulated miRs are shown in red. Cut-off criteria: adjusted P-value<0.01. (B) Quantification of Fgf9 and Igf2 expression in MECs after miR mimics treatment (final concentration: 10 nM) by qRT-PCR. Gapdh was used as a cDNA loading control. Fgf9, n=7 in each group; Igf2, n=6 in each group. Fold changes were compared to the miR scrambles (SCR) group. (C) miR-322 and miR-503 share high similarity of their seed binding motifs to 3’UTRs of Fgf9 and Igf2. Binding motifs or complementary bases are in red. (D) Quantification of the expression of FGF9 and IGF2 after miR-322 or miR-503 mimics treatment by western blot. n=4 in each group. (E) The effects of supernatants from miR-322 and miR-503 mimics treated MECs on E13.5 CM proliferation. Representative immunofluorescence micrographs are presented. Scale bars: 275 um (upper images); 50 um (lower images). Percentage of p-H3+ CMs were quantified. Independent samples: n=12 in each group. (F) Quantification of the expression of miR-322 and miR-503 in Hdac3 KO MECs, RGFP966-treated MECs (10 uM), or E13.5 Hdac3eko hearts by qRT-PCR. U6 snRNA was used for normalization. miR-322 or miR-503 expression in EV or KO MECs: n=4 in each group; miR-322 expression after vehicle or RGFP966 treatment: n=5 in each group; miR-503 expression after vehicle or RGFP966 treatment: n=4 in each group; miR-322 expression in E13.5 hearts: CTL (n=6), Hdac3eko (n=8); miR-503 expression in E13.5 hearts: CTL (n=5), Hdac3eko (n=8). P-values were determined by One-way ANOVA followed by the Dunnett post hoc test for (B), One-way ANOVA followed by the Tukey post hoc test for (E), and the Mann-Whitney U test for (D) and (F).
Figure 6.
Figure 6.. Knockdown of miR-322 or miR-503 restores the expression of FGF9 and IGF2.
(A) Quantification of miR-322 and miR-503 after Hdac3 KO or EV MECs were infected with LentimiRa-GFP-miRZip (miR-322 or miR-503) or pGreenPuro Scramble Hairpin control lentivirus (SCR) respectively. miR levels were quantified by qRT-PCR. n=6 in each group. (B) Quantification of the expression of FGF9 and IGF2 after miRZip lentiviral treatment by western blot. n=8 in each group. P-values were determined by One-way ANOVA followed by the Tukey post hoc test for (A) and (B).
Figure 7.
Figure 7.. HDAC3 represses miR-322/miR-503 promoter activity.
(A) Quantification of H3K27Ac in Hdac3 EV and KO MECs by western blot. n=5 in each group. (B) Schematic diagram of the miR-322/miR-503 locus from the UCSC Genome Browser. In the upstream regulatory regions as well as gene bodies, active epigenetic marker H3K27Ac was identified by the ENCODE project. (C) Quantification of H3K27Ac binding affinity in the miR-322/miR-503 promoter region in Hdac3 KO and EV MECs by ChIP-qPCR. Primers targeting a gene desert region were used as a negative control. n=6 in each group. (D) Quantification of binding of HDAC3 to the miR-322/miR-503 promoter region by ChIP-qPCR in MECs. n=5 in each group. (E) Dual luciferase reporter assays on the −1.5 kb miR-322/miR-503 promoter when Hdac3 is either knocked out or inhibited by RGFP966 (10 uM) treatment. The ratio of firefly:Renilla luciferase light units (RLU) was determined 48 hours after transfection. n=6 in each group. (F) The schematics of the working model. In the developing epicardium, HDAC3 represses the expression of miR-322/miR-503 to release their suppression on the expression of FGF9 and IGF2. When Hdac3 is deleted, the expression of miR-322/miR-503 is increased, which subsequently suppresses the expression of FGF9 and IGF2 to a stronger extent, and the decrease of FGF9 and IGF2 leads to ventricular wall hypoplasia. P-values were determined by the Mann-Whitney U test for (A) and (D), the one-way ANOVA followed by the Tukey post hoc test for (C) and unpaired two tailed Student’s t-test for (E).

Similar articles

Cited by

References

    1. Zaidi S and Brueckner M. Genetics and Genomics of Congenital Heart Disease. Circulation research. 2017;120:923–940. - PMC - PubMed
    1. Tian Y and Morrisey EE. Importance of myocyte-nonmyocyte interactions in cardiac development and disease. Circulation research. 2012;110:1023–34. - PMC - PubMed
    1. Quijada P, Trembley MA and Small EM. The Role of the Epicardium During Heart Development and Repair. Circulation research. 2020;126:377–394. - PMC - PubMed
    1. Schlueter J and Brand T. Epicardial progenitor cells in cardiac development and regeneration. J Cardiovasc Transl Res. 2012;5:641–53. - PubMed
    1. Saifi O, Ghandour B, Jaalouk D, Refaat M and Mahfouz R. Myocardial regeneration: role of epicardium and implicated genes. Mol Biol Rep. 2019;46:6661–6674. - PubMed

Publication types