. 2023 Feb;19(2):570-596.
doi: 10.1080/15548627.2022.2084884. Epub 2022 Jun 19.

Proteasomal inhibition preferentially stimulates lysosome activity relative to autophagic flux in primary astrocytes

Affiliations

Proteasomal inhibition preferentially stimulates lysosome activity relative to autophagic flux in primary astrocytes

Ruiyi Yuan et al. Autophagy. 2023 Feb.

Abstract

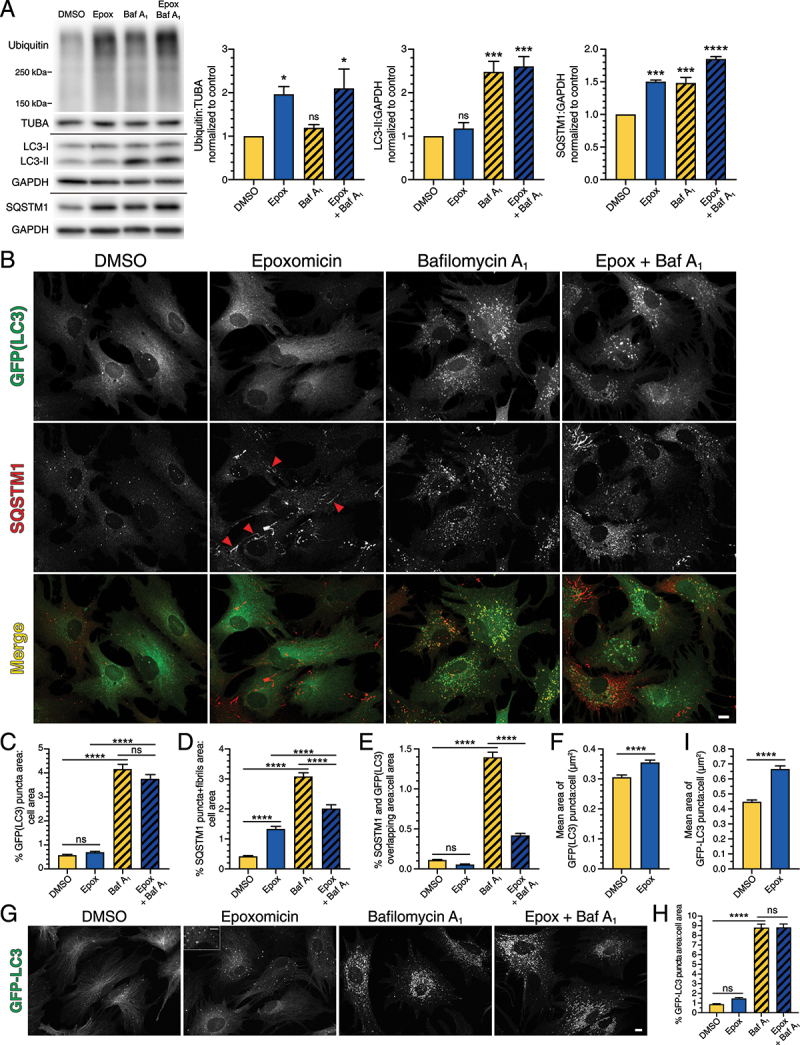
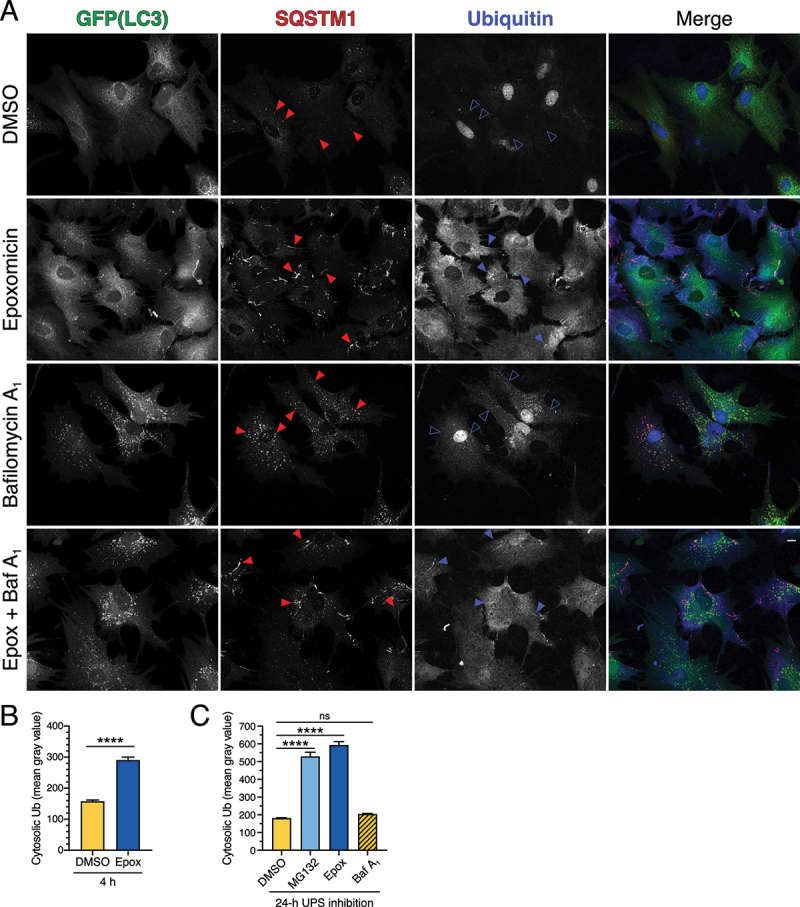
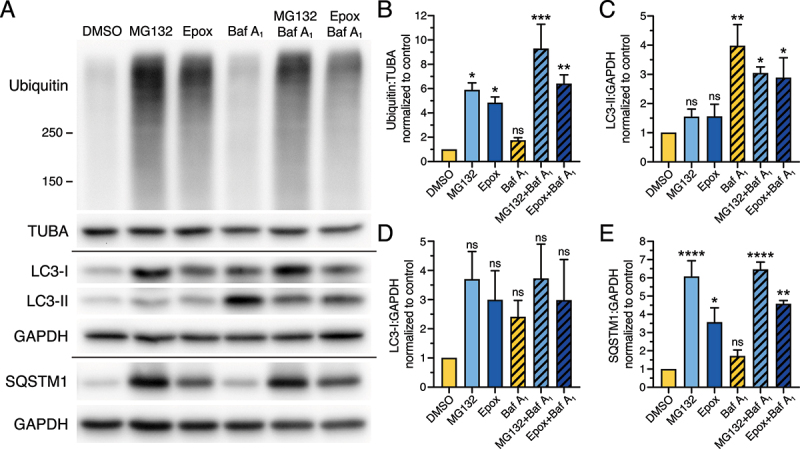
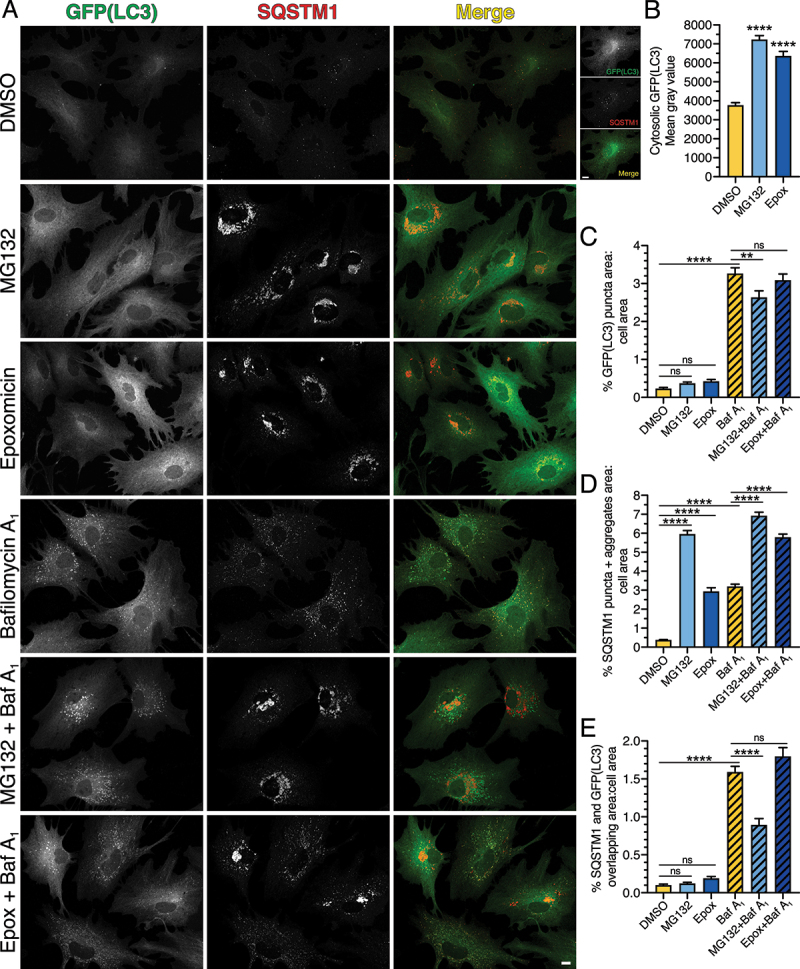
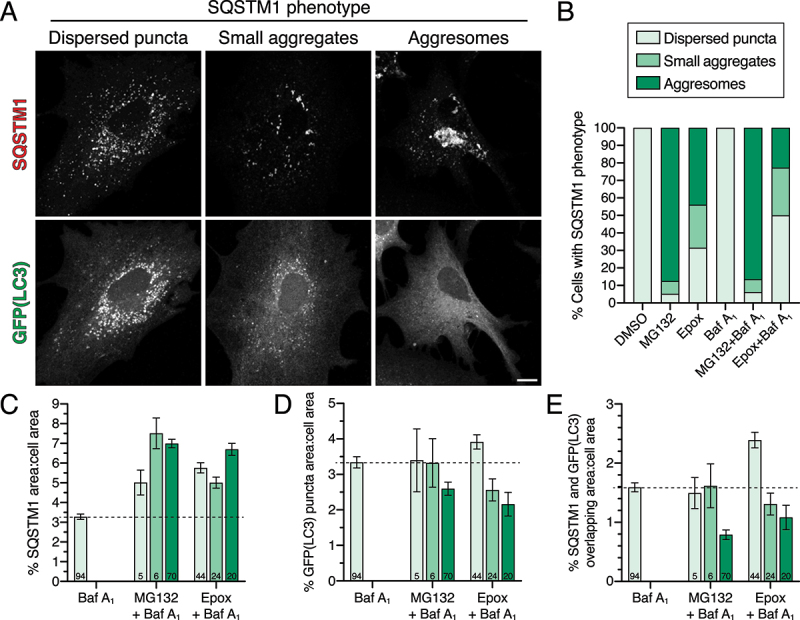
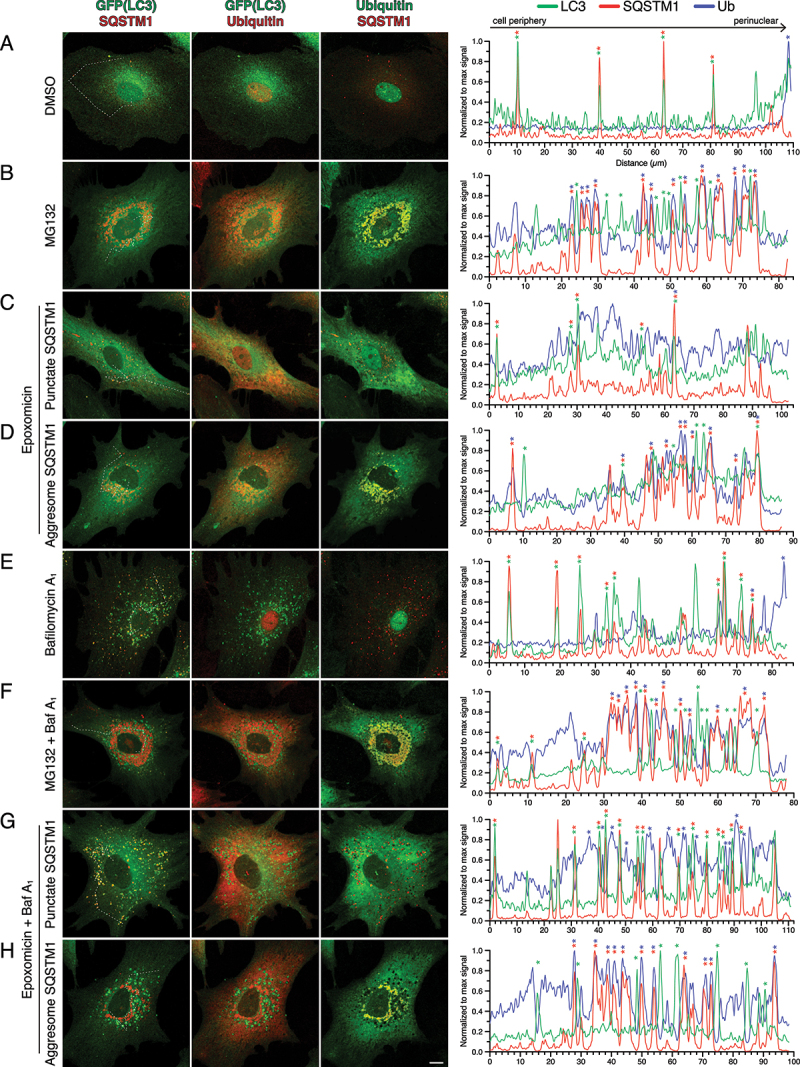
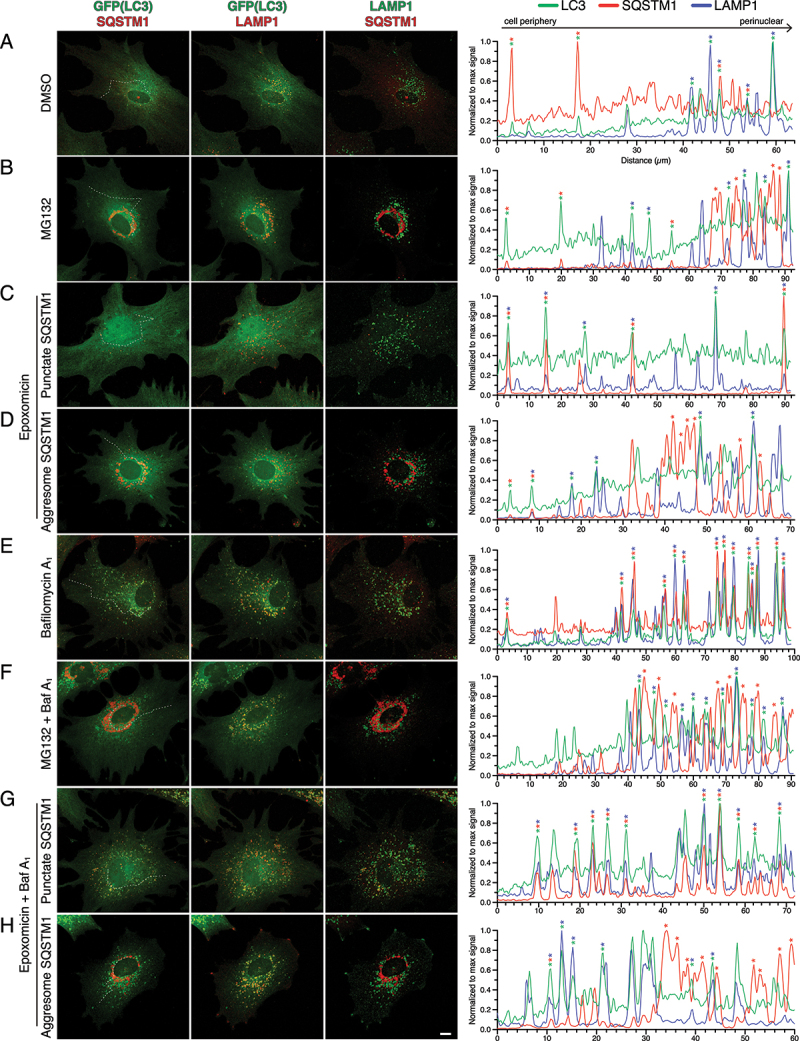
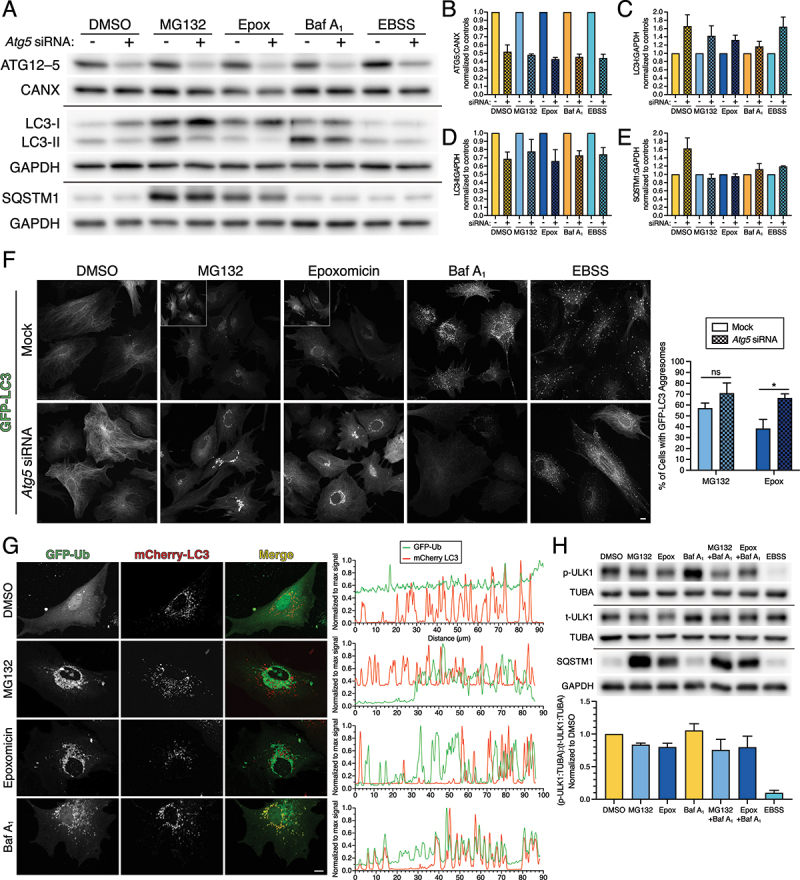
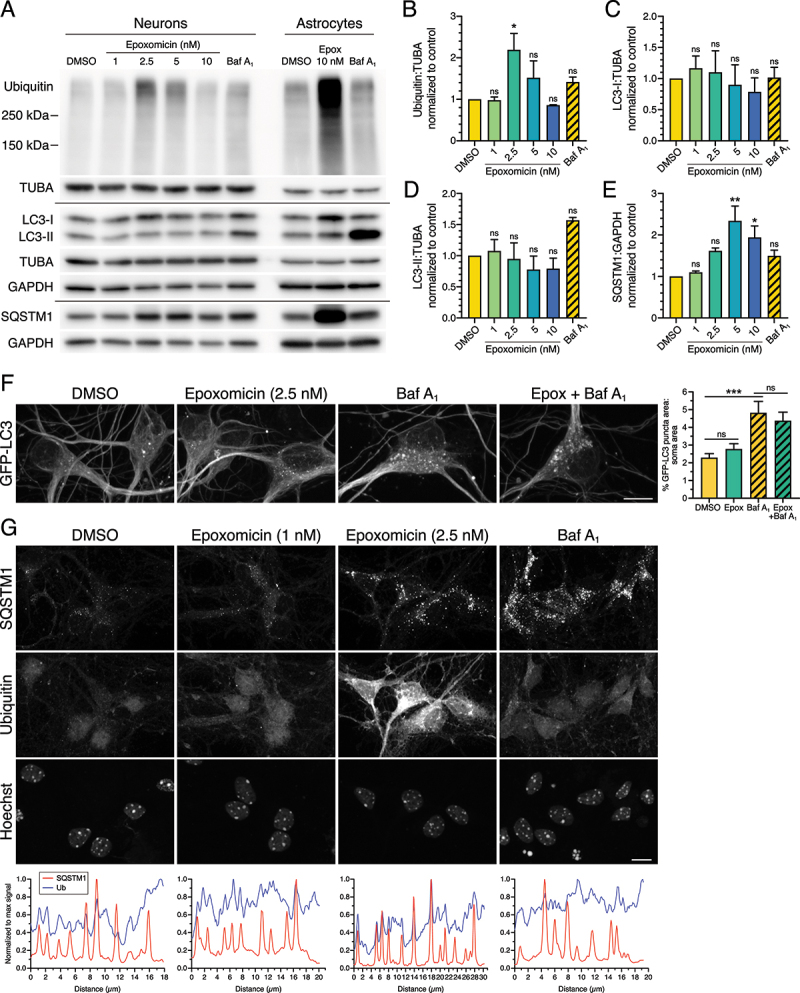
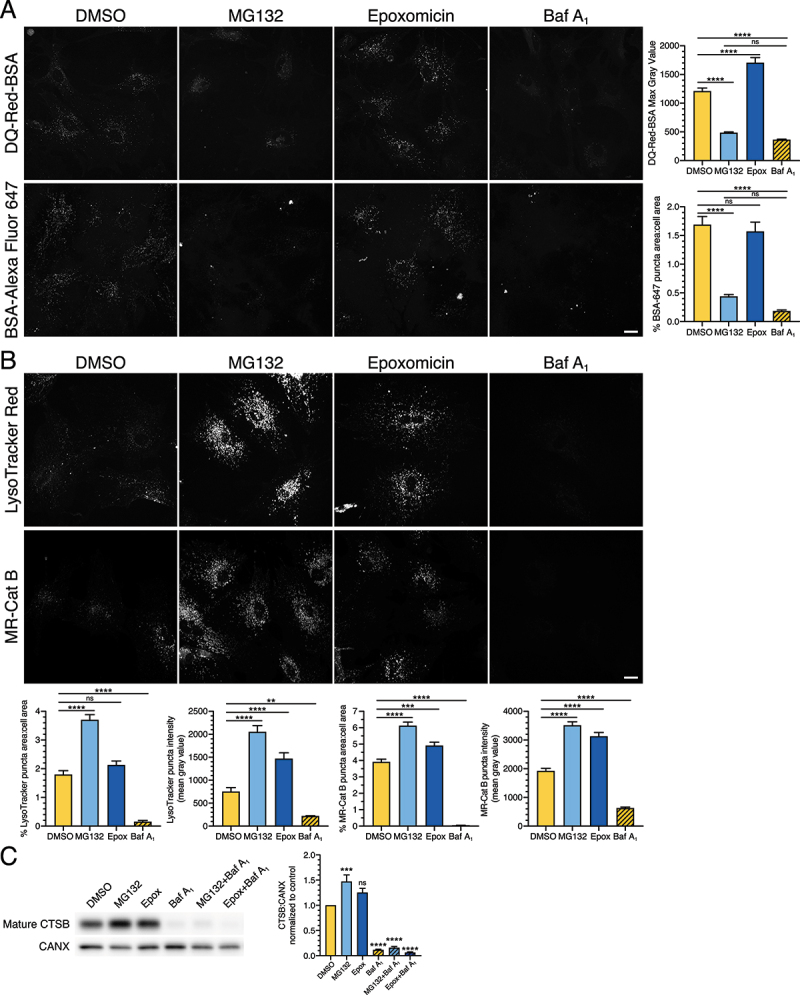
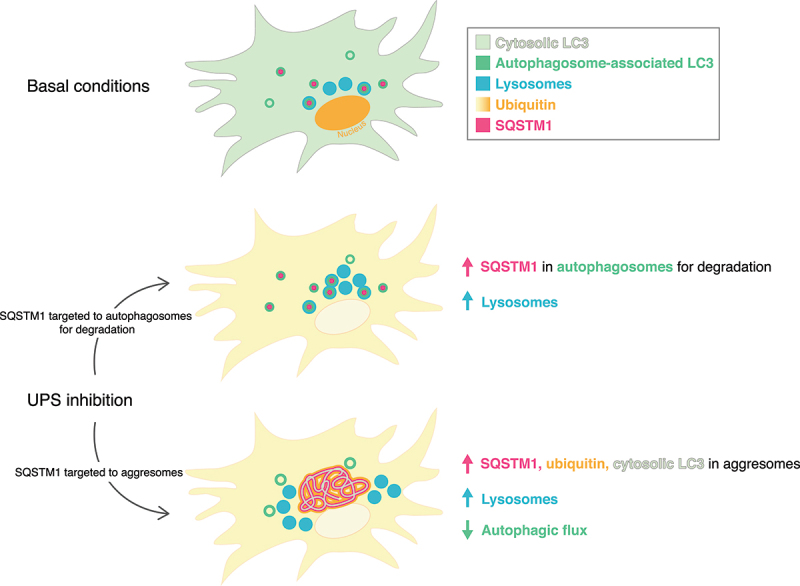
Neurons and astrocytes face unique demands on their proteome to enable proper function and survival of the nervous system. Consequently, both cell types are critically dependent on robust quality control pathways such as macroautophagy (hereafter referred to as autophagy) and the ubiquitin-proteasome system (UPS). We previously reported that autophagy is differentially regulated in astrocytes and neurons in the context of metabolic stress, but less is understood in the context of proteotoxic stress induced by inhibition of the UPS. Dysfunction of the proteasome or autophagy has been linked to the progression of various neurodegenerative diseases. Therefore, in this study, we explored the connection between autophagy and the proteasome in primary astrocytes and neurons. Prior studies largely in non-neural models report a compensatory relationship whereby inhibition of the UPS stimulates autophagy. To our surprise, inhibition of the proteasome did not robustly upregulate autophagy in astrocytes or neurons. In fact, the effects on autophagy are modest particularly in comparison to paradigms of metabolic stress. Rather, we find that UPS inhibition in astrocytes induces formation of Ub-positive aggregates that harbor the selective autophagy receptor, SQSTM1/p62, but these structures were not productive substrates for autophagy. By contrast, we observed a significant increase in lysosomal degradation in astrocytes in response to UPS inhibition, but this stimulation was not sufficient to reduce total SQSTM1 levels. Last, UPS inhibition was more toxic in neurons compared to astrocytes, suggesting a cell type-specific vulnerability to proteotoxic stress.Abbreviations: Baf A1: bafilomycin A1; CQ: chloroquine; Epox: epoxomicin; MAP1LC3/LC3: microtubule-associated protein 1 light chain 3; MTOR: mechanistic target of rapamycin kinase; p-ULK1: phospho-ULK1; SQSTM1/p62: sequestosome 1; Ub: ubiquitin; ULK1: unc-51 like kinase 1; UPS: ubiquitin-proteasome system.

Keywords: Astrocytes; LC3; SQSTM1; autophagy; lysosomes; neurons; proteasome; ubiquitin.


Conflict of interest statement

The authors declare no conflict of interest. .

Figures

Figure 1.
Figure 1.
Short-term UPS inhibition with epoxomicin does not significantly upregulate autophagic flux, but leads to the formation of SQSTM1-positive fibril-like structures in primary astrocytes. Primary astrocytes were treated with 5 µM epoxomicin supplemented with 100 nM Baf A1 (or equivalent volume of DMSO as a solvent control) for 4 h and analyzed by (A) immunoblot, (B-F) immunostain, and (G-I) live cell imaging. (A) Immunoblot analysis and corresponding quantification of glial lysates. GAPDH and TUBA/α-tubulin serve as loading controls; horizontal lines designate individual blots. ubiquitin levels were normalized to TUBA/α-tubulin, and LC3-II and SQSTM1 levels were normalized to GAPDH (means ± SEM; one-way ANOVA with Dunnett’s post hoc test; n = 3–4 independent experiments; 4–9 DIV). (B) Maximum projections of z-stacks of GFP-LC3 transgenic astrocytes immunostained for GFP and SQSTM1. SQSTM1 images are grayscale matched to facilitate direct comparisons. Red arrowheads denote SQSTM1-positive fibril-like structures. Bar: 10 µm. (C-F) Corresponding quantification of immunostain analysis shown in B. (C) Quantification of total GFP(LC3) puncta area normalized to cell area (means ± SEM; one-way ANOVA with Tukey’s post hoc test; n = 135–165 cells from 3 independent experiments; 3–5 DIV). (D) Quantification of total area occupied by SQSTM1 puncta and fibrils normalized to cell area (means ± SEM; one-way ANOVA with Tukey’s post hoc test; n = 131–160 cells from 3 independent experiments; 3–5 DIV). (E) Quantification of the percentage of overlapping area between GFP(LC3)-positive puncta and SQSTM1-positive structures normalized to cell area (means ± SEM; one-way ANOVA with Tukey’s post hoc test; n = 126–146 cells from 3 independent experiments; 3–5 DIV). (F) Mean area of GFP(LC3)-positive puncta per astrocyte (means ± SEM; unpaired t-test; DMSO, n = 148 astrocytes; Epoxomicin, n = 165 astrocytes; data from 3 independent experiments; 3–5 DIV). (G) Maximum projections of z-stacks of GFP-LC3 transgenic astrocytes using live cell imaging. Bar: 10 µm. Inset bar: 5 µm. (H and I) Corresponding quantification of live cell imaging shown in G. (H) Quantification of total GFP-LC3 puncta area normalized to cell area (means ± SEM; one-way ANOVA with Tukey’s post hoc test; n = 101–116 cells from 3 independent experiments; 6–9 DIV). (I) Mean area of GFP-LC3-positive puncta per astrocyte (means ± SEM; unpaired t-test; DMSO, n = 110 astrocytes; Epoxomicin, n = 101 astrocytes; data from 3 independent experiments; 6–9 DIV).
Figure 2.
Figure 2.
SQSTM1 fibril-like structures that form in response to short-term UPS inhibition are partially positive for ubiquitin. (A, B) Immunostain analysis and corresponding quantification of primary astrocytes treated with 5 µM epoxomicin supplemented with 100 nM Baf A1 (or equivalent volume of DMSO as a solvent control) for 4 h. (A) Maximum projections of z-stacks of GFP-LC3 transgenic astrocytes immunostained for GFP, SQSTM1, and ubiquitin. Closed red arrowheads denote SQSTM1-positive puncta or fibril-like structures; closed blue arrowheads denote SQSTM1-positive fibril-like structures that are co-positive for ubiquitin; open blue arrowheads denote SQSTM1-positive puncta that are negative for ubiquitin. Bar: 10 µm. (B) Quantification of cytosolic ubiquitin signal intensity after 4 h of UPS inhibition (means ± SEM; unpaired t-test; n = 97–136 cells from 3 independent experiments; 6 DIV). (C) Quantification of cytosolic ubiquitin signal intensity after 24 h of UPS inhibition (0.5 µM MG132 or 10 nM epoxomicin) or after 4 h of 100 nM baf A1-treatment (means ± SEM; one-way ANOVA with Tukey’s post hoc test; n = 82–116 cells from 3 independent experiments; 3–8 DIV).
Figure 3.
Figure 3.
Long-term UPS inhibition does not significantly upregulate autophagic flux, but increases levels of SQSTM1 in primary astrocytes. (A-E) Immunoblot analysis and corresponding quantification of primary astrocytes treated with DMSO, 0.5 µM MG132 or 10 nM epoxomicin for 24 h; 100 nM Baf A1 (or equivalent volume of DMSO as a solvent control) was included in the last 4 h. GAPDH and TUBA/α-tubulin serve as loading controls; horizontal lines designate individual blots. (B) Ubiquitin levels were normalized to TUBA/α-tubulin; (C, D) LC3-II and LC3-I were normalized to GAPDH; and (E) SQSTM1 levels were normalized to GAPDH (means ± SEM; one-way ANOVA with Dunnett’s post hoc test; n = 3 independent experiments; 4–6 DIV).
Figure 4.
Figure 4.
Long-term UPS inhibition does not significantly upregulate autophagic flux, but leads to the formation of SQSTM1-positive aggresomes in primary astrocytes. (A-E) Immunostain analysis and corresponding quantification of primary astrocytes treated with DMSO, 0.5 µM MG132 or 10 nM epoxomicin for 24 h; 100 nM Baf A1 (or equivalent volume of DMSO as a solvent control) was included in the last 4 h. (A) Maximum projections of z-stacks of GFP-LC3 transgenic astrocytes immunostained for GFP and SQSTM1. GFP(LC3) images for DMSO, MG132, and Epoxomicin are grayscale matched to show an increase in cytosolic LC3 upon UPS inhibition. Higher magnification images for DMSO are contrast enhanced for visualization. Bars: 10 µm. (B) Quantification of cytosolic GFP(LC3) signal intensity (means ± SEM; one-way ANOVA with Tukey’s post hoc test; n = 143–182 cells from 3 independent experiments; 6–7 DIV). (C) Quantification of total GFP(LC3) puncta area normalized to cell area (means ± SEM; one-way ANOVA with Tukey’s post hoc test; n = 78–102 cells from 3 independent experiments; 6–7 DIV). (D) Quantification of total area occupied by SQSTM1-positive structures (puncta and aggresomes) normalized to cell area (means ± SEM; one-way ANOVA with Tukey’s post hoc test; n = 85–108 cells from 3 independent experiments; 6–7 DIV). (E) Quantification of the percentage of overlapping area between GFP(LC3)-positive and SQSTM1-positive structures normalized to cell area (means ± SEM; one-way ANOVA with Tukey’s post hoc test; n = 73–96 cells from 3 independent experiments; 6–7 DIV).
Figure 5.
Figure 5.
UPS inhibition with epoxomicin moderately elevates SQSTM1 incorporation into autophagosomes in astrocytes lacking aggresomes. (A-E) Immunostain analysis and corresponding quantification of primary astrocytes treated with DMSO, 0.5 µM MG132 or 10 nM epoxomicin for 24 h; 100 nM Baf A1 (or equivalent volume of DMSO as a solvent control) was included in the last 4 h. (A) Maximum projections of z-stacks of GFP-LC3 transgenic astrocytes immunostained for GFP and SQSTM1. Shown are images representing each cell category based on SQSTM1 phenotype; images shown are from the epoxomicin and Baf A1 co-treatment. Bar: 10 µm. (B) Quantification of the percentage of astrocytes displaying each category of SQSTM1 phenotype (same data used as in Figure 4E but Baf A1-treated samples only, n = 81–94 cells from 3 independent experiments; 6–7 DIV). (C) Quantification of total area occupied by SQSTM1-positive structures (includes puncta, smaller aggregates, and aggresomes) normalized to cell area (means ± SEM; one-way ANOVA with Tukey’s post hoc test; n-value [total number of cells from 3 independent experiments] is denoted at the base of each bar; 6–7 DIV). (D) Quantification of total GFP(LC3)-positive puncta area normalized to cell area (means ± SEM; one-way ANOVA with Tukey’s post hoc test; n-value [total number of cells from 3 independent experiments] is denoted at the base of each bar; 6–7 DIV). (E) Quantification of the percentage of overlapping area between GFP(LC3)-positive puncta and SQSTM1-positive structures normalized to cell area (means ± SEM; one-way ANOVA with Tukey’s post hoc test; n-value [total number of cells from 3 independent experiments] is denoted at the base of each bar; 6–7 DIV).
Figure 6.
Figure 6.
Ubiquitin is enriched on SQSTM1-positive aggresomes as compared with SQSTM1-positive puncta in astrocytes. (A-H) Immunostain analysis of primary astrocytes (3–8 DIV) treated with DMSO, 0.5 µM MG132 or 10 nM epoxomicin for 24 h; 100 nM Baf A1 (or equivalent volume of DMSO as a solvent control) was included in the last 4 h. Maximum projections of z-stacks of GFP-LC3 transgenic astrocytes immunostained for GFP, SQSTM1, and ubiquitin. Corresponding line scans are drawn from the cell periphery toward the perinuclear region (left to right); asterisks indicate puncta or aggresomes with overlapping markers. Dashed line in maximum projection denotes location of line scan. Bar: 10 µm.
Figure 7.
Figure 7.
LAMP1 is enriched on SQSTM1-positive puncta as compared with SQSTM1-positive aggresomes in astrocytes. (A-H) Immunostain analysis of primary astrocytes (5–7 DIV) treated with DMSO, 0.5 µM MG132 or 10 nM epoxomicin for 24 h; 100 nM Baf A1 (or equivalent volume of DMSO as a solvent control) was included in the last 4 h. Maximum projections of z-stacks of GFP-LC3 transgenic astrocytes immunostained for GFP, SQSTM1, and LAMP1. Corresponding line scans are drawn from the cell periphery toward the perinuclear region (left to right); asterisks indicate puncta or aggresomes with overlapping markers. Dashed line in maximum projection denotes location of line scan. Bar: 10 µm.
Figure 8.
Figure 8.
LC3 population on aggresomes is likely cytosolic LC3 rather than autophagosome-associated LC3. Primary astrocytes were treated with DMSO, 0.5 µM MG132 or 10 nM epoxomicin for 24 h, 100 nM Baf A1 for 4 h, or EBSS for 4 h. (A-F) Astrocytes were also treated with siRNAs targeted against Atg5, or a mock treatment as a control. (A-E) Immunoblot analysis and corresponding quantification of glial lysates. CANX and GAPDH serve as loading controls; horizontal lines designate individual blots. (B) ATG5 levels (specifically in the context of the ATG12-ATG5 conjugate) were normalized to CANX; (C and D) LC3-I and LC3-II were normalized to GAPDH; and (E) SQSTM1 levels were normalized to GAPDH (means ± SEM; n = 3 independent experiments; 6 DIV). (F) Maximum projections of z-stacks of GFP-LC3 transgenic astrocytes using live cell imaging. Images within the same column of treatment (e.g. DMSO mock and DMSO siRNA) are grayscale matched to facilitate direct comparisons; insets are grayscale adjusted individually. Bar: 10 µm. Corresponding quantification of the percentage of astrocytes with GFP-LC3-positive aggresomes (means ± SEM; unpaired t-test; n = 4 independent experiments; 6–7 DIV). (G) Primary astrocytes were treated with DMSO, 0.5 µM MG132 or 10 nM epoxomicin for 24 h, or 100 nM Baf A1 for 4 h and analyzed using live cell imaging. Shown are maximum projections of z-stacks of astrocytes expressing mCherry-LC3 and GFP-Ub (shown are representative images from 3 independent experiments; 6 DIV). Bar: 10 µm. Corresponding line scans are drawn from the cell periphery toward the perinuclear region (left to right). Overlapping peaks for mCherry-LC3 and GFP-Ub are present in the basal conditions (DMSO and Baf A1). mCherry-LC3 and GFP-Ub are largely non-overlapping in treatments that block UPS function (MG132 and epoxomicin). (H) Primary astrocytes were treated with DMSO, 0.5 µM MG132 or 10 nM epoxomicin for 24 h; DMSO or 100 nM Baf A1 were included in the final 4 h. As a positive control, astrocytes were also starved in EBSS for 4 h. Immunoblot analysis and corresponding quantification of of glial lysates. TUBA/α-tubulin and GAPDH serve as loading controls; horizontal lines designate individual blots. p-ULK1 (S757) and total ULK1 (t-ULK1) levels were first normalized to their respective TUBA/α-tubulin controls, and then p-ULK1:TUBA/α-tub was then normalized to t-ULK1:TUBA/α-tub (means ± SEM; n = 3 independent experiments; 6–7 DIV).
Figure 9.
Figure 9.
UPS inhibition has a reduced effect on SQSTM1 aggresome formation in primary cortical neurons. (A-E) Immunoblot analysis and corresponding quantification of increasing concentrations of epoxomicin (24-h treatment) as compared with 100 nM Baf A1 for 4 h in primary mouse cortical neurons. Astrocytes were treated with 10 nM epoxomicin for 24 h or 100 nM Baf A1 for 4 h; 3 DIV. GAPDH and TUBA/α-tubulin serve as loading controls; horizontal lines designate individual blots. ubiquitin, LC3-I, and LC3-II levels were normalized to TUBA/α-tubulin, and SQSTM1 levels were normalized to GAPDH (means ± SEM; one-way ANOVA with Dunnett’s post hoc test; n = 3 independent experiments; 8 DIV). Differences in Ub and SQSTM1 levels in the dosage response at 5 nM epoxomicin may reflect issues with toxicity and normalization to GAPDH. (F) Maximum projections of z-stacks of GFP-LC3 transgenic mouse cortical neurons using live cell imaging. Neurons were treated with 2.5 nM epoxomicin for 24 h; 100 nM Baf A1 (or equivalent volume of DMSO as a solvent control) was included in the last 4 h. Bar: 10 µm. Corresponding quantification of total GFP-LC3 puncta area normalized to soma area (means ± SEM; one-way ANOVA with Tukey’s post hoc test; n = 53–64 neurons from 3 independent experiments; 7 DIV). (G) Immunostain and corresponding line scan analysis of primary mouse cortical neurons (7 DIV) treated with DMSO, 1 nM or 2.5 nM epoxomicin for 24 h, or 100 nM Baf A1 for 4 h. Images with the same marker (SQSTM1, Ub, or Hoechst) are grayscale matched to facilitate direct comparisons across treatments. Bar: 10 µm.
Figure 10.
Figure 10.
Long-term UPS inhibition stimulates lysosome function in astrocytes. (A and B) Live-cell imaging analysis of primary astrocytes treated with DMSO, 0.5 µM MG132 or 10 nM epoxomicin for 24 h, or 100 nM Baf A1 for 4 h. All images within the same marker are grayscale matched to facilitate direct comparisons. (A) Maximum projections of z-stacks and corresponding quantification of astrocytes labeled with DQ-Red-BSA or BSA-Alexa Fluor 647 (BSA-647) for the final 1 h of the indicated treatment (means ± SEM; one-way ANOVA with Tukey’s post hoc test; DQ-Red-BSA, n = 95–121 cells from 3 independent experiments; BSA-647, n = 85–96 cells from 3 independent experiments; 5–8 DIV). Bar: 20 µm. (B) Maximum projections of z-stacks and corresponding quantitation of astrocytes labeled with LysoTracker Red or Magic-Red Cathepsin B substrate for the final 30 min of the indicated treatment (means ± SEM; one-way ANOVA with Tukey’s post hoc test; LysoTracker, n = 69–76 cells from 3 independent experiments; MR-Cat B, n = 72–97 cells from 3 independent experiments; 7–10 DIV). Bar: 20 µm. (C) Immunoblot analysis and corresponding quantification of primary astrocytes treated with DMSO, 0.5 µM MG132 or 10 nM epoxomicin for 24 h; 100 nM Baf A1 (or equivalent volume of DMSO as a solvent control) was included in the last 4 h. Mature CTSB levels were normalized to CANX (means ± SEM; one-way ANOVA with Dunnett’s post hoc test; n = 3–4 independent experiments; 6–9 DIV).
Figure 11.
Figure 11.
Model for long-term UPS inhibition on autophagy in primary astrocytes. Long-term UPS inhibition elicits multiple phenotypes defined by distinct structures and trafficking itineraries for SQSTM1 that may represent different stages in the cellular response. In one population of astrocytes, SQSTM1 is routed to autophagy for proteolytic degradation, resulting in only a modest activation of autophagy. In another population of astrocytes, SQSTM1 is diverted away from degradative compartments to accumulate in aggresomes that are enriched for ubiquitin and cytosolic LC3. Sequestration of cytosolic LC3 may contribute to the reduction in autophagic flux observed in astrocytes with aggresomes.

Similar articles

Cited by

References

    1. Winckler B, Faundez V, Maday S, et al. The endolysosomal system and proteostasis: from development to degeneration. J Neurosci. 2018. Oct 31;38(44):9364–9374. - PMC - PubMed
    1. Harris JJ, Attwell D.. The energetics of CNS white matter. J Neurosci. 2012. Jan 4;32(1):356–371. - PMC - PubMed
    1. Spalding KL, Bhardwaj RD, Buchholz BA, et al. Retrospective birth dating of cells in humans. Cell. 2005. Jul 15;122(1):133–143. - PubMed
    1. Sofroniew MV, Vinters HV. Astrocytes: biology and pathology. Acta Neuropathol. 2010. Jan;119(1):7–35. - PMC - PubMed
    1. Chuang E, Hori AM, Hesketh CD, et al. Amyloid assembly and disassembly. J Cell Sci. 2018. Apr 13;131(8):jcs189928. - PMC - PubMed

Publication types

MeSH terms