. 2022 Jun 6:(184):10.3791/63665.
doi: 10.3791/63665.

An Optimized Single-Molecule Pull-Down Assay for Quantification of Protein Phosphorylation

Affiliations

An Optimized Single-Molecule Pull-Down Assay for Quantification of Protein Phosphorylation

Elizabeth M Bailey et al. J Vis Exp. .

Abstract

Phosphorylation is a necessary posttranslational modification that regulates protein function and directs cell signaling outcomes. Current methods to measure protein phosphorylation cannot preserve the heterogeneity in phosphorylation across individual proteins. The single-molecule pull-down (SiMPull) assay was developed to investigate the composition of macromolecular complexes via immunoprecipitation of proteins on a glass coverslip followed by single-molecule imaging. The current technique is an adaptation of SiMPull that provides robust quantification of the phosphorylation state of full-length membrane receptors at the single-molecule level. Imaging thousands of individual receptors in this way allows for quantifying protein phosphorylation patterns. The present protocol details the optimized SiMPull procedure, from sample preparation to imaging. Optimization of glass preparation and antibody fixation protocols further enhances data quality. The current protocol provides code for the single-molecule data analysis that calculates the fraction of receptors phosphorylated within a sample. While this work focuses on phosphorylation of the epidermal growth factor receptor (EGFR), the protocol can be generalized to other membrane receptors and cytosolic signaling molecules.


Figures
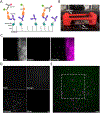
Figure 1:
Figure 1:. Overview of sample preparation.
(A) Cartoon depicting the SiMPull approach. Coverslips are functionalized with an antibody that recognizes the POI to capture that POI from whole cell lysates. The glass is first coated with PEG and biotin-PEG. NeutrAvidin is then bound to the biotin-PEG and acts as an anchor for the biotinylated anti-POI antibody. Phosphorylated proteins are then detected with a fluorescently labeled anti-PY antibody. (B) Picture of the coverslip holder (red) with coverslip array in place and mounted on the microscope stage. The multi-sample arrays are generated by using hydrophobic ink to create up to 20 individual sample squares on a single glass coverslip. The coverslip is 60 mm x 24 mm. (C) Example images of the hydrophobic ink autofluorescence (magenta) with respect to fluorescent beads (green). The autofluorescence of the hydrophobic ink is a useful guide to find the focal plane at the coverslip surface. (D) Example of a raw data image with spectral channels separated on the camera chip by the Quad-view image splitter. The Quad-view filter set includes the following emission filters: blue (445/45 nm), green (525/45 nm), red (600/37 nm), far-red (685/40 nm). (E) Raw overlay of green and far-red channels. The white box indicates the region further examined in Figure 2B-D. Scale bars, 2 μm.
Figure 2:
Figure 2:. Data Analysis workflow.
(A) Channel registration is first performed on images acquired from the nanogrid. After cropping the two spectral channels of interest (here, green and far-red), the fiducial images for each channel are overlaid (left). Enlargement of the box in the left image (Inset) shows that the images are not yet truly registered. The emitters in each channel are then fit to a Gaussian model and localized (Registration). Localization of emitters is shown as circles for the far-red channel and crosses for the green channel. The final step is to apply a local weighted mean transform to shift the far-red channel localization coordinates into the green channel reference frame (Aligned). The calculated local weighted mean transform is then used to register the subsequent SiMPull data. (B) Representative images of the green/EGFR-GFP channel and the far-red/AF647-anti-PY channel. Single emitters above the background photon count are identified and marked with boxes. (C) The emission profile within each selected box is fit to a Gaussian model and the emitters that fit the model of a single fluorophore PSF are kept. (D) A mask is created from the GFP emitters to identify location of EGFR-GFP (green). Colocalization of EGFR-GFP and AF647-anti-PY identifies phosphorylated receptors (white). (E) The fraction of phosphorylated receptors is calculated from the colocalized EGFR-GFP and AF647-anti-PY fits. Bar graph compares PV+EGF treatment to resting cells, averaged for multiple measurements. Error bars represent standard error calculated assuming a binomial distribution. Scale bars, 2 μm.
Figure 3:
Figure 3:. Critical steps to ensure data quality.
(A) From left to right, the first three panels are representative images of the autofluorescence on glass under the respective conditions: after piranha etching, with PEG, and PEG plus NaBH4 treatment (indicated with +). Additionally, surface functionalization is retained after NaBH4 treatment as demonstrated by minimal non-specific PY99-AF647 binding, while retaining robust binding of EGFR-GFP from the lysate. (B) To ensure optimal antibody labeling, a saturation curve should be acquired for each batch of antibody used. This figure shows the concentration curve for labeling EGFR with the site specific phosphotyrosine antibody, anti-EGFR-pY1173. Minimal phosphorylation is detected in untreated cells (Resting, gray diamond). As a control for non-specific binding, cells were also treated with the EGFR kinase inhibitor Lapatinib before addition of 100 nM EGF (magenta triangle), which shows the expected prevention of EGFR phosphorylation. Error bars represent standard error assuming a binomial distribution. (C) Fixation of the sample with a combination of PFA and GA prevents antibody dissociation over time. Error bars represent standard error assuming a binomial distribution. (D) False positives are excluded by selecting the appropriate threshold for Gaussian fitting. Comparing the histogram of fit intensities at a low threshold (Threshold = 0; top) between background (no lysate) and real data (plus cell lysate) allows for selection of appropriate value (Threshold = 475; bottom) to remove fits from autofluorescent spots in the green channel. Vertical magenta line indicates 475 photon threshold. Histograms are calculated from the same number of ROIs for each sample type (n=3). Scale bars, 2 μm.

References

    1. Coba MP et al. Neurotransmitters Drive Combinatorial Multistate Postsynaptic Density Networks. Science signaling 2(68), ra19 (2009). - PMC - PubMed
    1. Gibson Scott K., Parkes John H., and & Liebman PA Phosphorylation Modulates the Affinity of Light-Activated Rhodopsin for G Protein and Arrestin. Biochemistry 39(19), 5738–5749 (2000). - PubMed
    1. Stites EC et al. Use of Mechanistic Models to Integrate and Analyze Multiple Proteomic Datasets. Biophysical Journal 108(7), 1819–1829 (2015). - PMC - PubMed
    1. Hause RJ Jr., et al. Comprehensive Binary Interaction Mapping of SH2 Domains via Fluorescence Polarization Reveals Novel Functional Diversification of ErbB Receptors. PLOS ONE 7(9), e44471 (2012). - PMC - PubMed
    1. Lau EK et al. Quantitative encoding of the effect of a partial agonist on individual opioid receptors by multisite phosphorylation and threshold detection. Science Signaling 4(185), (2011). - PMC - PubMed

Publication types