. 2022 Aug 22;61(34):e202206122.
doi: 10.1002/anie.202206122. Epub 2022 Jul 8.

Probing Neuropeptide Volume Transmission In Vivo by Simultaneous Near-Infrared Light-Triggered Release and Optical Sensing

Affiliations

Probing Neuropeptide Volume Transmission In Vivo by Simultaneous Near-Infrared Light-Triggered Release and Optical Sensing

Hejian Xiong et al. Angew Chem Int Ed Engl. .

Abstract

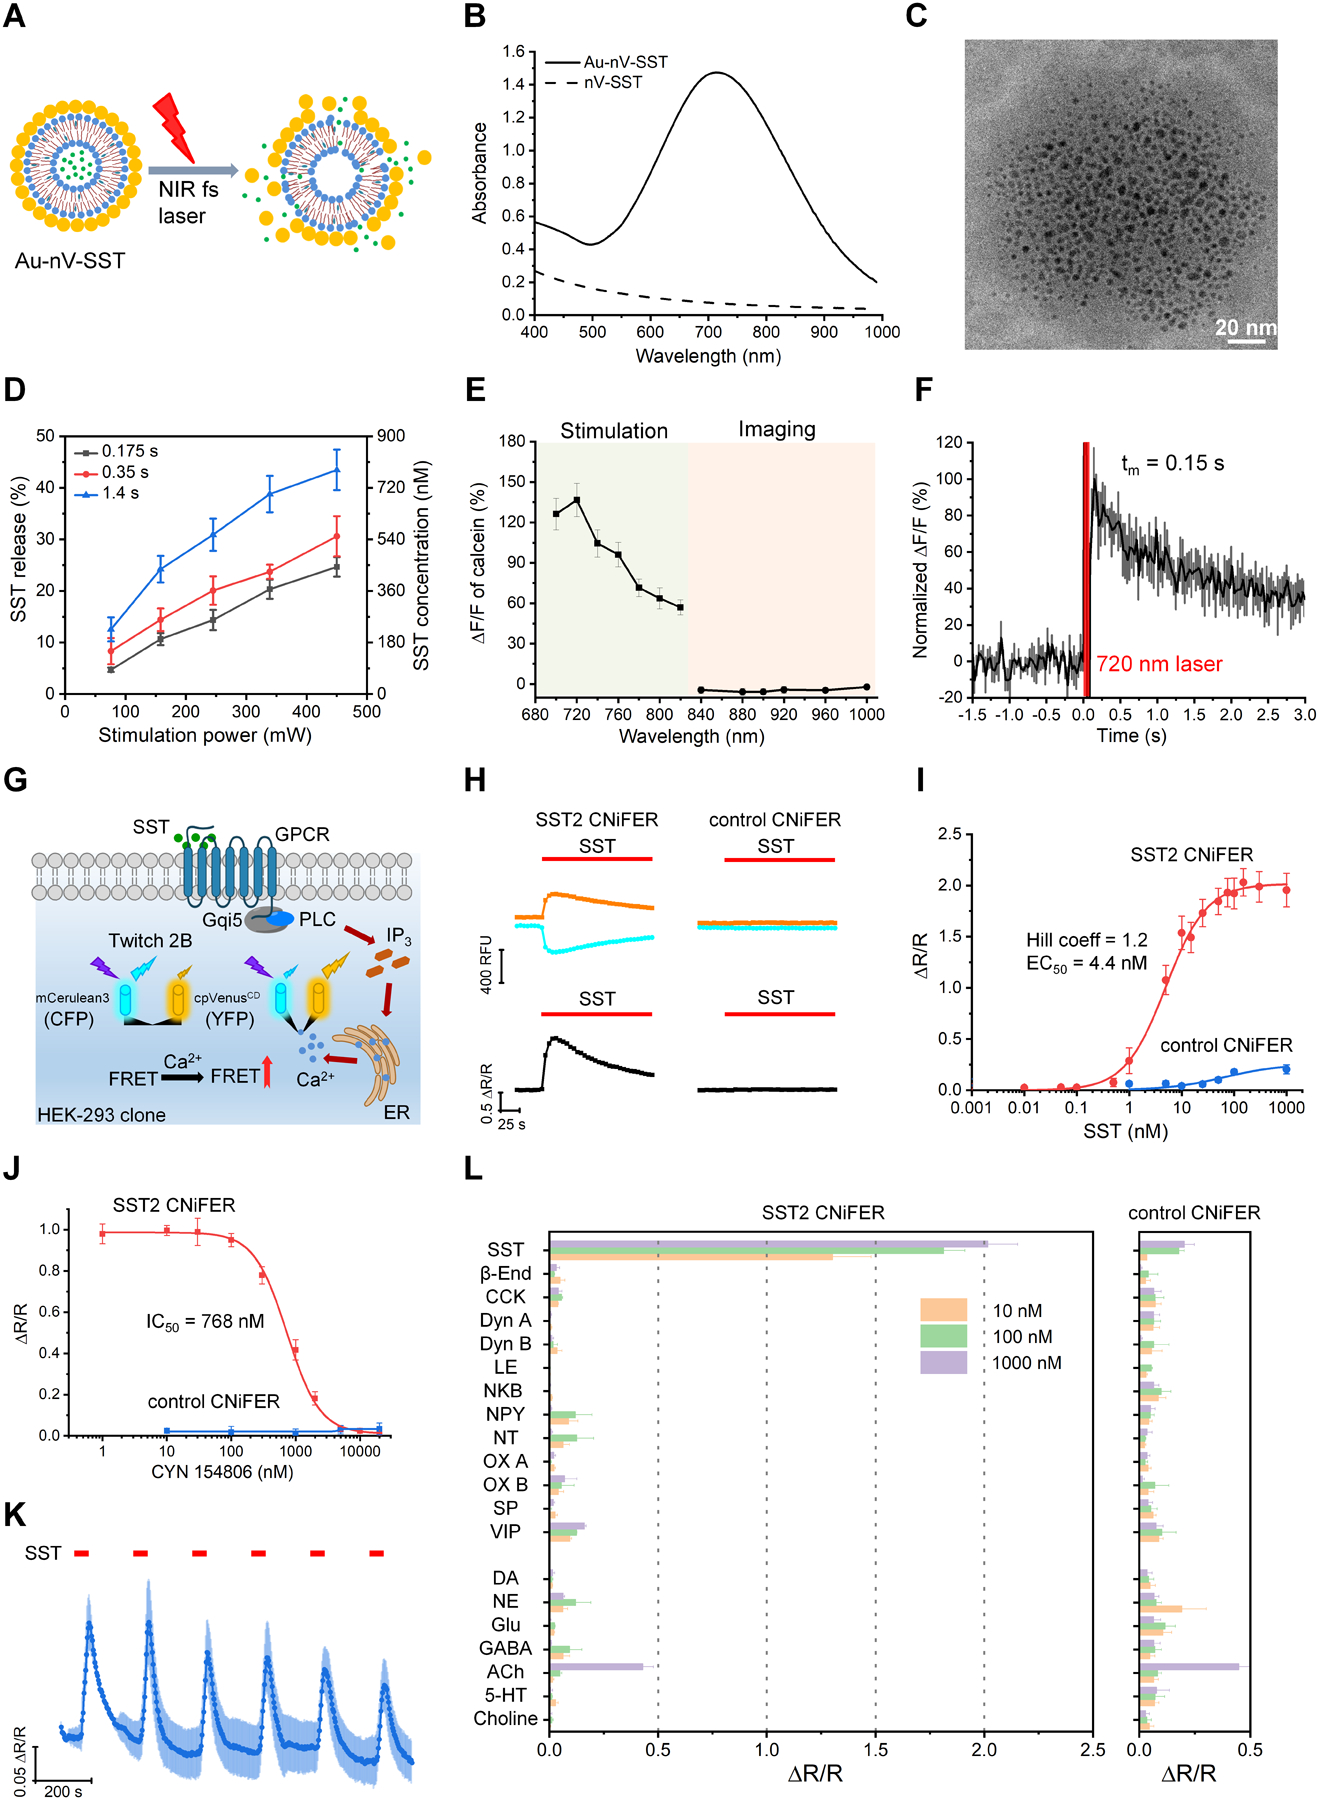
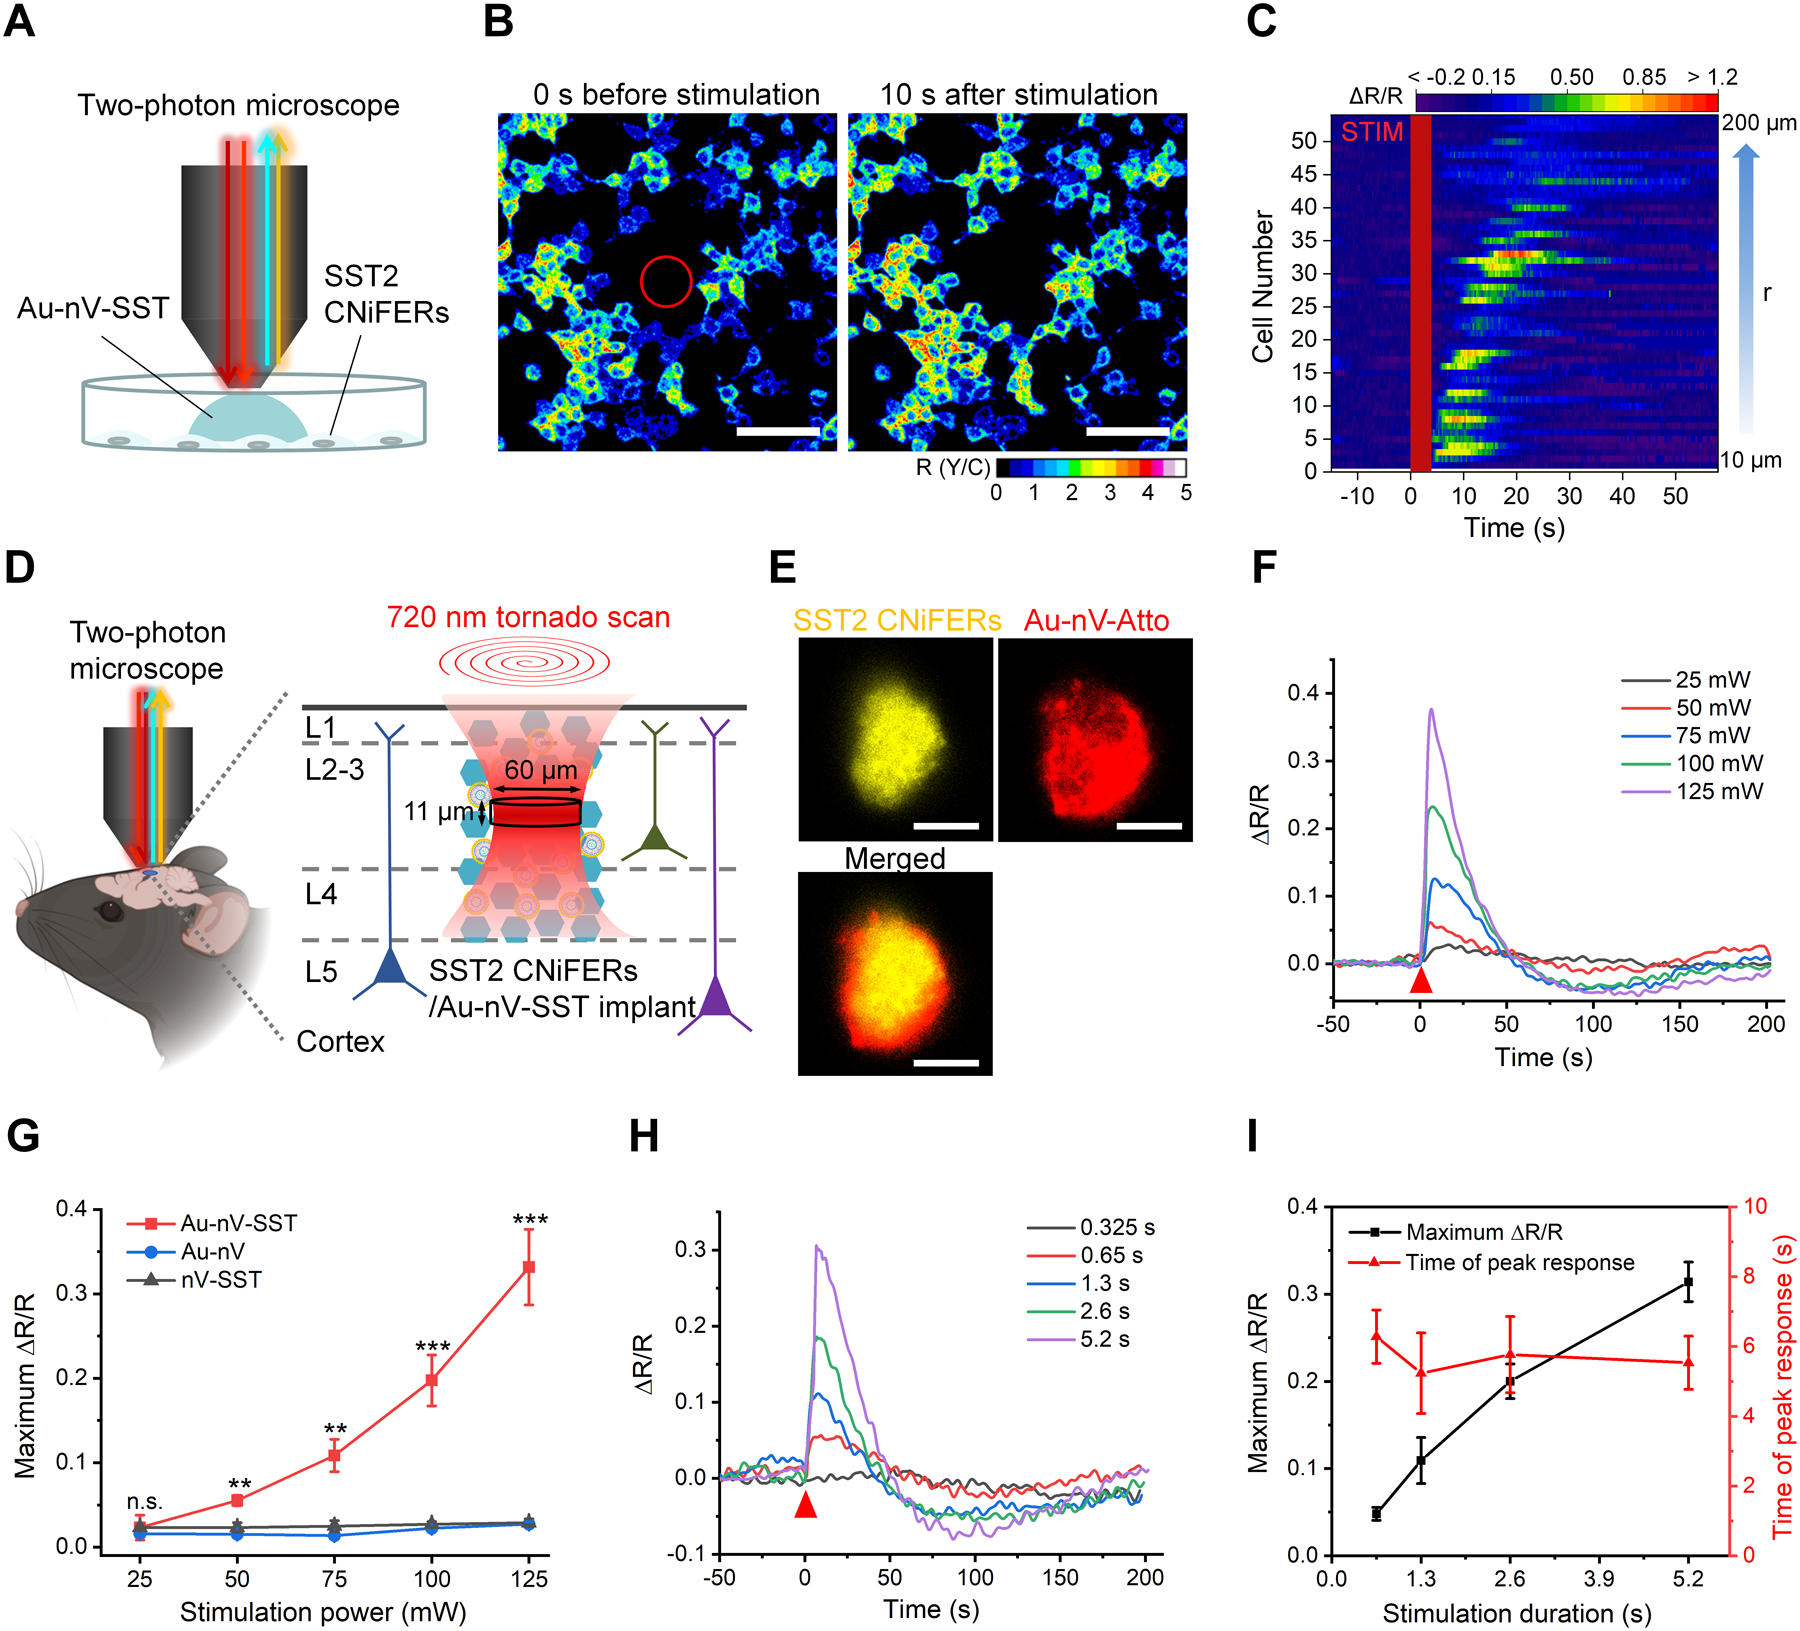
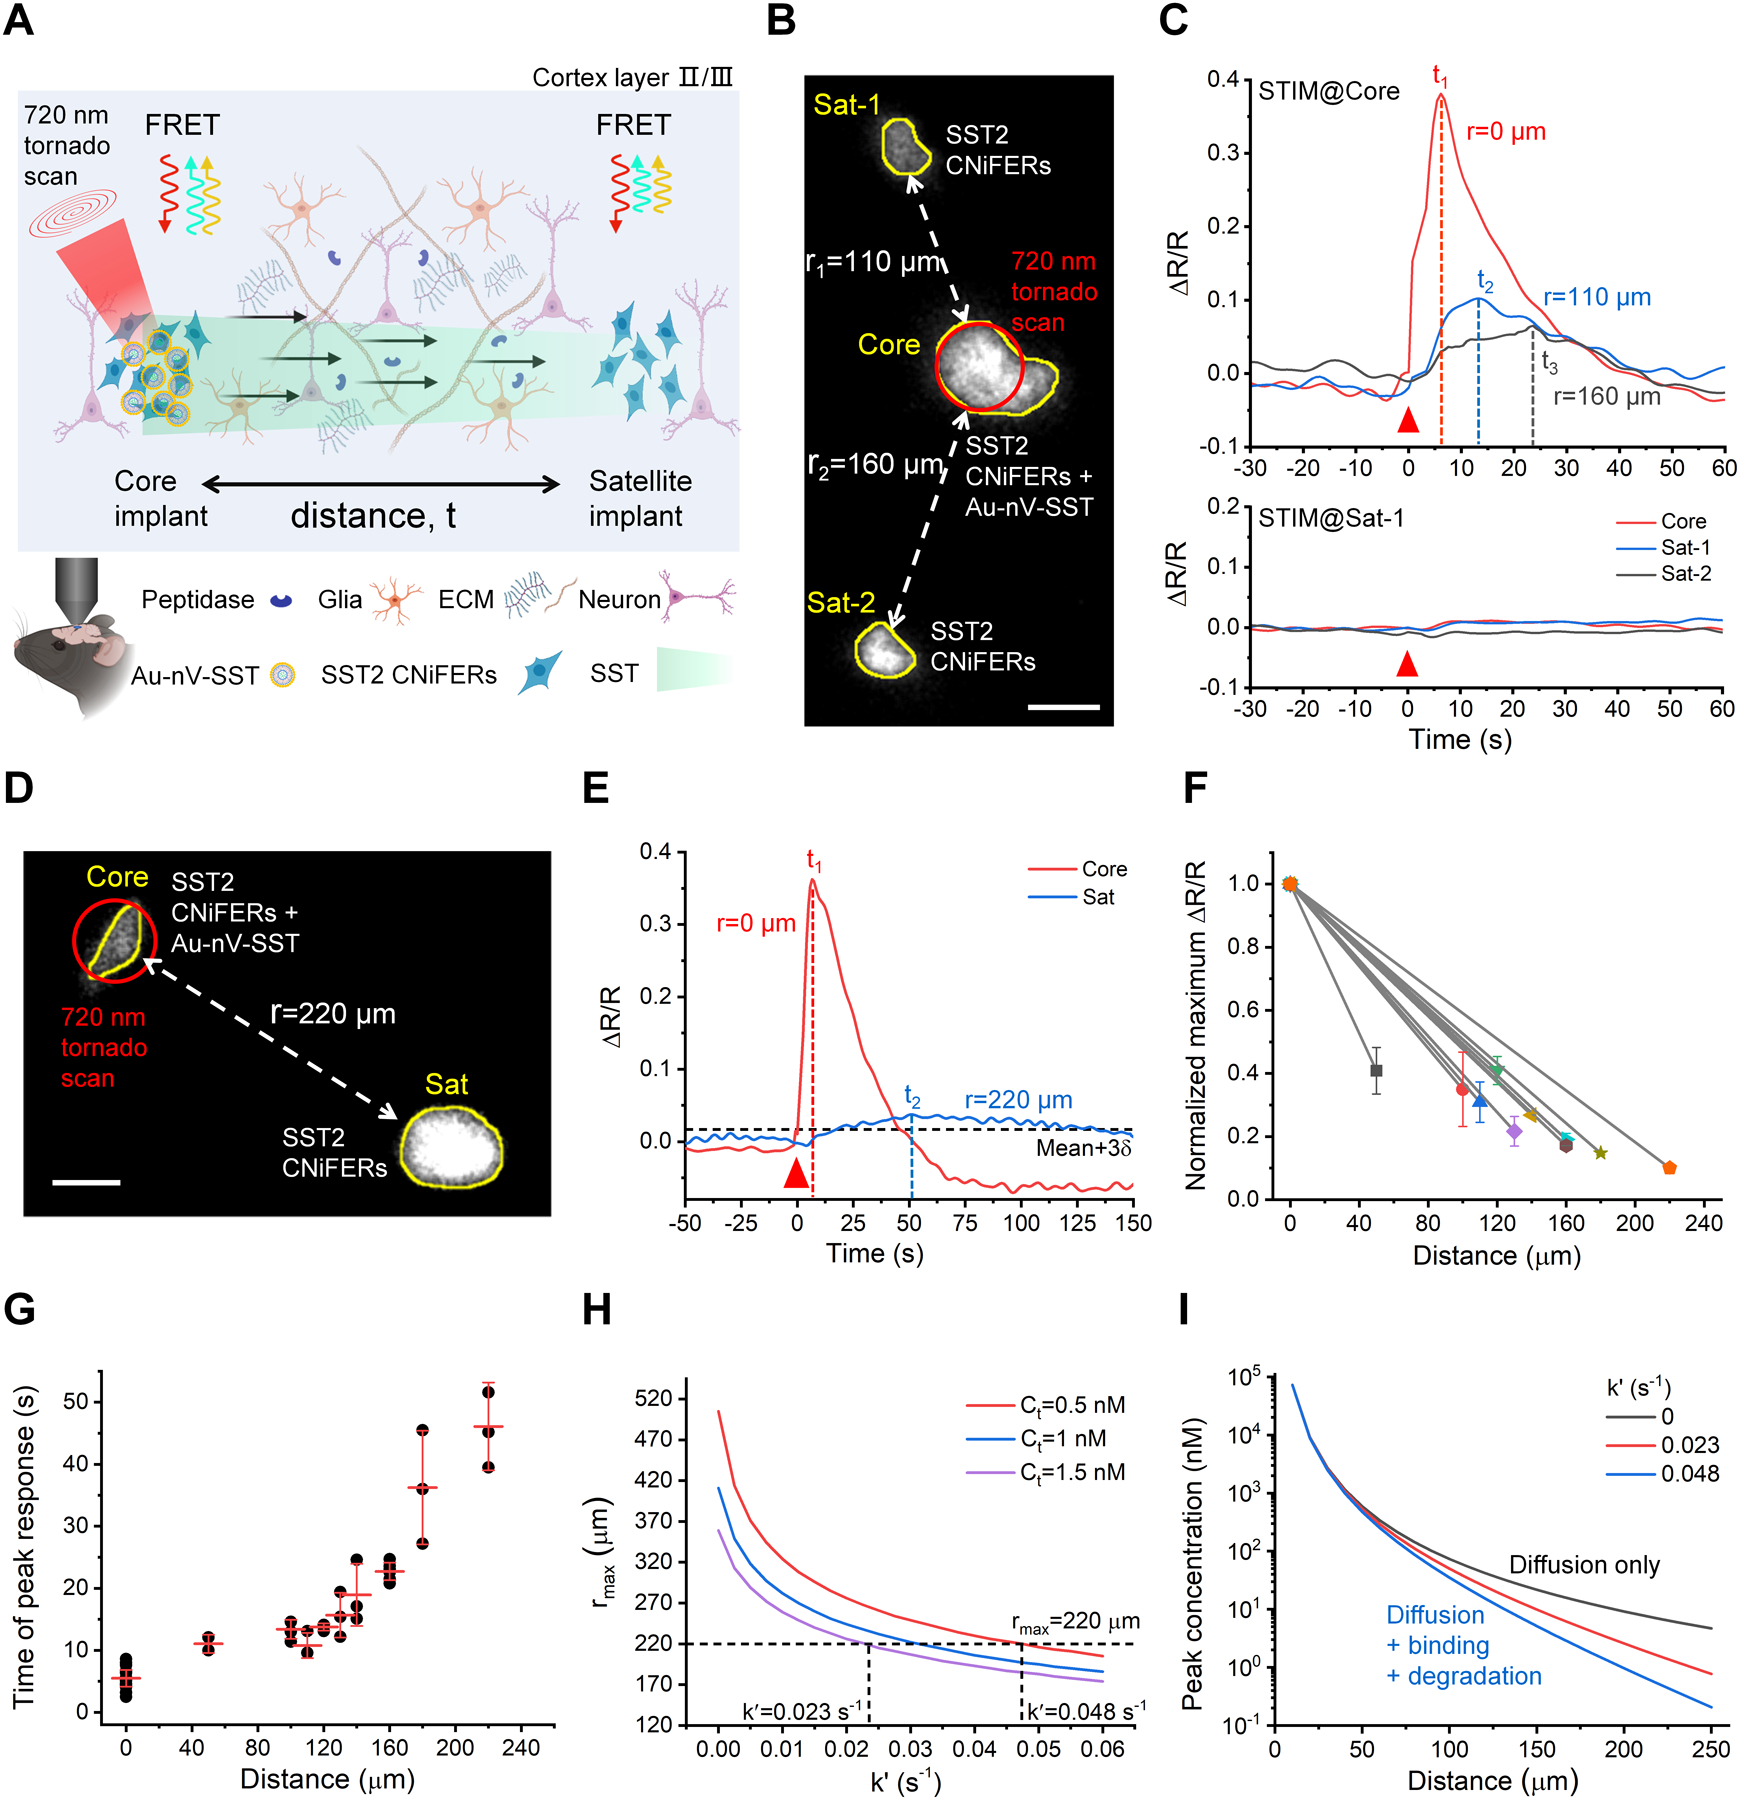
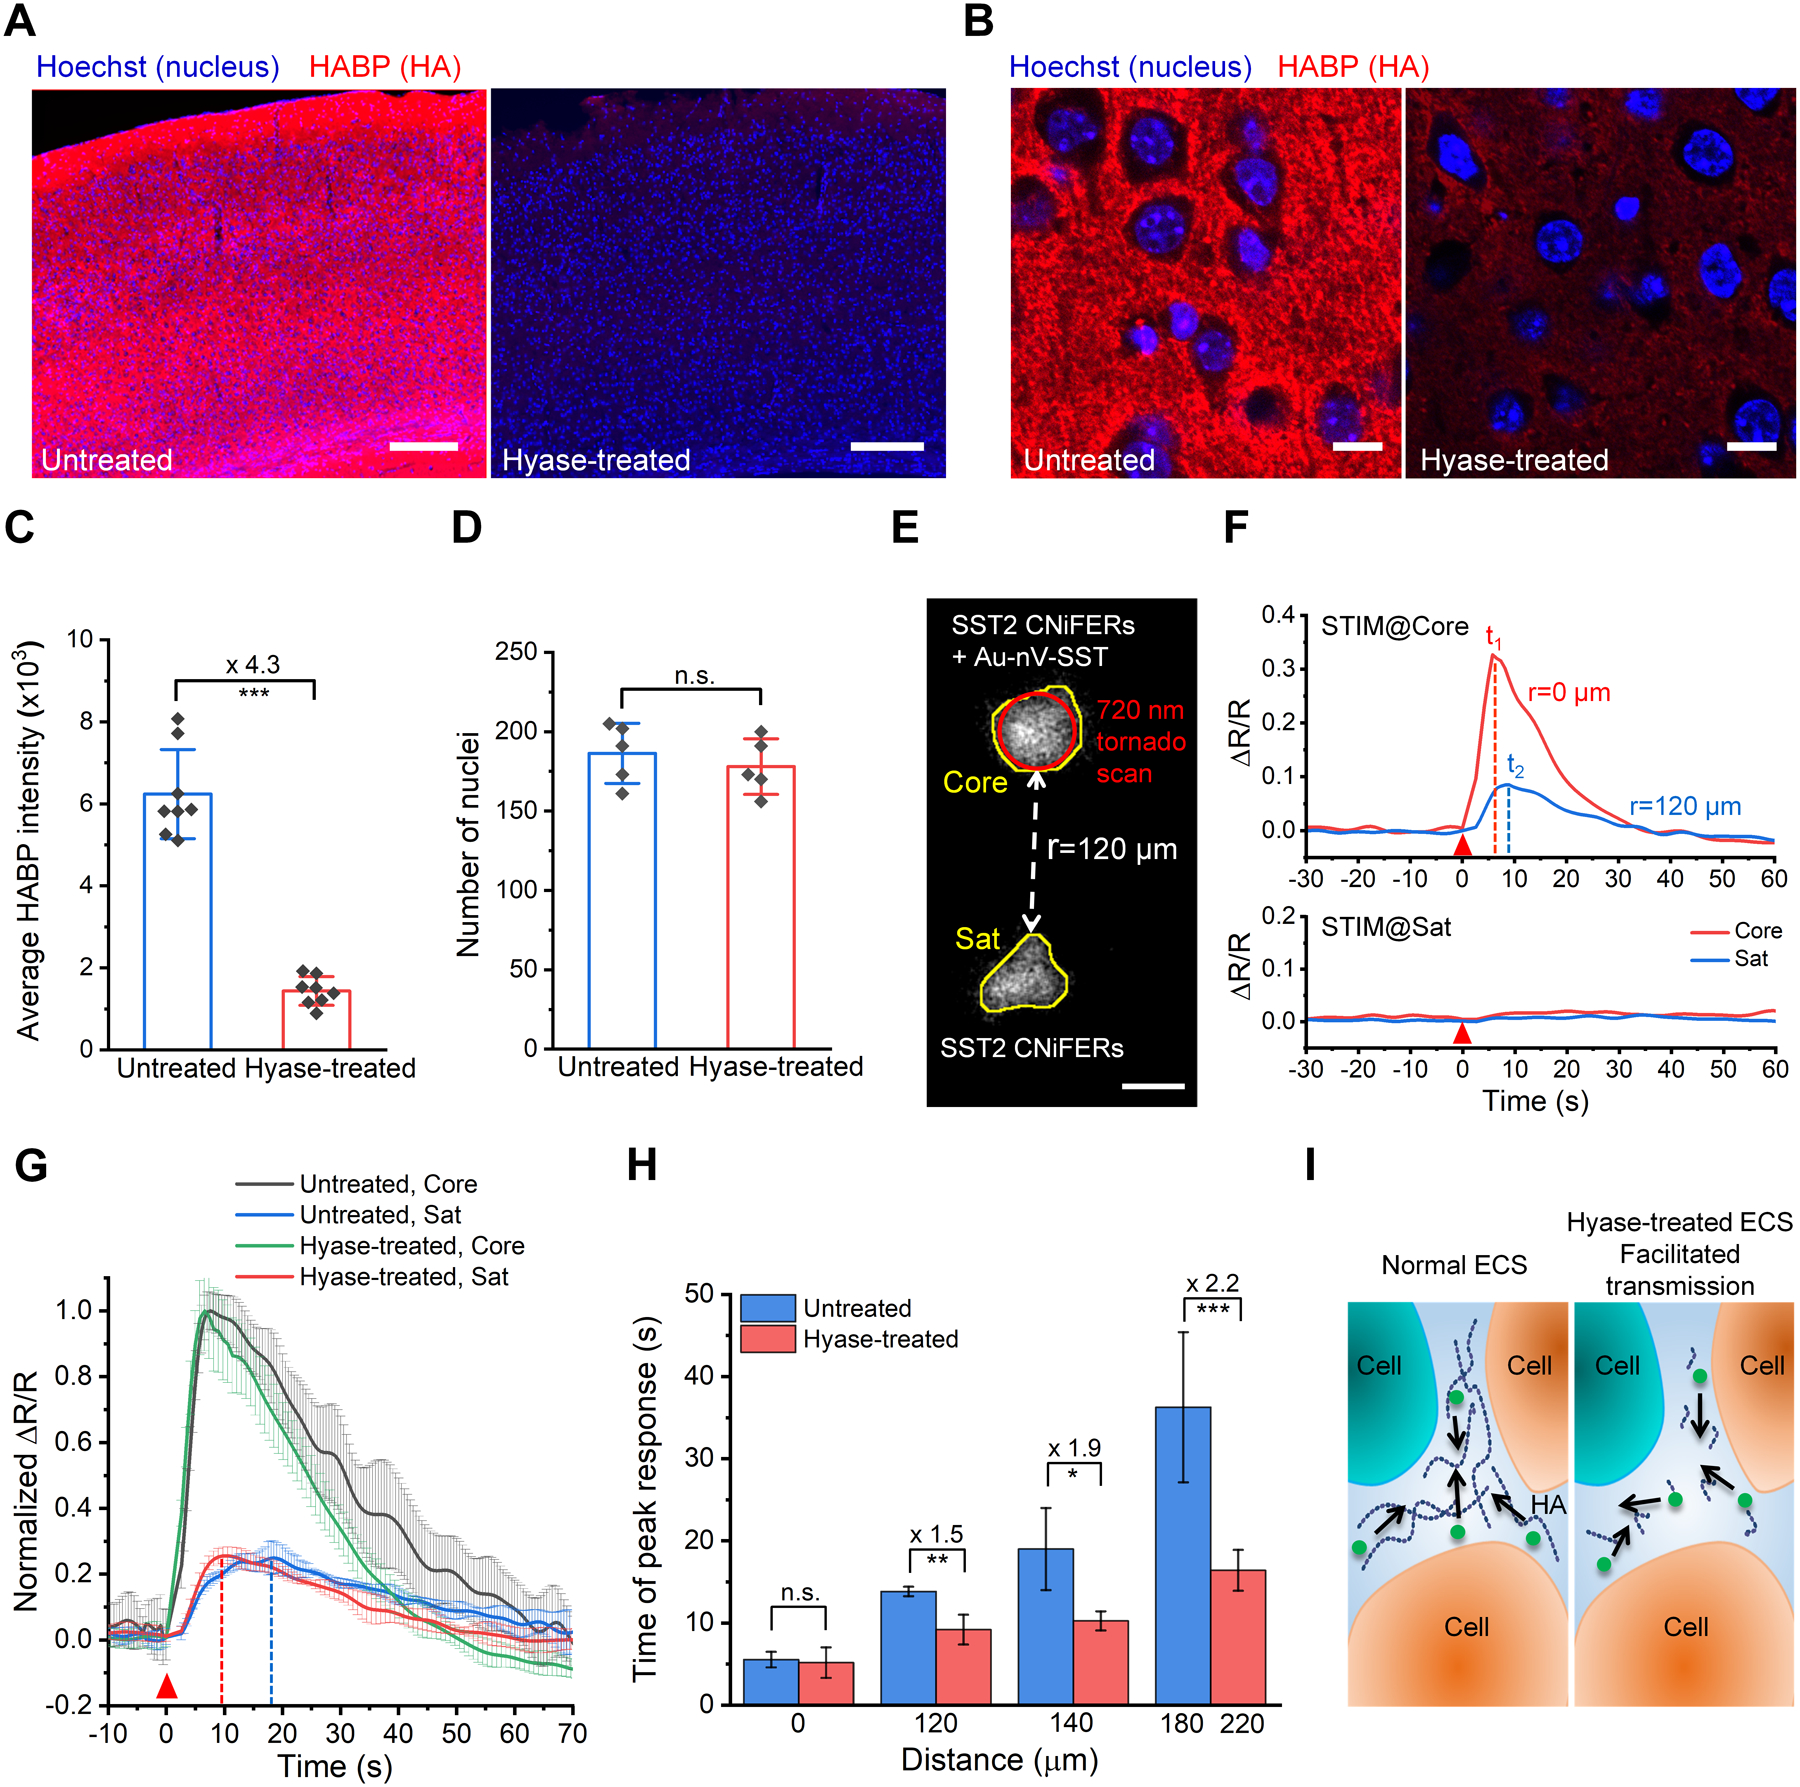
Neuropeptides are abundant signaling molecules in the central nervous system. Yet remarkably little is known about their spatiotemporal spread and biological activity. Here, we developed an integrated optical approach using Plasmonic nAnovesicles and cell-based neurotransmitter fluorescent engineered reporter (CNiFER), or PACE, to probe neuropeptide signaling in the mouse neocortex. Small volumes (fL to pL) of exogenously supplied somatostatin-14 (SST) can be rapidly released under near-infrared light stimulation from nanovesicles implanted in the brain and detected by SST2 CNiFERs with nM sensitivity. Our measurements reveal reduced but synchronized SST transmission within 130 μm, and markedly smaller and delayed transmission at longer distances. These measurements enabled a quantitative estimation of the SST loss rate due to peptide degradation and binding. PACE offers a new tool for determining the spatiotemporal scales of neuropeptide volume transmission and signaling in the brain.

Keywords: Biosensors; Brain; Neuropeptide Release; Neuropeptide Transmission; Plasmonic Nanovesicles.


Conflict of interest statement

Conflict of interest

The authors declare no conflict of interest.

Figures

Figure 1.
Figure 1.
Development and characterization of neuropeptide photoreleasing and sensing techniques. A) Schematic of near-infrared (NIR) femtosecond (fs) laser pulses triggered release from gold-coated somatostatin-14 (SST) loaded nanovesicles (Au-nV-SST). B) UV-Vis spectra of Au-nV-SST and nV-SST. C) Transmission electron microscopy (TEM) image of Au-nV-SST. Scale bar: 20 nm. D) The efficiency and amount of SST released from nanovesicles under the irradiation of 720 nm fs laser pulses (n = 3). Duration (0.175 s, 0.35 s, 1.4 s) of photostimulation refers to the scan number (5, 10, 40). E) Release of calcein under stimulation conditions (100 mW, 10 tornado scans, 0.65 s, 700–820 nm) and imaging conditions (15 mW, resonant scans, 8 minutes, 840–1000 nm) (n = 5). F) Release kinetics of calcein from nanovesicles stimulated at 720 nm for 65 ms (n = 5). G) Schematic of SST2 CNiFER signaling pathway. SST activates SST2 GPCR to induce Ca2+ cytoplasmic influx detected by the FRET-based genetically encoded Ca2+ detector (Twitch 2B). Twitch 2B contains mCerulean3 (CFP) and cpVenusCD (YFP). H) FRET response from SST2 and control CNiFERs after application of 100 nM SST (red bar). Response in CFP (cyan) and YFP (yellow) fluorescence (top) leads to the change in FRET ratio (ΔR/R, bottom). I) Dose-response curve for SST2 (n = 4) and control (n = 3) CNiFERs. The smooth curve shows the best fit with the Hill equation, with the indicated EC50 and Hill coefficient. J) The FRET response is shown for SST2 CNiFERs and control CNiFERs activated by 5 nM SST in the presence of different concentrations CYN 154806, a SST2 receptor antagonist. K) FRET response for SST2 CNiFER with repeated 30 s applications of SST (5 nM, n = 4). L) FRET response with the indicated peptides and classical neurotransmitters (NTs) at three different concentrations for SST2 CNiFERs (n = 3–6) and control CNiFERs (n = 3–6). Data are expressed as Mean ± S.D.
Figure 2.
Figure 2.
Real-time photorelease and monitoring of SST. A) Schematic of photoreleasing and monitoring SST on cultured SST2 CNiFERs with a two-photon microscope. B) Representative images of the ratio of YFP and CFP (R(Y/C)) of SST2 CNiFERs before and after laser stimulation on Au-nV-SST (720 nm, 300 mW, 4 s). Tornado scans with a diameter of 60 μm were performed in the center (marked as a red circle) at 0 s. Scale bar: 100 μm. C) Heat map of FRET response (ΔR/R) for activated CNiFERs. STIM represents the photo-stimulation at 0 s. Cell number was sorted by the distance (r) from the center. D) Schematic of implantation of co-mingled SST2 CNiFERs/Au-nV-SST mixture into mouse cortex. Au-nV-SST was stimulated by tornado scans (diameter: 60 μm) at 720 nm with an axial resolution of 11 μm. E) Representative two-photon fluorescent images of SST2 CNiFERs (Ex: 900 nm; Em: 520–560 nm) and Atto 647N-labeled Au-nV (Ex: 1100 nm; Em: 575–645 nm) at the depth of 200 μm in mouse cortex. Scale bar: 50 μm. F, G) FRET change (ΔR/R) trace (F) and maximum ΔR/R (G) of the SST2 CNiFERs implant under 720 nm laser stimulation with different laser power (2.6 s, n = 3 implants from 3 mice per group). The red triangle indicates the photo-stimulation at 0 s. Au-nV: gold-coated empty nanovesicles. nV-SST: SST-loaded nanovesicles without gold coating. Statistical analysis was conducted by a two-sample Student’s t-test between the Au-nV-SST and control groups (Au-nV, nV-SST). H) FRET change (ΔR/R) for SST2 CNiFERs implants plotted for different scan durations with 720 nm laser stimulation (100 mW). I) The maximum ΔR/R and time of peak response are plotted as a function of stimulation duration (n = 3 implants from 3 mice). No significant differences were found between the two times of peak response at different scan numbers by a two-sample Student’s t-test. Data are expressed as Mean ± S.D.; **p < 0.01; ***p < 0.001; n.s., not significantly different.
Figure 3.
Figure 3.
Measurement of SST volume transmission in vivo. A) Schematic of SST transmission measurement by implanting two clusters of SST2 CNiFERs, in which the core implant (left) is mixed with Au-nV-SST. B) Two-photon fluorescent image of SST2 CNiFERs at a depth of 200 μm in mouse cortex (Ex: 900 nm; Em: 520–560 nm). The implant in the center (Core) was mixed with Au-nV-SST, while the other two satellite implants (Sat-1, Sat-2) were SST2 CNiFERs alone. Scale bar: 50 μm. C) The response curves of SST2 CNiFERs when stimulating (STIM) at different regions (720 nm, 100 mW, 2.6 s). The red triangle indicates the photo-stimulation at 0 s. D) Two-photon fluorescent image of SST2 CNiFER clusters at a distance of 220 μm in mouse cortex. Scale bar: 50 μm. E) The response curves of SST2 CNiFERs when stimulating at the core implant (Core). The threshold of the valid signal is set as Mean + 3δ (δ: the standard deviation of baseline). F) Normalized maximum ΔR/R of paired SST2 CNiFERs implants at different distances in untreated mice brains (n = 10 pairs of implants in 9 mice, 2–4 repeated measurements for a pair of implants). G) Time of peak response from SST2 CNiFER implants at defined distances in untreated mice brains. Photo-stimulation is at 0 s. The centerline represents the mean value. H) Predicted maximal diffusion distance (rmax) as a function of loss rate (k′) from point-source diffusion model (Equation 2) with total SST released number Q = 1.2 × 10⁸ and effective diffusion coefficient D* = 8.9 × 10⁻⁷ cm2•s−1 (from optical integrative imaging measurement). The horizontal dashed line represents the experimental rmax = 220 μm. I) Predicted concentration as a function of distance from Equation 2. Data are expressed as Mean ± S.D.
Figure 4.
Figure 4.
SST volume transmission in hyaluronan-deficient brains. A) Representative images of HABP-labeled (red) brain cortex sections from untreated mouse and hyaluronidase (hyase)-treated mouse. Nuclei were stained by Hoechst 33342 (blue). Scale bar: 200 μm. B) Confocal images of the brain cortex in the left hemisphere with high magnification. Scale bar: 10 μm. C) Average fluorescence intensity for HABP in mouse cortex (0.8 mm × 0.8 mm) of untreated and hyase-treated brains (n = 8 slices). D) Number of nuclei in the cortex of untreated and hyase-treated brains (n = 5 slices). E) Two-photon fluorescent image of SST2 CNiFERs implanted at a depth of 200 μm in mouse cortex. The top implant (Core) has SST2 CNiFERs mixed with Au-nV-SST, while the bottom implant (Sat) contains only SST2 CNiFERs. Scale bar: 50 μm. F) The response curves of SST2 CNiFERs when stimulating (STIM) at different regions (720 nm, 100 mW, 2.6 s). G) Comparison of normalized ΔR/R traces of the core implants (Core) and satellite implants (Sat) at the distance of 140 μm in untreated and hyase-treated brains (n = 3). H) Comparison of time of peak response over different distances in hyase-treated brains (n ≥ 4 measurements for each distance, 6 mice in total) and in untreated brains (acquired from Figure 3G). I) Schematic of the change in brain extracellular space (ECS) and SST volume transmission under different conditions. Data are expressed as Mean ± S.D.; *p < 0.05; **p < 0.01; ***p < 0.001; n.s., not significantly different.

Similar articles

Cited by

References

    1. Nusbaum MP, Blitz DM, Marder E, Nat. Rev. Neurosci 2017, 18, 389–403; - PMC - PubMed
    2. Guillaumin MCC, Burdakov D, Front. Neurosci 2021, 15, 644313. - PMC - PubMed
    1. Smith SJ, Sümbül U, Graybuck LT, Collman F, Seshamani S, Gala R, Gliko O, Elabbady L, Miller JA, Bakken TE, Elife 2019, 8, e47889. - PMC - PubMed
    1. van den Pol AN, Neuron 2012, 76, 98–115. - PMC - PubMed
    1. Syková E, Nicholson C, Physiol. Rev 2008, 88, 1277–1340; - PMC - PubMed
    2. Tønnesen J, Inavalli VVGK, Nägerl UV, Cell 2018, 172, 1108–1121; - PubMed
    3. Godin AG, Varela JA, Gao Z, Danné N, Dupuis JP, Lounis B, Groc L, Cognet L, Nat. Nanotechnol 2017, 12, 238–243. - PubMed
    1. Lacin E, Muller A, Fernando M, Kleinfeld D, Slesinger PA, J. Vis. Exp 2016, e53290; - PMC - PubMed
    2. Muller A, Joseph V, Slesinger PA, Kleinfeld D, Nat. Methods 2014, 11, 1245–1252; - PMC - PubMed
    3. Foo C, Lozada A, Aljadeff J, Li Y, Wang JW, Slesinger PA, Kleinfeld D, Curr. Biol 2021, 31, 4111–4119. - PMC - PubMed

Publication types

LinkOut - more resources