. 2022 Aug 5;12(8):1960-1983.
doi: 10.1158/2159-8290.CD-20-1628.

IL27 Signaling Serves as an Immunologic Checkpoint for Innate Cytotoxic Cells to Promote Hepatocellular Carcinoma

Affiliations

IL27 Signaling Serves as an Immunologic Checkpoint for Innate Cytotoxic Cells to Promote Hepatocellular Carcinoma

Turan Aghayev et al. Cancer Discov. .

Abstract

Although inflammatory mechanisms driving hepatocellular carcinoma (HCC) have been proposed, the regulators of anticancer immunity in HCC remain poorly understood. We found that IL27 receptor (IL27R) signaling promotes HCC development in vivo. High IL27EBI3 cytokine or IL27RA expression correlated with poor prognosis for patients with HCC. Loss of IL27R suppressed HCC in vivo in two different models of hepatocarcinogenesis. Mechanistically, IL27R sig-naling within the tumor microenvironment restrains the cytotoxicity of innate cytotoxic lymphocytes. IL27R ablation enhanced their accumulation and activation, whereas depletion or functional impairment of innate cytotoxic cells abrogated the effect of IL27R disruption. Pharmacologic neutralization of IL27 signaling increased infiltration of innate cytotoxic lymphocytes with upregulated cytotoxic molecules and reduced HCC development. Our data reveal an unexpected role of IL27R signaling as an immunologic checkpoint regulating innate cytotoxic lymphocytes and promoting HCC of different etiologies, thus indicating a therapeutic potential for IL27 pathway blockade in HCC.

Significance: HCC, the most common form of liver cancer, is characterized by a poor survival rate and limited treatment options. The discovery of a novel IL27-dependent mechanism controlling anticancer cytotoxic immune response will pave the road for new treatment options for this devastating disease. This article is highlighted in the In This Issue feature, p. 1825.


Figures

Figure 1.
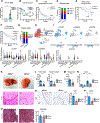
Figure 1.. IL-27 signaling regulates liver cancer development.
A, Serum EBI3 levels in healthy controls (n=11, mean EBI3 level=0.36) and HCC patients (n=130, mean EBI3 level=16.33, CHUM cohort). B, Correlation between serum EBI3 level and overall survival of 130 HCC patients from CHUM cohort. Overall survival curves were generated based on serum EBI3 levels and separated by tertiles. Statistics were calculated by log-rank test: EBI3 med, hazard ratio (95% CI) = 2.25 (0.93–5.45), p value=0.047; EBI3 high, hazard ratio (95% CI) = 3.69 (1.82–7.47), p value = 0.0002. C, TCGA provisional data on disease-free Kaplan-Meier estimate (disease free status since initial treatment) relative to IL27RA expression in HCC tumors. Top 25% expression cutoff (IL27RA “high”) and lower 75% expression (IL27RA “norm”) were used to define correlation between IL27RA expression in the tumors and disease free survival. D, The distribution of clinical stage upon diagnosis among patients with “high”- and “norm”-IL27RA expression in TCGA cohort. E,F, Kaplan-Meier survival analysis of 70 HCC patients in SNU cohort (GSE15765) (E) and 226 HCC patients in LCI cohort (GSE14520) (F) based on tumor IL27RA expression status with two-sided log rank p-value. For SNU cohort ROC curve analysis with Youden index was used to identify the best cutoff value of IL27RA associates with overall survival and this value was used to define “high” (higher expression)- and ”norm” (lower expression)-IL27RA tumor. For LCI cohort, IL27RA expression of tumor tissue was compared to its paired non-tumor tissue, and tumors with the top 25% of IL27RA tumor-to-non-tumor ratio were defined as “high” IL27RA tumors. G, The distribution of clinical stage upon diagnosis among patients with “high”- and “norm”-IL27RA expression in the LCI cohort. H, Single Cell RNA seq analysis of sorted CD45+ cells from human HCC using 10× Genomics platform. UMAP plot is presented. Annotations are derived from cluster specific analysis (Zhang et al. Cell 2019 (43)). I, UMAP plots of cell type specific expression pattern for IL27RA, IL27EBI3 and IL27P28 among CD45+ clusters from human HCC shown in H. J, Violin plots of IL27RA, IL27EBI3, IL27P28 expression among clusters. K, Il27ra+/− and Il27ra−/− mice received DEN at postnatal day 15. HCC development was analyzed at 10 months of age. Representative images of macroscopic and microscopic views of tumor bearing livers. L, Tumor load and tumor number in Il27ra+/− (n=15) and Il27ra−/− (n=12) mice. M, Concentration of ALT in sera from Il27ra+/− (n=8) and Il27ra−/− (n=6) tumor-bearing 10-month-old mice. N, Relative gene expression of inflammatory marker Lcn2 in non-tumor and tumor tissues from Il27ra+/− (n=5) and Il27ra−/− (n=6) mice. O, Representative images and quantification of Ki67 staining of HCC sections from DEN-treated Il27ra+/− (n=4) and Il27ra−/− (n=4) mice. P, Relative gene expression of proliferation marker Cyclin D (Ccnd1) in tumors from Il27ra+/− (n=6) and Il27ra−/− (n=6) mice. Q, Representative images and quantification of Trichrome staining of HCC sections from DEN-treated Il27ra+/− (n=6) and Il27ra−/− (n=6) mice. For relative gene expression it was first normalized to Rpl32 then to gene expression in tumors from Il27ra+/− mice. Data are mean ± SEM from at least 3 independent experiments. *p<0.05, **p<0.01, ***p<0.001, unpaired Student’s t-test (two-tailed); **p<0.01, ***p<0.001, Tukey’s multiple comparisons test.
Figure 2.
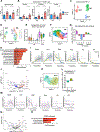
Figure 2.. IL-27R signaling regulates NK cell accumulation and function in HCC.
A-C, Differential gene expression analysis of HCC tumors from DEN-treated Il27ra+/− (n=6) and Il27ra−/− (n=6) mice as determined by NanoString, Cancer Immunopanel, (p<0.05). A, KEGG pathway analysis of differentially expressed genes. B, GSEA enrichment plots for NK genes signatures in tumor of DEN-treated Il27ra−/− mice compared to Il27ra+/− controls. C, Violin plot for enrichment of subset-specific gene expression in tumors from Il27ra−/− mice (see Methods for details). D, Il15 gene expression in non-tumor (NT) and tumor (T) tissue as determined by Q-RT-PCR. Gene expression was first normalized to Rpl32 then to gene expression in non-tumor tissue from Il27ra+/− mice. **p<0.01, unpaired Student’s t-test (two-tailed). Single cell suspensions of non-tumor and tumor tissues from Il27ra+/− (n=5) and Il27ra−/− (n=5). DEN-injected 10-month-old mice were stained for Live/Dead, CD45, TCRβ, NK1.1, CD49a and CD49b analyzed by FACS. E,F, Representative FACS plots (E) and quantified percentage of NK1.1+ TCRβ cells in CD45+ gate (F); and G, H, CD49a+NK1.1+ and CD49b+NK1.1+ cells in NK1.1+TCRβ gate in NT and T tissues of DEN-treated Il27ra+/− (n=5) and Il27ra−/− (n=5) mice. Data are mean ± SEM from at least 2 independent experiments. I, Correlation between presence of NK cells in tumors and IL27RA, IL27EBI3, IL27P28 expression in TCGA HCC cohort. Expression of IL27RA or IL27EBI3 in tumors with “high” abundance of NK cells (NK+)(n=100); or low abundance of NK cells (NK−) (n=269) as determined by CIBERSORT. J, Correlation of activated NK cell signature with IL27RA expression in scRNA seq of human HCC (GSE151530; Ma et al. Cancer Cell, 2019, (53)).
Figure 3.
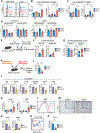
Figure 3.. IL-27R signaling regulates activation and cytotoxicity of innate cytotoxic cells.
A, FACS analysis for Granzyme B expression in NK1.1+TCRβ cells in NT and T tissues from Il27ra+/− and Il27ra−/− mice (n=6). B, Q-RT-PCR analysis of relative gene expression for Gzmb, Trnsf10 and Cxcr6 in NK1.1+TCRβ FACS-sorted cells from non-tumor and tumor tissue of Il27ra+/− and Il27ra−/− mice (n=6). Gene expression was first normalized to Rpl32 then to gene expression of NK cells in non-tumor tissue from Il27ra+/− mice. Data are mean ± SEM from at least 3 independent experiments. *p<0.05. **p<0.01, Tukey’s multiple comparisons test. C-O, Non-tumor and tumor tissue from DEN-treated Il27ra+/− and Il27ra−/− mice were dissociated into single cell suspension and FACS sorted for CD45+NK1.1+ and applied for 10× Genomics Chromium droplet platform for cell isolation and sequencing. Cells were clustered by differential gene expression. C, UMAP of 9511 sorted CD45+NK1.1+ cells with identified clusters. D, UMAP of ILC1 and NK cells clusters. E, Permanova p-value plot of differential gene expression between Il27ra+/− and Il27ra−/− among clusters of tumor ILC1 and NK cells. F, Slingshot trajectory analysis for NK cell clusters. G, Normalized cell numbers representing upregulated and downregulated clusters among NK cells in Il27ra−/− versus Il27ra+/−. H, KEGG pathway analysis of differentially expressed genes along the trajectory of NK clusters. I, Pseudotemporal ordering of NK single cell transcriptomes with Slingshot. Expression of selected genes alone the pseudotime. J, Volcano plot of differentially expressed genes between Il27ra−/− and Il27ra+/− NK clusters from tumors; upregulated in Il27ra−/− (red), downregulated (blue). K, Slingshot trajectory analysis for ILC1 cells. L, Normalized cell numbers representing upregulated and downregulated clusters among ILC1 cells in Il27ra−/− versus Il27ra+/−. M, Pseudotemporal ordering of ILC1 single cell transcriptomes with Slingshot. Expression of selected genes along the pseudotime. N, Volcano plot of differentially expressed genes between tumor Il27ra−/− and Il27ra+/− ILC1 clusters; upregulated in Il27ra−/− (red), downregulated (blue). O, KEGG pathway analysis of differentially expressed genes along the trajectory of ILC1 clusters.
Figure 4.
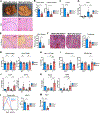
Figure 4.. IL-27R signaling regulates NK cell activation and cytotoxicity.
A, Representative histogram of FACS analysis for NKG2D activating receptor expression. Mean fluorescence intensity (MFI) and percentage of NKG2D+ (B) and Ly49C+ (C) cells among CD49b+ NK1.1+ NK cells in non-tumor and tumor tissue from DEN-injected Il27ra+/− and Il27ra−/− mice (n=4). D, Single cell suspensions of non-tumor (NT) and tumor (T) tissue from DEN-injected Il27ra+/− (n=7) and Il27ra−/− mice (n=4) were analyzed by FACS. Percentage of immature (CD11bCD27 and CD11bCD27+) and mature (CD11b+CD27+ and CD11b+CD27) cells among NK1.1+TCRβ NK cells. E, Scheme for cytotoxicity and degranulation assays. F, Cytotoxic activity of liver and splenic NK cells sorted by negative selection from Il27ra+/− (n=5) and Il27ra−/− (n=5) and co-cultured with target cancer cells. Percentage of dead target cells is shown. G, FACS analysis for surface CD107a as a marker of degranulation on sorted liver CD49a+ (ILC1) and CD49b+ (NK) cells from Il27ra+/− (n=5) and Il27ra−/− (n=3) mice, which were co-cultured with target cells. H, Scheme for in vivo cytotoxicity experiment. RMA-S (sensitive to NK killing) and RMA (insensitive) cell lines were dye-labelled, mixed in 1:1 ratio and injected i.p. into 8-week-old Il27ra+/− and Il27ra−/− mice; cell recovery was analyzed 48h later. I, Percentage of RMA-S cells from peritoneal lavage of Il27ra+/− (n=6) and Il27ra−/− (n=6) mice. J, Q-RT-PCR analysis of relative gene expression of NK cell related genes in CD49b+ NK cells sorted by magnetic bead positive selection from liver of wild type mice (n=8) and stimulated in vitro with rIL27. Gene expression was first normalized to Rpl32, then to gene expression in untreated conditions. K, Relative gene expression of stress molecules Raet1 and H60b in NT and T tissues from DEN-injected Il27ra+/− and Il27ra−/− mice (n=4). L, FACS analysis and representative histogram of H60B expression on CD45-negative cells from tumors of Il27ra+/− and Il27ra−/− mice. M, Representative images of IHC RAE-1 staining of tumor-bearing livers of DEN-injected Il27ra+/− and Il27ra−/− mice. N, Relative gene expression (Q-RT-PCR) of Raet1 and H60b in DEN-derived HCC cells treated in vitro with rIL27 (normalized to Rpl32 and then to gene expression in untreated conditions). O, FACS analysis of MHCI/H-2Kb expression on CD45-negative cells from tumors of DEN-injected Il27ra+/− and Il27ra−/− 10-month-old mice. P, Relative gene expression (Q-RT-PCR; normalized to Rpl32 and then to expression in tumor tissue of Il27ra+/− mice) of Tap1 gene in tumor tissue of Il27ra+/− and Il27ra−/− mice (n=4). Data are mean ± SEM from at least 3 independent experiments. Tukey’s multiple comparisons test (D); *p<0.05. **p<0.01, unpaired Student’s t-test (two-tailed).
Figure 5.
Figure 5.. IL-27R signaling promotes tumor growth in NASH-driven HCC.
8-week-old MUP-uPA+Il27ra−/− and MUP-uPA+Il27ra+/− control mice were fed with a WD for 8 months. A, Representative macroscopic and microscopic (H&E staining) images of livers with tumors. B, Tumor load and tumor number of MUP-uPA+Il27ra+/− (n=7) and MUP-uPA+Il27ra−/− (n=7) male mice. Q-RT-PCR analysis of relative gene expression of Ccnd1 (C) and Lcn2 (D) in non-tumor (NT) and tumor (T) tissue from MUP-uPA+ l27ra+/− (n=6) and MUP-uPA+Il27ra−/− (n=6) male mice. E,F, Histological analysis and quantification of collagen content determined by Van Gieson (E) or Trichrome (F) staining of liver sections from MUP-uPA+Il27ra+/− and MUP-uPA+Il27ra−/− male mice. G-I, FACS analysis of CD45+ immune cells in NT and T tissue of MUP-uPA+Il27ra+/− and MUP-uPA+Il27ra−/− mice. G, Percentage of CD8α+TCRβ+ and CD4+TCRβ+ cells among CD45+ populations. H and I, Percentage of NK1.1+TCR β+ (H) and CD49a+ NK1.1+ and CD49b+ NK1.1+ (I) cells among CD45+ populations in NT and T tissues of MUP-uPA+Il27ra+/− and MUP-uPA+Il27ra−/− mice (n=4–6). J ,K, Q-RT-PCR analysis of relative gene expression of Cxcr6, Gzmb (J) and Raet1, H60b (K) in NT and T tissues from MUP-uPA+Il27ra+/− and MUP-uPA+Il27ra−/− mice (n=6–13). L, FACS analysis of MHC I expression on CD45CD31TER119 tumor cells from MUP-uPA+Il27ra+/− and MUP-uPA+Il27ra−/− mice (n=4). Representative histogram and MFI of expression are presented. M, Q-RT-PCR analysis of relative gene expression of Tap1 in tumors from MUP-uPA+Il27ra+/− and MUP-uPA+Il27ra−/− female and male mice (n=6). C, M, Gene expression was first normalized to Rpl32 then to that in tumor tissue from MUP-uPA+Il27ra+/− mice. D,J,K, Gene expression was first normalized to Rpl32 then to gene expression in non-tumor tissue of MUP-uPA+Il27ra+/− mice. Data are mean ± SEM from at least 3 independent experiments. *p<0.05. **p<0.01, ***p<0.001, unpaired Student’s t-test (two-tailed); Tukey’s multiple comparisons test.
Figure 6.
Figure 6.. IL-27R signaling exerts its action via innate cytotoxic lymphocytes.
DEN-treated Il27ra+/− and Il27ra−/− mice were administered with anti-NK1.1 or IgG isotype control antibodies for 5.5 months prior to tumor development analysis at 10 months. A, Representative images of macroscopic and microscopic view of tumor-bearing livers. B, Tumor load and tumor number in IgG treatment group: Il27ra+/− (n=6), Il27ra−/− (n=6) and anti-NK1.1 treatment group: Il27ra+/− (n=10), Il27ra−/−(n=7) mice. C, Representative images and quantification of α-SMA staining of HCC sections from DEN-treated Il27ra+/− (n=3) and Il27ra−/− (n=3) mice injected with anti-NK1.1 antibody or isotype control. D, Mean fluorescence intensity (MFI) of NKp46 surface expression on NK1.1+TCRβ cells from livers of Il27ra+/− and Il27ra−/− mice as determined by FACS (n=4). E, Q-RT-PCR analysis of Ncr1 (NKp46) gene expression in CD49b+ NK cells purified from spleens of WT naïve mice and stimulated in vitro with rIL27 (n=3). Gene expression was first normalized to Rpl32 then to gene expression in untreated condition. F, Representative images of macroscopic view of tumor-bearing livers from Ncr1+/gfpIl27ra+/− and Ncr1+/gfpIl27ra−/− DEN-treated mice analyzed at 10 months of age. G, Tumor load and tumor number among Ncr1+/gfpIl27ra+/− (n=7) and Ncr1+/gfpIl27ra−/− (n=6) mice compared to Il27ra+/− (n=15) and Il27ra−/− (n=12) mice from the cohorts shown on Figure 1K. Data are mean ± SEM from at least 3 independent experiments. *p<0.05, **p<0.01, unpaired Student’s t-test (two-tailed).
Figure 7.
Figure 7.. Pharmacologic blockade of IL-27 or IL-27R suppresses HCC tumor growth in NASH model.
A, 8-week-old MUP-uPA+ mice were fed a WD for 8 months and received IgG or anti-IL-27 (SRF381) for 3.5 months prior to assessment of tumor development at 10 months. B, Representative images of macroscopic and microscopic view of tumor bearing livers. C, Tumor load and tumor number of IgG isotype control (n=10) and anti-IL-27 (n=11) treated mice. Representative images and quantification of fibrosis (collagen content) as determined by Trichrome staining (D) and α-SMA staining (E) of liver sections from MUP-uPA+ mice that received IgG isotype control (n=4) or anti-IL-27 (n=4) treatment. Single cell suspensions of livers from mice that received IgG isotype control (n=6–7) or anti-IL-27 (n=6–7) treatment were analyzed by FACS. Percentage of CD4+TCRβ+ and CD8α+TCRβ+ cells (F) and NK1.1+TCR β cells (G) among CD45+ populations is presented. H, Q-RT-PCR analysis of relative gene expression of Gzmb, Tnfsf10, Klrk1, Cxcr6 and Ncr1 in NT and T tissue from IgG (n=10–15) and anti-IL-27 (n=10–17) mice. I, 8-week-old MUP-uPA+ mice were fed a WD for 8 months and received IgG or anti-IL-27R for 4 months prior to assessment of tumor development at 10 months. J, Representative macroscopic images of livers with developed tumors. K, Tumor load and tumor number of IgG group (n=8) and anti-IL-27R (n=10) mice. Data are mean ± SEM from at least 3 independent experiments. *p<0.05. **p<0.01, ***p<0.001, unpaired Student’s t-test (two-tailed).

References

    1. Balogh J, Victor D 3rd, Asham EH, Burroughs SG, Boktour M, Saharia A, et al. Hepatocellular carcinoma: a review. J Hepatocell Carcinoma 2016;3:41–53 doi 10.2147/JHC.S61146. - DOI - PMC - PubMed
    1. Yang JD, Hainaut P, Gores GJ, Amadou A, Plymoth A, Roberts LR. A global view of hepatocellular carcinoma: trends, risk, prevention and management. Nat Rev Gastroenterol Hepatol 2019;16(10):589–604 doi 10.1038/s41575-019-0186-y. - DOI - PMC - PubMed
    1. Roma-Rodrigues C, Mendes R, Baptista PV, Fernandes AR. Targeting Tumor Microenvironment for Cancer Therapy. Int J Mol Sci 2019;20(4) doi 10.3390/ijms20040840. - DOI - PMC - PubMed
    1. Zhong S, Jeong JH, Chen Z, Chen Z, Luo JL. Targeting Tumor Microenvironment by Small-Molecule Inhibitors. Transl Oncol 2020;13(1):57–69 doi 10.1016/j.tranon.2019.10.001. - DOI - PMC - PubMed
    1. Mahipal A, Tella SH, Kommalapati A, Lim A, Kim R. Immunotherapy in Hepatocellular Carcinoma: Is There a Light at the End of the Tunnel? Cancers (Basel) 2019;11(8) doi 10.3390/cancers11081078. - DOI - PMC - PubMed

Publication types

MeSH terms