

Maternal plasma cytokines and the subsequent risk of uterine atony and postpartum hemorrhage
- PMID: 35724639
- PMCID: PMC9768104
- DOI: 10.1515/jpm-2022-0211
Maternal plasma cytokines and the subsequent risk of uterine atony and postpartum hemorrhage
Abstract
Objectives: To determine whether the maternal plasma concentrations of cytokines are higher in pregnant women with postpartum hemorrhage (PPH) compared to pregnant women without PPH.
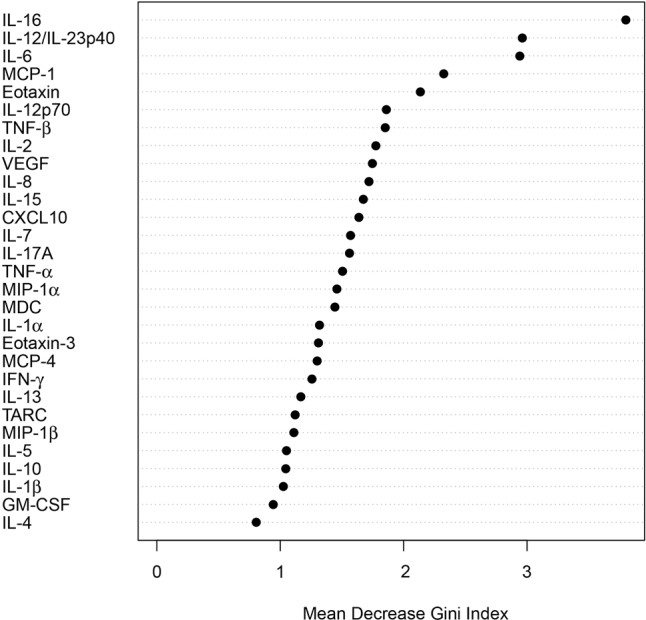
Methods: A retrospective case-control study included 36 women with PPH and 72 matched controls. Cases and controls were matched for gestational age at delivery, labor status, delivery route, parity, and year of sample collection. Maternal plasma samples were collected up to 3 days prior to delivery. Comparison of the plasma concentrations of 29 cytokines was performed by using linear mixed-effects models and included adjustment for covariates and multiple testing. A false discovery rate adjusted p-value <0.1 was used to infer significance. Random forest models with evaluation by leave-one-out and 9-fold cross-validation were used to assess the combined value of the proteins in predicting PPH.
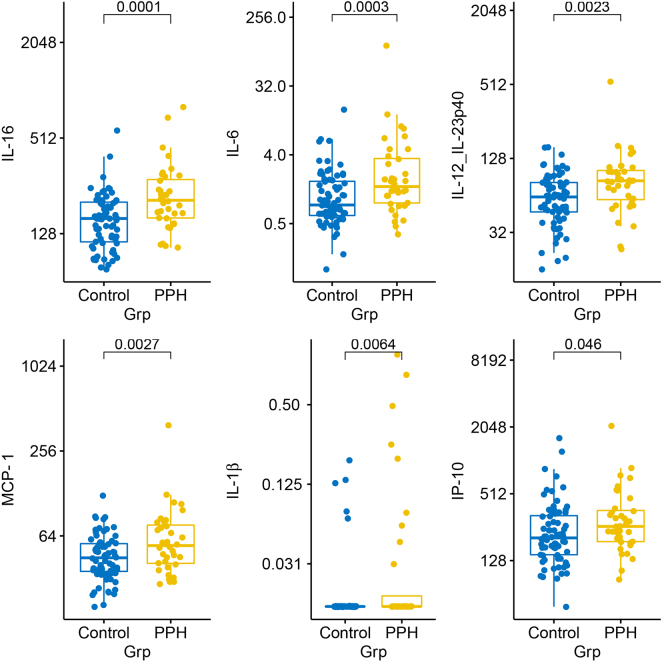
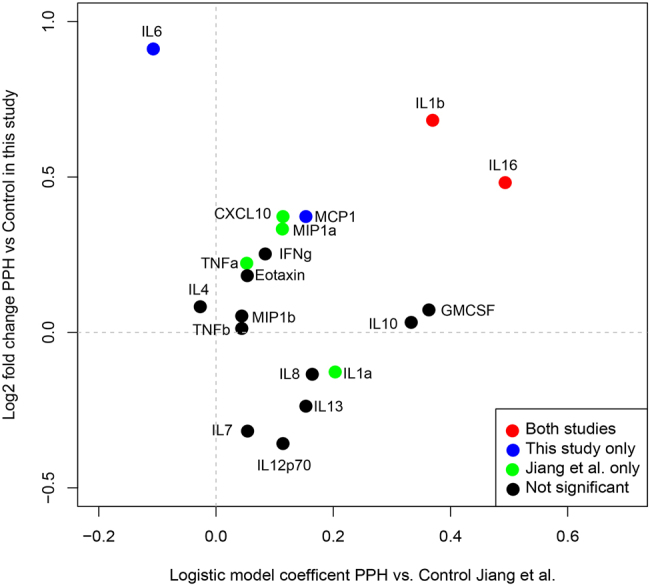
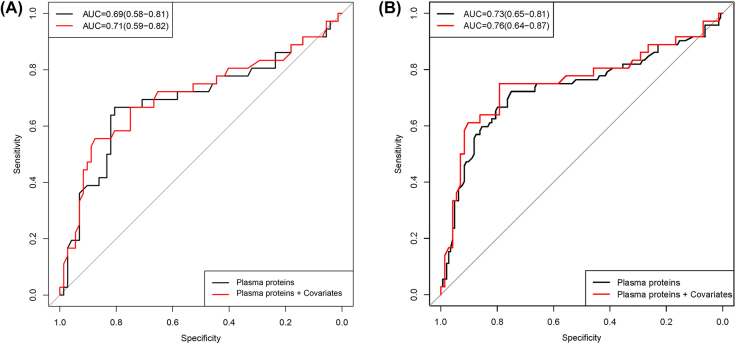
Results: Concentrations of interleukin (IL)-16, IL-6, IL-12/IL-23p40, monocyte chemotactic protein 1 (MCP-1), and IL-1β were significantly higher in PPH than in the control group. This difference remained significant after adjustment for maternal age, clinical chorioamnionitis, and preeclampsia. Multi-protein random forest proteomics models had moderate cross-validated accuracy for prediction of PPH [area under the ROC curve, 0.69 (0.58-0.81) by leave-one-out cross validation and 0.73 (0.65-0.81) by 9-fold cross-validation], and the inclusion of clinical and demographic information did not increase the prediction performance.
Conclusions: Pregnant women with severe PPH had higher median maternal plasma concentrations of IL-16, IL-6, IL-12/IL-23p40, MCP-1, and IL-1β than patients without PPH. These cytokines could serve as biomarkers or their pathways may be therapeutic targets.
Keywords: CCL2; IL-12/IL-23p40; IL-16; IL-1β; IL-6; MCP-1; biomarker; inflammation; interleukin (IL); maternal proteins.
© 2022 Walter de Gruyter GmbH, Berlin/Boston.
Conflict of interest statement
Figures
Similar articles
-
Novel biomarkers for prediction of atonic postpartum hemorrhage among 'low-risk' women in labor.Front Immunol. 2024 Jul 11;15:1416990. doi: 10.3389/fimmu.2024.1416990. eCollection 2024. Front Immunol. 2024. PMID: 39055706 Free PMC article.
-
Is there a relationship between plasma, cytokine concentrations, and the subsequent risk of postpartum hemorrhage?Am J Obstet Gynecol. 2022 Jun;226(6):835.e1-835.e17. doi: 10.1016/j.ajog.2021.12.021. Epub 2021 Dec 15. Am J Obstet Gynecol. 2022. PMID: 34919894
-
Tone or tissue? A comparison of trends and risk factors of severe postpartum hemorrhage according to uterine atony or retained tissue in a hospital setting.PLoS One. 2025 Feb 3;20(2):e0318770. doi: 10.1371/journal.pone.0318770. eCollection 2025. PLoS One. 2025. PMID: 39899591 Free PMC article.
-
Folic acid supplementation and malaria susceptibility and severity among people taking antifolate antimalarial drugs in endemic areas.Cochrane Database Syst Rev. 2022 Feb 1;2(2022):CD014217. doi: 10.1002/14651858.CD014217. Cochrane Database Syst Rev. 2022. PMID: 36321557 Free PMC article.
-
Uterine atony.Curr Opin Obstet Gynecol. 2022 Apr 1;34(2):82-89. doi: 10.1097/GCO.0000000000000776. Curr Opin Obstet Gynecol. 2022. PMID: 35102109 Review.
Cited by
-
Novel biomarkers for prediction of atonic postpartum hemorrhage among 'low-risk' women in labor.Front Immunol. 2024 Jul 11;15:1416990. doi: 10.3389/fimmu.2024.1416990. eCollection 2024. Front Immunol. 2024. PMID: 39055706 Free PMC article.
-
Meconium-stained amniotic fluid.Am J Obstet Gynecol. 2023 May;228(5S):S1158-S1178. doi: 10.1016/j.ajog.2022.11.1283. Epub 2023 Apr 1. Am J Obstet Gynecol. 2023. PMID: 37012128 Free PMC article.
-
Novel predictive biomarkers for atonic postpartum hemorrhage as explored by proteomics and metabolomics.BMC Pregnancy Childbirth. 2025 Jan 30;25(1):96. doi: 10.1186/s12884-025-07224-9. BMC Pregnancy Childbirth. 2025. PMID: 39885444 Free PMC article.
-
Clinical chorioamnionitis at term: definition, pathogenesis, microbiology, diagnosis, and treatment.Am J Obstet Gynecol. 2024 Mar;230(3S):S807-S840. doi: 10.1016/j.ajog.2023.02.002. Epub 2023 Mar 21. Am J Obstet Gynecol. 2024. PMID: 38233317 Free PMC article. Review.
-
Immune changes in pregnancy: associations with pre-existing conditions and obstetrical complications at the 20th gestational week-a prospective cohort study.BMC Med. 2024 Dec 18;22(1):583. doi: 10.1186/s12916-024-03797-y. BMC Med. 2024. PMID: 39696496 Free PMC article.
References
-
- Arulkumaran S, Karoshi M, Keith LG, Lalonde AB, Christopher B. A comprehensive textbook of postpartum hemorrhage: an essential clinical reference for effective management: Global Library of Women’s Medicine (www.glowm.com) Sapiens Publishing; 2012.
-
- Davis NL, Smoots AN, Goodman DA. Pregnancy-related deaths: data from 14 US maternal mortality review committees. Education. 2019;40:8–2. - PubMed
-
- Obstetricians ACo, Gynecologists ACOG practice bulletin: clinical management guidelines for obstetrician-gynecologists number 183. Postpartum hemorrhage. Obstet Gynecol. 2017;130:e168–86. - PubMed
MeSH terms
Substances
Grants and funding
LinkOut - more resources
Full Text Sources
Research Materials
Miscellaneous