. 2022 Sep:258:119399.
doi: 10.1016/j.neuroimage.2022.119399. Epub 2022 Jun 18.

Detection of functional activity in brain white matter using fiber architecture informed synchrony mapping

Affiliations

Detection of functional activity in brain white matter using fiber architecture informed synchrony mapping

Yu Zhao et al. Neuroimage. 2022 Sep.

Abstract

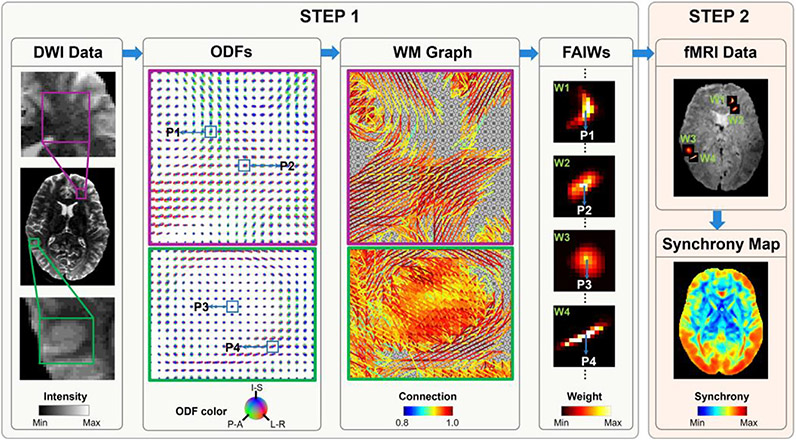
A general linear model is widely used for analyzing fMRI data, in which the blood oxygenation-level dependent (BOLD) signals in gray matter (GM) evoked in response to neural stimulation are modeled by convolving the time course of the expected neural activity with a canonical hemodynamic response function (HRF) obtained a priori. The maps of brain activity produced reflect the magnitude of local BOLD responses. However, detecting BOLD signals in white matter (WM) is more challenging as the BOLD signals are weaker and the HRF is different, and may vary more across the brain. Here we propose a model-free approach to detect changes in BOLD signals in WM by measuring task-evoked increases of BOLD signal synchrony in WM fibers. The proposed approach relies on a simple assumption that, in response to a functional task, BOLD signals in relevant fibers are modulated by stimulus-evoked neural activity and thereby show greater synchrony than when measured in a resting state, even if their magnitudes do not change substantially. This approach is implemented in two technical stages. First, for each voxel a fiber-architecture-informed spatial window is created with orientation distribution functions constructed from diffusion imaging data. This provides the basis for defining neighborhoods in WM that share similar local fiber architectures. Second, a modified principal component analysis (PCA) is used to estimate the synchrony of BOLD signals in each spatial window. The proposed approach is validated using a 3T fMRI dataset from the Human Connectome Project (HCP) at a group level. The results demonstrate that neural activity can be reliably detected as increases in fMRI signal synchrony within WM fibers that are engaged in a task with high sensitivities and reproducibility.

Keywords: Activation mapping; Functional MRI; Graph signal processing; Synchrony mapping; White matter.


Conflict of interest statement

Declaration of Competing Interest The authors declare that they have no competing interests.

Figures

Fig. 1.
Fig. 1.
Schematic of fiber architecture informed synchrony mapping in human white matter (WM). The algorithm of the proposed approach consists of two major steps. First, a spatial window is created for each voxel based on local fiber architectures. In this step, orientation distribution functions (ODFs) constructed from diffusion MRI data provide the information on fiber architectures, which are then used to generate a topological graph for WM. In this graph, every vertex corresponds to a voxel in MR images, with weighted connections to its neighbors. The edge weights are determined by the coherence between the directions of diffusion and the orientation of the graph edges. Then, diffusion on the graph with a point source located at each vertex is simulated to produce a diffusion profile that can be further used as a fiber-architecture-informed window (FAIWs). Here, typical FAIWs created for four voxels (P1, P2, P3 and P4) demonstrate that they are adaptive to local fiber architectures. Second, a modified PCA is implemented to estimate the synchrony of fMRI time courses based on the FAIWs from the first step to yield activation maps. In the modified PCA, the FAIWs emphasize the time courses associated to voxels near the central position with high weights, which ensures the spatial specificity of the synchrony estimate.
Fig. 2.
Fig. 2.
Group-average synchrony maps reconstructed with the motor-task fMRI dataset collected from 64 participants in HCP, and FA color maps reconstructed with the DTI dataset as well as T1w images from a representative participant. There are many structures with high synchrony in both GM and WM. In the GM, the synchrony structures agree grossly with anatomical structures identified in the T1w images. In the WM, synchrony structures exist almost exclusively in regions that contain large axonal fascicles, with some typical examples denoted by red arrows that exhibit uniform fiber orientations in the FA maps. Conversely, the WM regions that include fibers with heterogenous orientations (indicated by heterogeneities in FA colors) or crossing fibers (visualized as dim FA colors) exhibit low intensities in the synchrony maps, which is showcased in the regions denoted by green arrows.
Fig. 3.
Fig. 3.
Comparison of group-average activation maps obtained from resting-state fMRI data and motor-task fMRI data on the basis of WM fiber tractograms. (A), exhibition of fiber tracking. The primary motor cortex (M1) and auditory cortex (A1&A2) related WM regions were determined by using fiber tracking with seed points defined in the corresponding cortical regions. (B), typical slices of fiber intensity maps estimated from fiber tracking. The fiber intensity of the M1 and A1&A2 related WM regions are displayed with red-yellow and blue colors, respectively. (C) synchrony maps and the corresponding difference maps displayed at the same slice indexes with the images in B. In both M1 GM regions and the related WM regions, the synchrony maps exhibit substantially higher intensities under motor task than those estimated from the resting-state, which demonstrates coactivations of the associated GM and WM regions. Note that dark lines are added in the difference maps to indicate the boundaries between the GM and WM.
Fig. 4.
Fig. 4.
Scatter pots of activations for the voxels in the primary motor-cortex (M1) related WM region (A) and the auditory cortex (A1&A2) related WM region (B). Distances from points to an identity line measure the degree of activations. Activations in the M1 related WM region are substantially higher than those of the A1&A2 related WM region, in which the scatter points are tightly and symmetrically distributed along the identity line.
Fig. 5.
Fig. 5.
Comparison of the synchronies of time courses collected from the resting state and motor task data at an induvial level. (A), paradigm of the HCP motor task. The motor task contains 16 blocks, each of which consists of a visual cue (3 s) and ten identical movement trials (12 s). Five movement types are included in the task–right hand, left hand, right foot, left foot, and tongue, each of which is repeated once. The task paradigm provides a reference for the analysis of the time courses. (B), a typical Δsyn map estimated from a single subject. Based on the Δsyn map, the time courses are extracted from a FAIW of a typical voxel, which is determined in this map by selecting a voxel with a high intensity in the M1 related WM tract. (C&D), the 1st principal component (PC) of FAIW-PCA and color mapping of time courses from the resting state and motor task. They show overall temporal patterns of time courses. Note that the PCs derived from the two states exhibit no obvious dependences on the timing of the motor task. On the other hand, the synchrony of the time courses from the motor task shows an increase compared with those from the resting state, which is quantified by the first eigenvalue of FAIW-PCA (σ1) and can be intuitively appreciated in the color maps that show the coherence of time courses across the voxels (i.e., along the vertical direction) in the corresponding FAIW.
Fig. 6.
Fig. 6.
Tract-wise comparison of synchrony between resting state and motor task for 46 fiber tracts defined in the HCP population-averaged tractography atlas. (A), statistical comparisons of synchrony for each fiber tract. Paired t-test was implemented with tract-averaged synchronies estimated individually from 64 subjects. The error bars indicate standard deviations of the tract-average synchronies across subjects. The result of statistical analysis shows that the synchrony under the motor task significantly increases for 34 fiber tracts with P < 0.05, and for 15 fiber tracts with P < 0.01. (B), maximum intensity projection images of differences in tract-averaged synchronies. To visually illustrate activations of the fiber tracts, the differences in tract-averaged synchrony are assigned as intensities to the corresponding tracts with significant increases in synchrony (P < 0.05), which are displayed as 2D images using maximum intensity projections for axonal, sagittal and coronal views. High intensities in the figure appear mainly along the CST, consistent with the functional dominance of the sensorimotor pathways involved in the execution of the motor task.
Fig. 7.
Fig. 7.
Comparison of group level statistical maps of Δsyn- and GLM-based activation with anatomical references of fiber structures. (A), FA color maps from one representative participant. The FA color maps show fiber structures. (B), group level statistical maps of Δsyn- and GLM-based activation. The statistical maps of Δsyn-based changes are derived by voxel-wise paired t-test of differences between resting state and motor task with a false discovery rate (FDR) correction for the 64-subject dataset. The statistical maps of GLM-based activation are estimated by using the standard SPM toolbox. In the statistically inferred activation maps from both the approaches, t-values thresholded with the FDR-corrected P values of 0.05 are shown in B. The GLM-based activation maps indicate that the whole primary motor cortex (M1) is engaged by the composite task that includes foot, hand and tongue movements. The Δsyn-based activations also highlight the cortical region of M1 and show smaller coverages in the insular cortex (R1) and the tongue motor cortex (R2) than the GLM-indicated activations. Moreover, the Δsyn-based activations exhibit in WM regions that are hardly captured by the GLM approach. The green arrows indicate the activations in WM that have similar spatial patterns with fiber structures identified in FA color maps. (C), synchrony maps of three typical subjects displayed in MNI space. There are discernable inter-subject variabilities of elongated fibers (indicated by red arrows) among these subjects, which could confound the statistical analysis at group level, and thus may account for the dispersity and discontinuity of activations detected in WM.
Fig. 8.
Fig. 8.
The reproducibility of the FAIW-PCA activation mapping validated with two independent datasets (Group 1 and Group 2). (A), group-average Δsyn maps estimated from the two datasets. The two maps exhibit similar spatial patterns of the task-induced enhancement of synchrony. (B), statistical t maps of Δsyn-based activation from the two datasets. In B, t values are thresholded with the FDR-corrected P values of 0.05. Dice coefficient is calculated to quantify the similarity between the activation maps from the two datasets. Dice coefficients of the two activation maps is 0.76, which demonstrates a good reproducibility of the proposed approach.

References

    1. Gawryluk JR, Mazerolle EL, D’Arcy RC, 2014. Does functional MRI detect activation in white matter? A review of emerging evidence, issues, and future directions. Front. Neurosci 8, 239. - PMC - PubMed
    1. Mazerolle EL, Ohlhauser L, Mayo CD, Sheriff A, Gawryluk JR, May 2020. Evidence of underreporting of white matter fMRI activation. J. Magn. Reson. Imaging 51 (5), 1596–1597. - PubMed
    1. Gore JC, Li M, Gao Y, Wu TL, Schilling KG, Huang Y, Mishra A, Newton AT, Rogers BP, Chen LM, Anderson AW, Ding Z, 2019. Functional MRI and resting state connectivity in white matter - a mini-review. Magn. Reson. Imaging 63 (Nov), 1–11. - PMC - PubMed
    1. Grajauskas LA, Frizzell T, Song X, D’Arcy RCN, 2019. White matter fMRI activation cannot be treated as a nuisance regressor: overcoming a historical blind spot. Front. Neurosci 13, 1024. - PMC - PubMed
    1. Lin TH, Spees WM, Chiang CW, Trinkaus K, Cross AH, Song SK, 2014. Diffusion fMRI detects white-matter dysfunction in mice with acute optic neuritis. Neurobiol. Dis 67 (Jul), 1–8. - PMC - PubMed

Publication types