

Isolating the net effect of multiple government interventions with an extended Susceptible-Exposed-Infectious-Recovered (SEIR) framework: empirical evidence from the second wave of COVID-19 pandemic in China
- PMID: 35725257
- PMCID: PMC9213777
- DOI: 10.1136/bmjopen-2022-060996
Isolating the net effect of multiple government interventions with an extended Susceptible-Exposed-Infectious-Recovered (SEIR) framework: empirical evidence from the second wave of COVID-19 pandemic in China
Abstract
Objective: By using a data-driven statistical approach, we isolated the net effect of multiple government interventions that were simultaneously implemented during the second wave of COVID-19 pandemic in China.
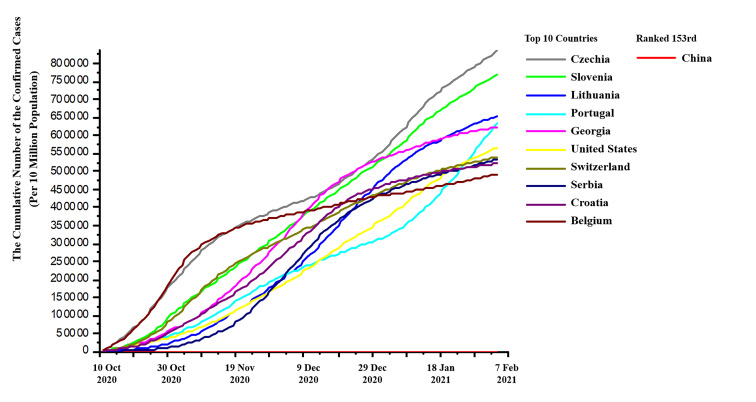
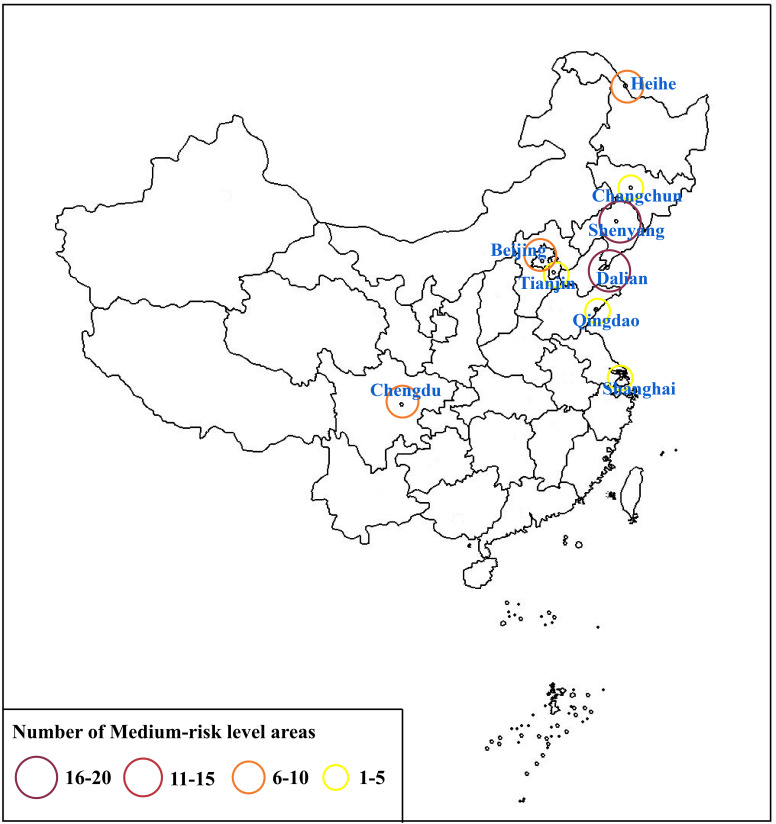
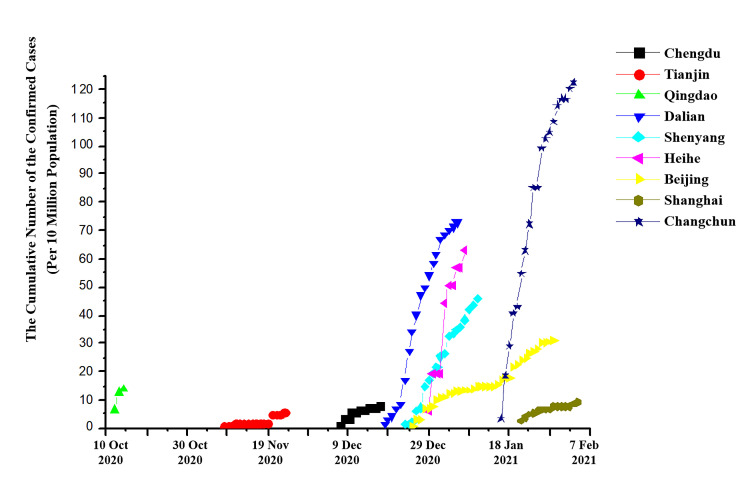
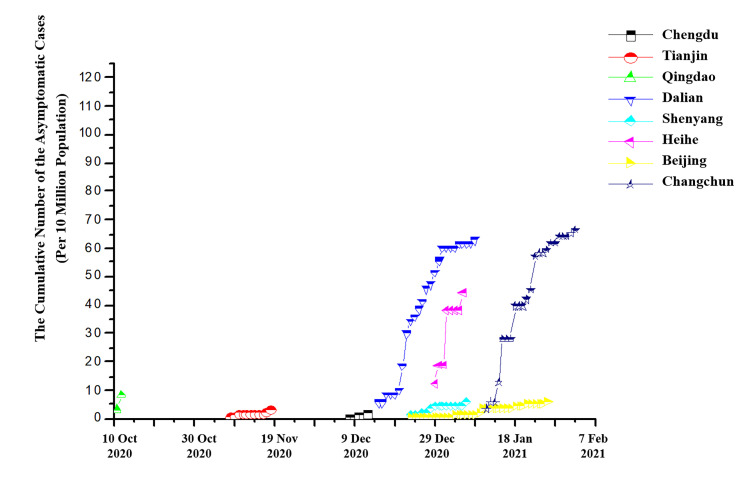
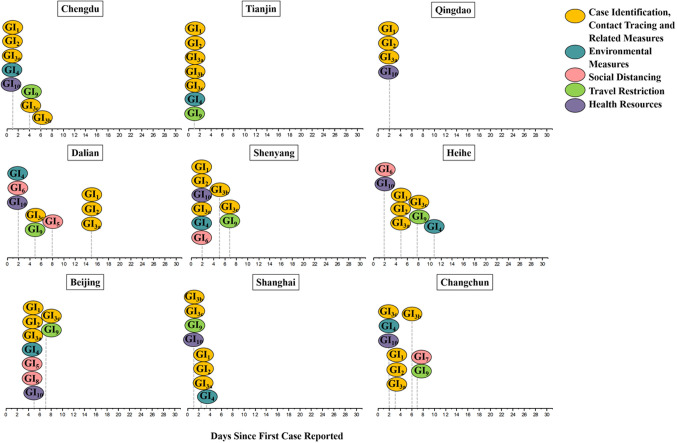
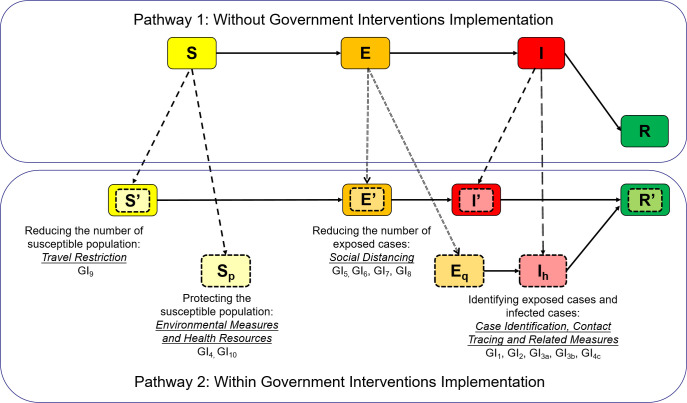
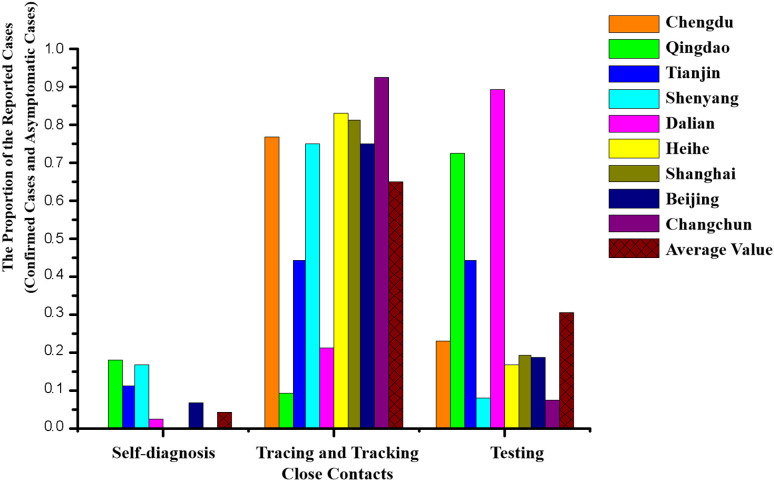
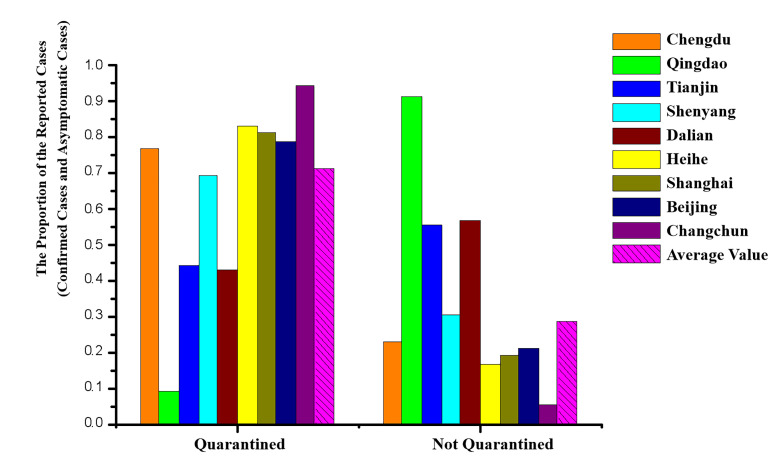
Design, data sources and eligibility criteria: We gathered epidemiological data and government interventions data of nine cities with local outbreaks during the second wave of COVID-19 pandemic in China. We employed the Susceptible-Exposed-Infectious-Recovered (SEIR) framework model to analyse the different pathways of transmission between cities with government interventions implementation and those without. We introduced new components to the standard SEIR model and investigated five themes of government interventions against COVID-19 pandemic.
Data extraction and synthesis: We extracted information including study objective, design, methods, main findings and implications. These were tabulated and a narrative synthesis was undertaken given the diverse research designs, methods and implications.
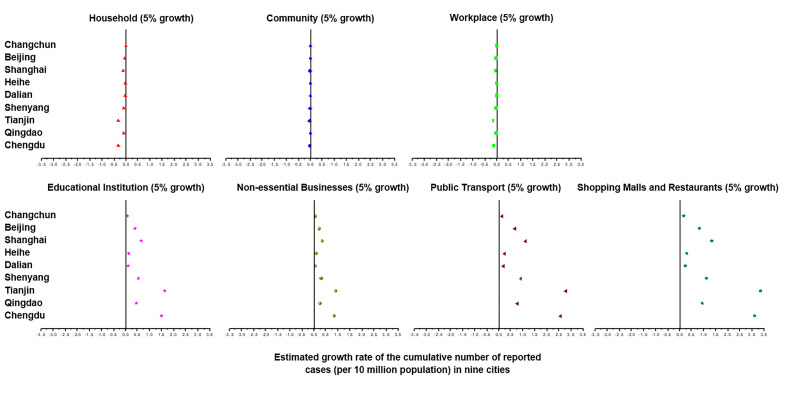
Results: Supported by extensive empirical validation, our results indicated that the net effect of some specific government interventions (including masks, environmental cleaning and disinfection, tracing, tracking and 14-day centralised quarantining close contacts) had been significantly underestimated in the previous investigation. We also identified important moderators and mediators for the effect of certain government interventions, such as closure of shopping mall and restaurant in the medium-risk level areas, etc. Linking the COVID-19 epidemiological dynamics with the implementation timing of government interventions, we detected that the earlier implementation of some specific government interventions (including targeted partial lockdown, tracing, tracking and 14-day centralised quarantining close contacts) achieved the strongest and most timely effect on controlling COVID-19, especially at the early period of local outbreak.
Conclusions: These findings provide important scientific information for decisions regarding which and when government interventions should be implemented to fight against COVID-19 in China and beyond. The proposed analytical framework is useful for policy-making in future endemic and pandemic as well.
Keywords: COVID-19; epidemiology; health policy; public health.
© Author(s) (or their employer(s)) 2022. Re-use permitted under CC BY-NC. No commercial re-use. See rights and permissions. Published by BMJ.
Conflict of interest statement
Competing interests: None declared.
Figures
Similar articles
-
Could masks curtail the post-lockdown resurgence of COVID-19 in the US?Math Biosci. 2020 Nov;329:108452. doi: 10.1016/j.mbs.2020.108452. Epub 2020 Aug 18. Math Biosci. 2020. PMID: 32818515 Free PMC article.
-
An evaluation of COVID-19 transmission control in Wenzhou using a modified SEIR model.Epidemiol Infect. 2021 Jan 8;149:e2. doi: 10.1017/S0950268820003064. Epidemiol Infect. 2021. PMID: 33413715 Free PMC article.
-
Which Matters More in Fighting COVID-19-Government Policy or Community Participation?Front Public Health. 2022 Jul 12;10:927553. doi: 10.3389/fpubh.2022.927553. eCollection 2022. Front Public Health. 2022. PMID: 35903372 Free PMC article.
-
COVID-19 in Germany and China: mitigation versus elimination strategy.Glob Health Action. 2021 Jan 1;14(1):1875601. doi: 10.1080/16549716.2021.1875601. Glob Health Action. 2021. PMID: 33472568 Free PMC article. Review.
-
Lessons from countries implementing find, test, trace, isolation and support policies in the rapid response of the COVID-19 pandemic: a systematic review.BMJ Open. 2021 Jun 29;11(7):e047832. doi: 10.1136/bmjopen-2020-047832. BMJ Open. 2021. PMID: 34187854 Free PMC article.
Cited by
-
Impact of vaccination and non-pharmacological interventions on COVID-19: a review of simulation modeling studies in Asia.Front Public Health. 2023 Sep 25;11:1252719. doi: 10.3389/fpubh.2023.1252719. eCollection 2023. Front Public Health. 2023. PMID: 37818298 Free PMC article. Review.
References
-
- World Health Organization (WHO) . World Health organization who coronavirus disease (COVID-19) Dashboard; 2021. https://covid19.who.int/
-
- Horton R. The covid-19 catastrophe: what’s gone wrong and how to stop it happening again. Cambridge: Polity Press, 2021.
Publication types
MeSH terms
LinkOut - more resources
Full Text Sources
Medical