. 2022 Jun 20;23(1):454.
doi: 10.1186/s12864-022-08686-3.

Transcriptional changes in the peripheral blood leukocytes from Brangus cattle before and after tick challenge with Rhipicephalus australis

Affiliations

Transcriptional changes in the peripheral blood leukocytes from Brangus cattle before and after tick challenge with Rhipicephalus australis

Emily F Mantilla Valdivieso et al. BMC Genomics. .

Abstract

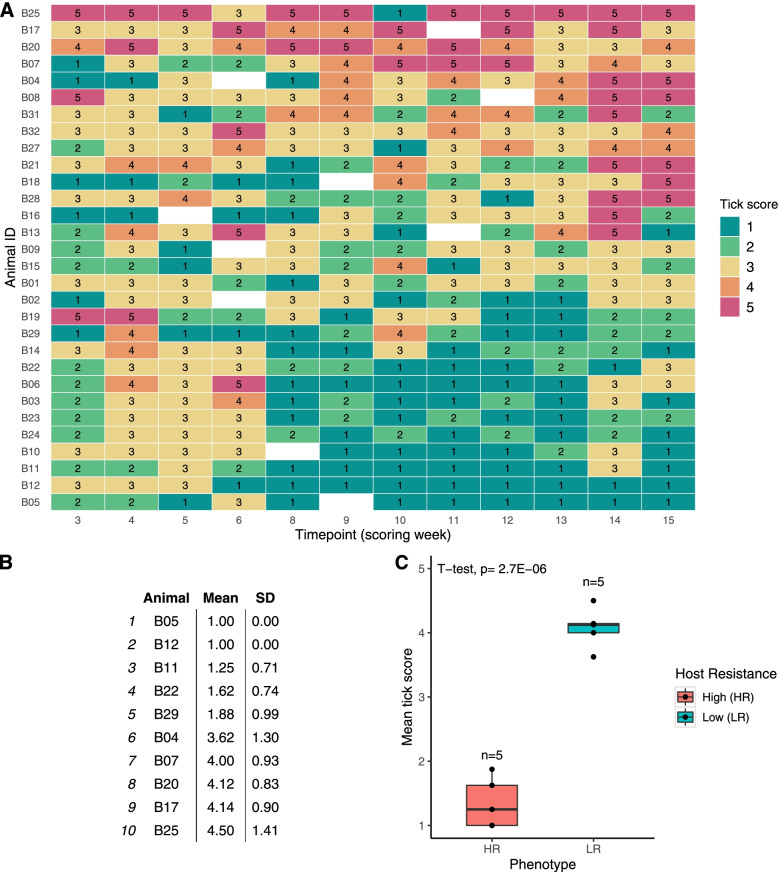
Background: Disease emergence and production loss caused by cattle tick infestations have focused attention on genetic selection strategies to breed beef cattle with increased tick resistance. However, the mechanisms behind host responses to tick infestation have not been fully characterised. Hence, this study examined gene expression profiles of peripheral blood leukocytes from tick-naive Brangus steers (Bos taurus x Bos indicus) at 0, 3, and 12 weeks following artificial tick challenge experiments with Rhipicephalus australis larvae. The aim of the study was to investigate the effect of tick infestation on host leukocyte response to explore genes associated with the expression of high and low host resistance to ticks.

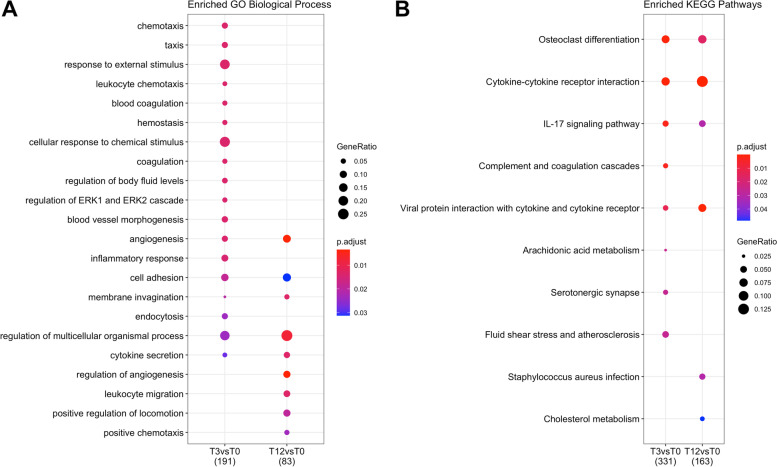
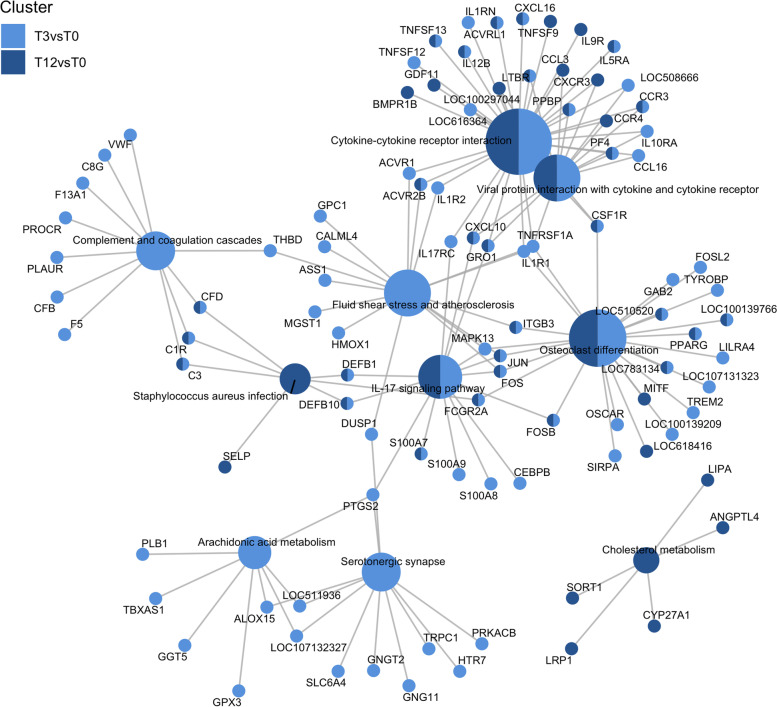
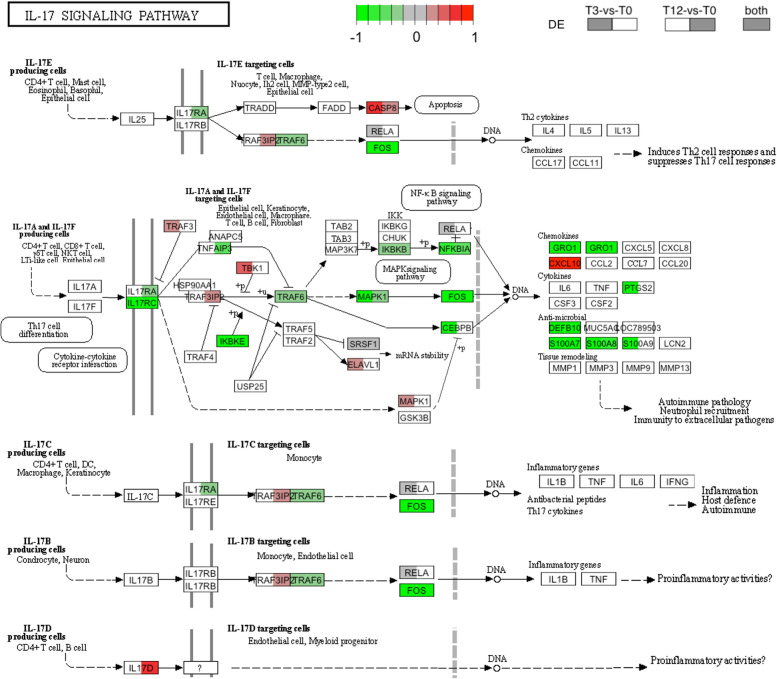
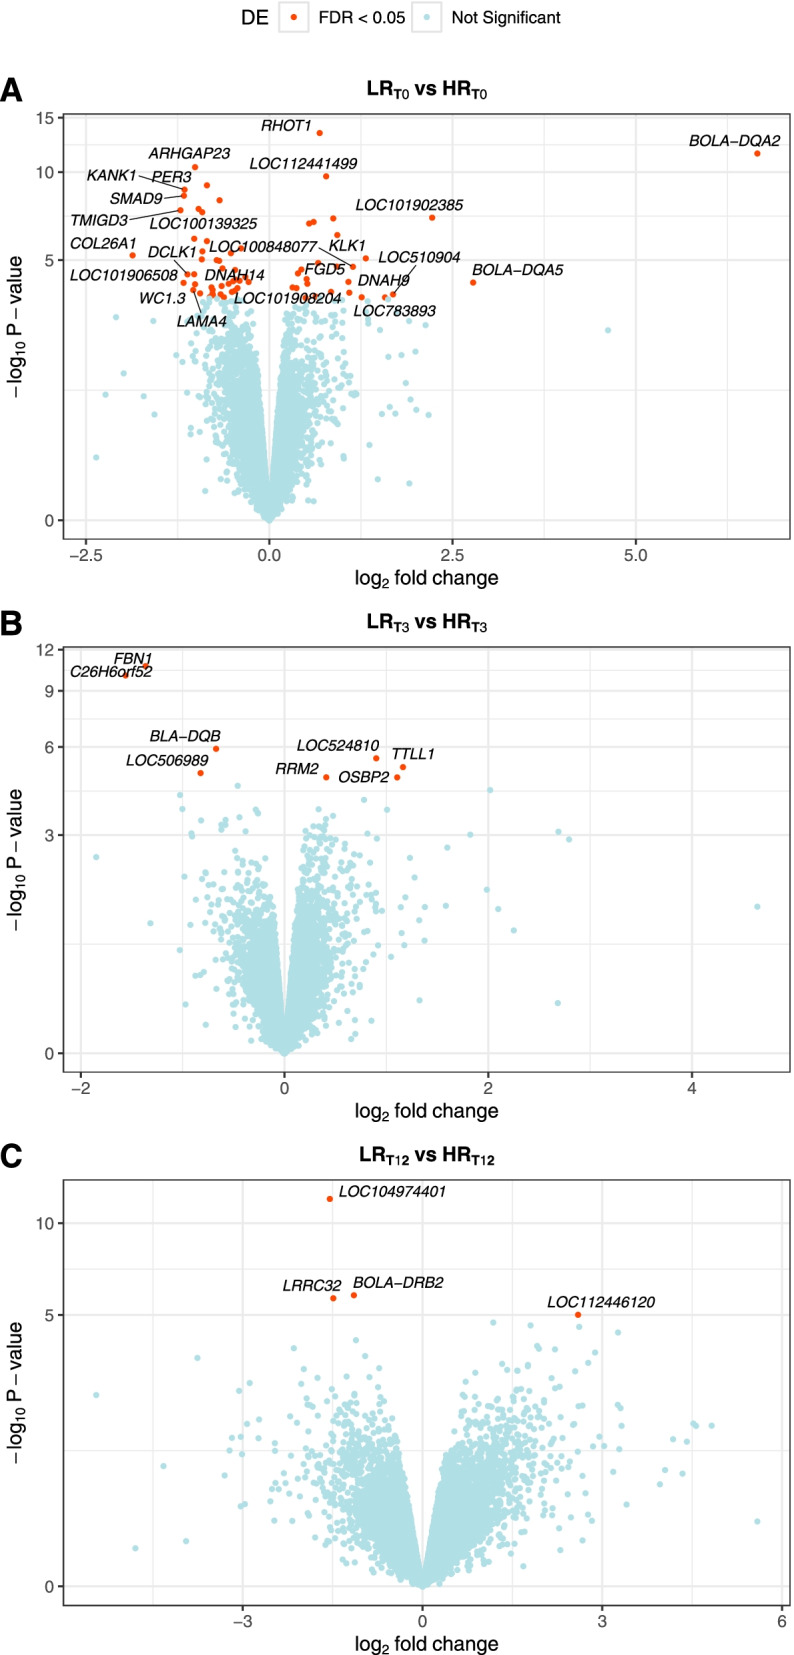
Results: Animals with high (HR, n = 5) and low (LR, n = 5) host resistance were identified after repeated tick challenge. A total of 3644 unique differentially expressed genes (FDR < 0.05) were identified in the comparison of tick-exposed (both HR and LR) and tick-naive steers for the 3-week and 12-week infestation period. Enrichment analyses showed genes were involved in leukocyte chemotaxis, coagulation, and inflammatory response. The IL-17 signalling, and cytokine-cytokine interactions pathways appeared to be relevant in protection and immunopathology to tick challenge. Comparison of HR and LR phenotypes at timepoints of weeks 0, 3, and 12 showed there were 69, 8, and 4 differentially expressed genes, respectively. Most of these genes were related to immune, tissue remodelling, and angiogenesis functions, suggesting this is relevant in the development of resistance or susceptibility to tick challenge.

Conclusions: This study showed the effect of tick infestation on Brangus cattle with variable phenotypes of host resistance to R. australis ticks. Steers responded to infestation by expressing leukocyte genes related to chemotaxis, cytokine secretion, and inflammatory response. The altered expression of genes from the bovine MHC complex in highly resistant animals at pre- and post- infestation stages also supports the relevance of this genomic region for disease resilience. Overall, this study offers a resource of leukocyte gene expression data on matched tick-naive and tick-infested steers relevant for the improvement of tick resistance in composite cattle.

Keywords: Biomarkers; Bovine; Brangus; Cattle; Cattle tick; Host resistance; RNA-seq.


Conflict of interest statement

The authors declare that they have no competing interests.

Figures

Fig. 1
Fig. 1
Tick scoring for host resistance phenotyping of Brangus steers. A Heatmap representation of the tick scoring data collected from 30 Brangus steers across twelve timepoints showing clustering of the most resistant (bottom) and least resistant (top). Tick scores represent the estimated number of adult ticks that develop 21 days after a single infestation with R.australis larvae, where 1 = 0–50 ticks, 2 = 50–100 ticks, 3 = 100–200 ticks, 4 = 200–300 ticks, 5 = more than 300 ticks, blank = not scored. The vertical colour bar indicates the value that each colour represents in the heatmap from low (green) to high (red). B The mean tick score (MTS) ± standard deviation (SD) calculated across week 8–15 for 10 animals selected as divergent in host resistant phenotype. C Boxplots showing the comparison of MTS (week 8–15) values between the high (HR, n = 5) and low (LR, n = 5) host resistance phenotypes
Fig. 2
Fig. 2
Differentially expressed genes (DEGs) in the leukocytes of tick-infested compared to tick-naive Brangus steers. A Volcano plot of DEGs from T3-vs-T0 comparison (3-week tick-exposed vs. tick-naive). B Volcano plot of DEGs from T12-vs-T0 comparison (12-week tick-exposed vs. tick-naive). The x-axis represents fold change and y-axis represents statistical significance. Symbols are shown for genes with fold change |logFC| > 2.5 at a significance threshold FDR < 0.05. C Venn diagram of upregulated DEGs between comparisons. D Venn diagram of downregulated between comparisons
Fig. 3
Fig. 3
Functional enrichment analysis of the differential expression analysis between tick-exposed and tick-naïve steers. A Enriched GO Biological Process terms and B Enriched KEGG pathways in the differentially expressed genes (DEGs) from the comparison T3-vs-T0 (3-week tick-exposed vs. tick-naive) and T12-vs-T0 (12-week tick-exposed vs. tick-naive) performed by clusterProfiler. The dot colour represents significance (p-adjusted < 0.05) of the term, and dot size (GeneRatio) represents the ratio of input genes that are annotated in a term
Fig. 4
Fig. 4
Top enriched biological pathways in tick-exposed steers. Network plot of the enriched KEGG pathways (p-adjusted < 0.05) in the differentially expressed genes (DEGs) from the comparison T3-vs-T0 (3-week tick-exposed vs. tick-naive) and T12-vs-T0 (12-week tick-exposed vs. tick-naive). Light blue = enriched in T3-vs-T0; dark blue = enriched in T12-vs-T0)
Fig. 5
Fig. 5
Gene expression changes in the IL-17 signalling pathway. Representation of the differentially expressed genes that were enriched in the IL-17 signalling pathway (KEGG: bta04657). Red and green boxes indicate the up- and downregulated genes in response to tick infestation, respectively. Left-side coloured box represents a gene with differential expression in the T3-vs-T0 comparison (3-week tick-exposed vs. tick-naive). Right-side coloured box represents a gene with differential expression in the T12-vs-T0 comparison (12-week tick-exposed vs. tick-naive). Fully coloured box indicates a gene that was changed in both comparisons. Blank box indicates no changes in expression. Pathway data was sourced from the KEGG database [–42] and rendered with the Pathview R package
Fig. 6
Fig. 6
Differentially expressed genes (DEGs) in the leukocytes of low (LR) compared to high (HR) host resistance Brangus steers. A Volcano plot of DEGs at T0 (tick-naive) timepoint. B Volcano plot of DEGs at T3 (3 weeks post-initial infestation) timepoint. C Volcano plot of DEGs at T12 (12 weeks post-initial infestation) timepoint. The x-axis represents fold change and y-axis represents statistical significance. Symbols are shown DEGs with fold change |logFC| > 1 and FDR < 0.05 in T0, and for the DEGs in T3 and T12 (FDR < 0.05)
Fig. 7
Fig. 7
Experimental design of the study. A Representation of the experimental design timeline used in the artificial tick infestation trial undertaken with Brangus steers showing the frequency of larval applications (orange dots), tick scoring (green triangle), sampling (blue square), and chosen sampling timepoints for RNA sequencing (purple star). B Schematic of larval tick application during infestation. C Schematic of tick scoring method. Created with BioRender.com

References

    1. Estrada-Peña A, Venzal JM, Nava S, Mangold A, Guglielmone AA, Labruna MB, De La Fuente J. Reinstatement of Rhipicephalus (Boophilus) australis (Acari: Ixodidae) with redescription of the adult and larval stages. J Med Entomol. 2012;49(4):794–802. doi: 10.1603/ME11223. - DOI - PubMed
    1. White N, Sutherst RW, Hall N, Whish-Wilson P. The vulnerability of the Australian beef industry to impacts of the cattle tick (Boophilus microplus) under climate change. Clim Chang. 2003;61(1):157–190. doi: 10.1023/A:1026354712890. - DOI
    1. Lew-Tabor AE, Rodriguez VM. A review of reverse vaccinology approaches for the development of vaccines against ticks and tick borne diseases. Ticks Tick Borne Dis. 2016;7(4):573–585. doi: 10.1016/j.ttbdis.2015.12.012. - DOI - PubMed
    1. Tabor AE, Ali A, Rehman G, Garcia G, Zangirolamo A, Malardo T, Jonsson NN. Cattle tick Rhipicephalus microplus-host interface: a review of resistant and susceptible host responses. Front Cell Infect Microbiol. 2017;7(506):1–18. - PMC - PubMed
    1. Burrow HM, Mans BJ, Cardoso FF, Birkett MA, Kotze AC, Hayes BJ, Mapholi N, Dzama K, Marufu MC, Githaka NW, et al. Towards a new phenotype for tick resistance in beef and dairy cattle: a review. Anim Prod Sci. 2019;59(8):1401–1427. doi: 10.1071/AN18487. - DOI