. 2022 Jun 20;13(1):3404.
doi: 10.1038/s41467-022-31037-5.

Multimodal deep learning for Alzheimer's disease dementia assessment

Affiliations

Multimodal deep learning for Alzheimer's disease dementia assessment

Shangran Qiu et al. Nat Commun. .

Abstract

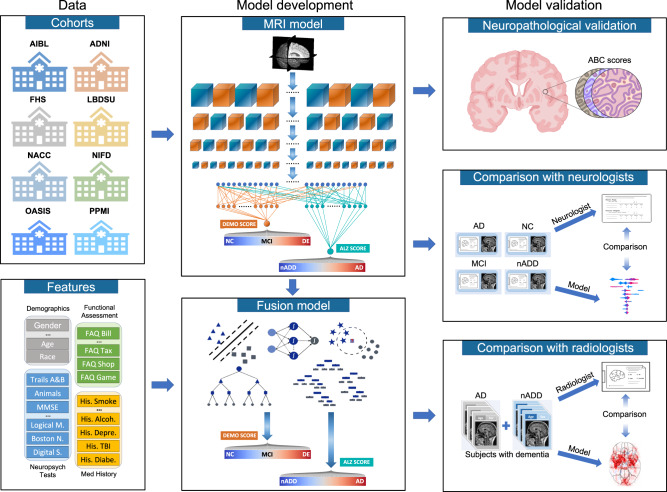
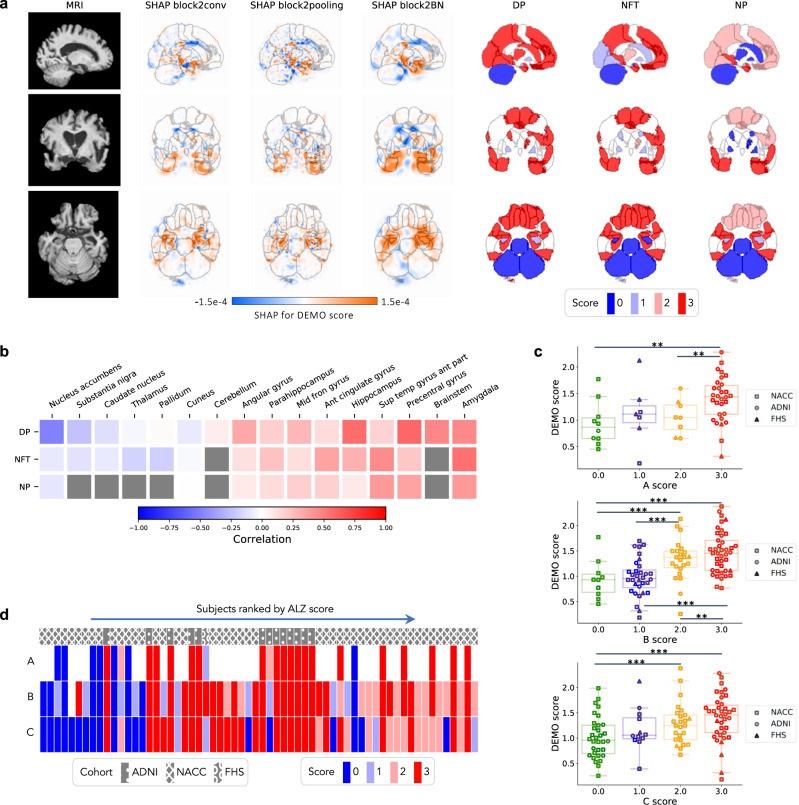
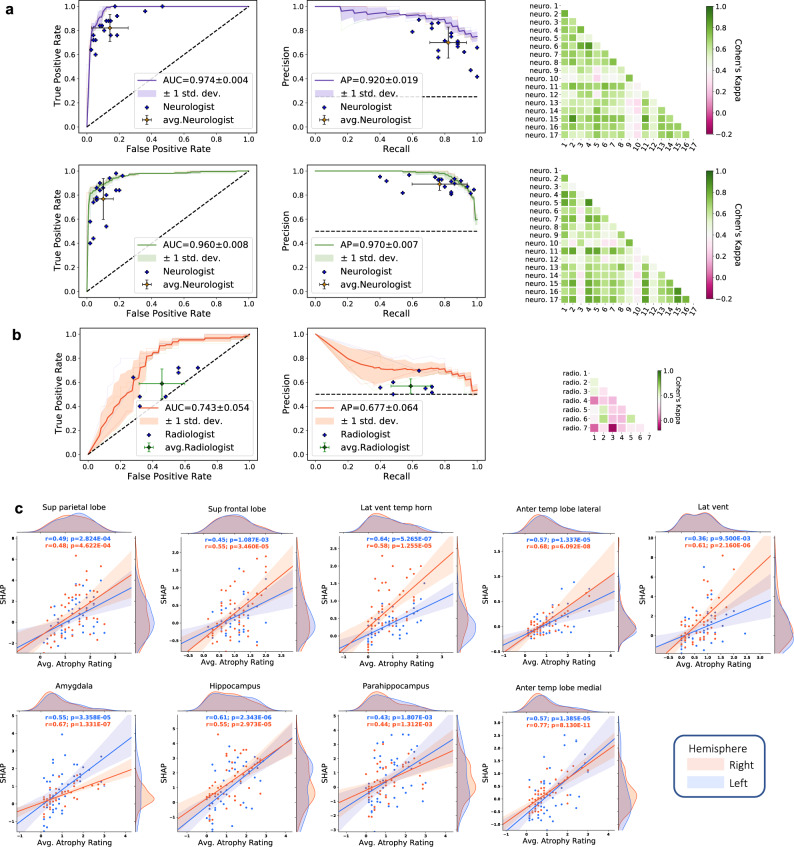
Worldwide, there are nearly 10 million new cases of dementia annually, of which Alzheimer's disease (AD) is the most common. New measures are needed to improve the diagnosis of individuals with cognitive impairment due to various etiologies. Here, we report a deep learning framework that accomplishes multiple diagnostic steps in successive fashion to identify persons with normal cognition (NC), mild cognitive impairment (MCI), AD, and non-AD dementias (nADD). We demonstrate a range of models capable of accepting flexible combinations of routinely collected clinical information, including demographics, medical history, neuropsychological testing, neuroimaging, and functional assessments. We then show that these frameworks compare favorably with the diagnostic accuracy of practicing neurologists and neuroradiologists. Lastly, we apply interpretability methods in computer vision to show that disease-specific patterns detected by our models track distinct patterns of degenerative changes throughout the brain and correspond closely with the presence of neuropathological lesions on autopsy. Our work demonstrates methodologies for validating computational predictions with established standards of medical diagnosis.


Conflict of interest statement

V.B.K. reports honoraria from invited scientific presentations to industry not exceeding $5000/year. He also serves as a consultant to Davos Alzheimer’s Collaborative. R.A. is a scientific advisor to Signant Health and consultant to Biogen. K.L.P. reports honoraria from invited scientific presentations to universities and professional societies not exceeding $5,000/year and has received consulting fees from Curasen. The remaining authors declare no competing interests.

Figures

Fig. 1
Fig. 1. Modeling framework and overall strategy.
Multimodal data including MRI scans, demographics, medical history, functional assessments, and neuropsychological test results were used to develop deep learning models on various classification tasks. Eight independent datasets were used for this study, including NACC, ADNI, AIBL, FHS, LBDSU, NIFD, OASIS, and PPMI. We selected the NACC dataset to develop three separate models: (i) an MRI-only CNN model (ii) non-imaging models in the form of traditional machine learning classifiers, which did not use any MRI data (iii) a fusion model combining imaging and non-imaging data within a hybrid architecture joining a CNN to a CatBoost model. The MRI-only model was validated across all eight cohorts, whereas external validation of non-imaging and fusion models was performed only on OASIS. First, T1-weighted MRI scans were input to a CNN to calculate a continuous DEmentia MOdel (DEMO) score to assess cognitive status on a 0 to 2 scale, where “0” indicated NC “1” indicated MCI and “2” indicated DE. DEMO scores were converted to class labels using an optimal thresholding algorithm, with these assignments constituting the COG task. For individuals with DE diagnosis, the multi-task CNN model simultaneously discriminated their risk of having AD versus nADD, a classification that we refer to as the ADD task. We denoted the probability of AD diagnosis as the ALZheimer (ALZ) score. Both MRI-derived DEMO scores and ALZ scores were then input alongside non-imaging variables to various machine learning classifiers to form fusion models, which then predicted outcomes on the COG and ADD tasks, respectively. A portion of cases with confirmed dementia (n = 50) from the NACC testing cohort was randomly selected for direct comparison of the fusion model with an international team of practicing neuroradiologists. Both the model and neuroradiologists completed the ADD task using available MRI scans, age, and gender. Additionally, a portion of NACC cases (n = 100) was randomly selected to compare the fusion model performance to practicing neurologists, with both the model and clinicians having access to a common set of multimodal data. Lastly, model predictions were compared with neuropathology grades from NACC, ADNI and FHS cohorts (n = 110).
Fig. 2
Fig. 2. Site- and scanner-specific observations.
Unsupervised clustering of post-processed MRIs and hidden layer activations assessed for systematic biases in input data and model predictions, respectively. a Two-dimensional (2D) t-distributed stochastic neighbor embedding (tSNE) embeddings of downsampled MRI scans are shown. The downsampling was performed on the post-processed MRI scans using spline interpolation with a downsampling factor of 8 on each axis. Individual points represent MRIs from a single subject and are colored according to their original cohort (either NACC, ADNI, AIBL, FHS, LBDSU, NIFD, OASIS, or PPMI). b We demonstrate 2D tSNEs of hidden-layer activations from the penultimate CNN hidden layer. Individual points correspond to internal representations of MRI scans during testing and are colored by cohort label. c Plot of 2D tSNE embeddings of downsampled MRI scans from the NACC dataset is shown. Individual points representing MRI scans are colored by the unique identifier of one of twenty-one Alzheimer Disease Research Centers (ADRCs) that participate in the NACC collaboration. d tSNE embeddings for penultimate layer activations colored by ADRC ID are shown. e Plot of 2D tSNE embeddings of downsampled MRI scans from the NACC dataset is shown. Embeddings in this plot are the same as those in c but colored according to the manufacturer of the scanner used to acquire each MRI, either General Electric (GE), Siemens, or Philips. f Plot of 2D tSNE of penultimate layer activations is shown for cases in the NACC dataset. Embeddings are equivalent to those visualized in d but are now colored by the manufacturer of the scanner used for image acquisition. g A tabular representation of disease category counts by manufacturer is presented. Only cases from the NACC dataset are included. We provide the Mutual Information Score (MIS) to quantify the correlation between disease type and scanner manufacturer. h We also provided a tabular representation of disease category counts stratified by ADRC ID in the NACC dataset. MIS is once again shown to quantify the degree of correlation between diagnostic labels and individual centers participating in the NACC study. Source data are provided as a Source Data file.
Fig. 3
Fig. 3. Performance of the deep learning models.
a, b ROC curves showing true positive rate versus false positive rate and PR curves showing the positive predictive value versus sensitivity on the a NACC test set and b OASIS dataset. The first row in a and b denotes the performance of the MRI-only model, the non-imaging model, and the fusion model (CNN + CatBoost) trained to classify cases with NC from those without NC (COGNC task). The second row shows ROC and PR curves of the MRI-only model, the non-imaging model, and the fusion model for the COGDE task aimed at distinguishing cases with DE from those who do not have DE. The third row illustrates performance of the MRI-only model, the non-imaging model, and the fusion model focused on discriminating AD from nADD. For each curve, mean AUC was computed. In each plot, the mean ROC/PR curve and standard deviation are shown as bolded lines and shaded regions, respectively. The dotted lines in each plot indicate the classifier with the random performance level. c, d Fifteen features with highest mean absolute SHAP values from the fusion model are shown for the COG and ADD tasks, respectively across cross-validation rounds (n = 5). Error bars overlaid on bar plots are centered at the mean of the data and extend + /− one standard deviation. For each task, the MRI scans, demographic information, medical history, functional assessments, and neuropsychological test results were used as inputs to the deep learning model. The left plots in c and d illustrate the distribution of SHAP values and the right plots show the mean absolute SHAP values. All the plots in c and d are organized in decreasing order of mean absolute SHAP values. e, f For comparison, we also constructed traditional machine learning models to predict cognitive status and AD status using the same set of features used for the deep learning model, and the results are presented in e and f, respectively. The heat maps show fifteen features with the highest mean absolute SHAP values obtained for each model. Source data are provided as a Source Data file.
Fig. 4
Fig. 4. Neuroimaging signatures of dementia.
a, b SHAP value-based illustration of brain regions that are most associated with the outcomes. The first columns in both a and b show a template MRI oriented in axial, coronal, and sagittal planes. In a, the second, third and fourth columns show SHAP values from the input features of the second convolutional block of the CNN averaged across all NACC test subjects with NC, MCI, and dementia, respectively. In b, the second and third columns show SHAP values averaged across all NACC test subjects with AD and nADD, respectively. c Brain region-specific SHAP values for both AD and nADD cases obtained from the NACC testing data are shown. The violin plots are organized per lobe and in decreasing order of mean absolute SHAP values. d, e Network of brain regions implicated in the classification of AD and nADD, respectively. We selected 33 representative brain regions for graph analysis and visualization of sagittal regions, as well as 57 regions for axial analyses. Nodes representing brain regions are overlaid on a two-dimensional brain template and sized according to weighted degree. The color of the segments connecting different nodes indicates the sign of correlation and the thickness of the segments indicates the magnitude of the correlation. It must be noted that not all nodes can be seen either from the sagittal or the axial planes. Source data are provided as a Source Data file.
Fig. 5
Fig. 5. Neuropathological validation.
We correlated model findings with regional ABC scores of neuropathologic severity obtained autopsied participants in NACC, ADNI, and FHS cohorts (n = 110). a An example case from the Alzheimer’s Disease Neuroimaging Initiative (ADNI) dataset is displayed in sagittal, axial, and coronal views. The SHAP values derived from the second convolutional block and neuropathologic ABC scores are mapped to brain regions where they were measured at the time of autopsy. Visually, high concordance is observed between anatomically mapped SHAP values regardless of the hidden layer from which they are derived. Concordance is observed between the SHAP values and neurofibrillary tangles (NFT) scores within the temporal lobe. b A heatmap is shown demonstrating Spearman correlations between population-averaged SHAP values from the input features of the second convolutional layer and stain-specific ABC scores at various regions of the brain. A strong positive correlation is observed between the SHAP values and neuropathologic changes within several areas well-known to be affected in AD such as the hippocampus/parahippocampus, amygdala and temporal gyrus. c Beeswarm plots with overlying box-and-whisker diagrams are shown to denote the distribution of ABC system sub-scores (horizontal axis) versus model-predicted cognitive scores (vertical axis). The displayed data points represent a pooled set of participants from ADNI, NACC, and FHS for whom neuropathology reports were available from autopsy. Each symbol represents a study participant, boxes are centered at the median and extend over the interquartile range (IQR), while bottom and top whiskers represent 1st and 3rd quartiles −/+ 1.5 x IQR, respectively. We denote p < 0.05 as *; p < 0.001 as **, and p < 0.0001 as *** based on post-hoc Tukey testing. d A heatmap demonstrating the distribution of neuropathology scores versus model predicted AD probabilities. Herein, each column within the map represents a unique individual whose position along the horizontal axis is a descending function of AD risk according to the deep learning model. The overlying hatching pattern represents the dataset (ADNI, NACC, and FHS), from which everyone is drawn. Source data are provided as a Source Data file.
Fig. 6
Fig. 6. Expert-level validation.
a For the COGNC task (Row 1), the diagnostic accuracy of board-certified neurologists (n = 17) is compared to the performance of our deep learning model using a random subset of cases from the NACC dataset (n = 100). Metrics from individual clinicians are plotted in relation to the ROC and PR curves from the trained model. Individual clinician performance is indicated by the blue plus symbol and averaged clinician performance along with error bars is indicated by the green plus symbol on both the ROC and PR curves. The mean ROC/PR curve and the standard deviation are shown as the bold line and shaded region, respectively. A heatmap of pairwise Cohen’s kappa statistic is also displayed to demonstrate inter-rater agreement across the clinician cohort. For the COGDE task (Row 2), ROC, PR, and interrater agreement graphics are illustrated with comparison to board-certified neurologists in identical fashion. For these tasks, all neurologists were granted access to multimodal patient data, including MRIs, demographics, medical history, functional assessments, and neuropsychological testing. The same data was used as input to train the deep learning model. b For validation of our ADD task, a random subset (n = 50) of cases with dementia from the NACC cohort was provided to the team of neuroradiologists (n = 7), who classified AD versus those with dementia due to other etiologies (nADD). As above, the diagnostic accuracy of the physician cohort is compared to model performance using ROC and PR curves. Graphical conventions for visualizing model and clinician performance are as described above in a and, once more, pairwise Cohen’s kappa values are shown to demonstrate inter-rater agreement. c SHAP values from the second convolutional layer averaged from selected brain regions are shown plotted against atrophy scores assigned by neuroradiologists. Orange and blue points (and along with regression lines and 95% confidence intervals) represent left and right hemispheres, respectively. Spearman correlation coefficients and corresponding two-tailed p values are also shown and demonstrate a statistically significant proportionality between SHAP scores, and the severity of regional atrophy assigned by clinicians. Source data are provided as a Source Data file.

References

    1. Nichols E, et al. Global, regional, and national burden of Alzheimer’s disease and other dementias, 1990–2016: a systematic analysis for the Global Burden of Disease Study 2016. Lancet Neurol. 2019;18:88–106. doi: 10.1016/S1474-4422(18)30403-4. - DOI - PMC - PubMed
    1. Mehta KM, Yeo GW. Systematic review of dementia prevalence and incidence in United States race/ethnic populations. Alzheimer’s Dement. 2017;13:72–83. doi: 10.1016/j.jalz.2016.06.2360. - DOI - PubMed
    1. James BD, et al. Contribution of Alzheimer disease to mortality in the United States. Neurology. 2014;82:1045–1050. doi: 10.1212/WNL.0000000000000240. - DOI - PMC - PubMed
    1. Palmqvist S, et al. Discriminative accuracy of plasma phospho-tau217 for Alzheimer disease vs other neurodegenerative disorders. Jama. 2020;324:772–781. doi: 10.1001/jama.2020.12134. - DOI - PMC - PubMed
    1. Nordberg A. PET imaging of amyloid in Alzheimer’s disease. lancet Neurol. 2004;3:519–527. doi: 10.1016/S1474-4422(04)00853-1. - DOI - PubMed

Publication types