. 2022 Jul;7(7):986-1000.
doi: 10.1038/s41564-022-01152-6. Epub 2022 Jun 20.

Characterization of inositol lipid metabolism in gut-associated Bacteroidetes

Affiliations

Characterization of inositol lipid metabolism in gut-associated Bacteroidetes

Stacey L Heaver et al. Nat Microbiol. 2022 Jul.

Abstract

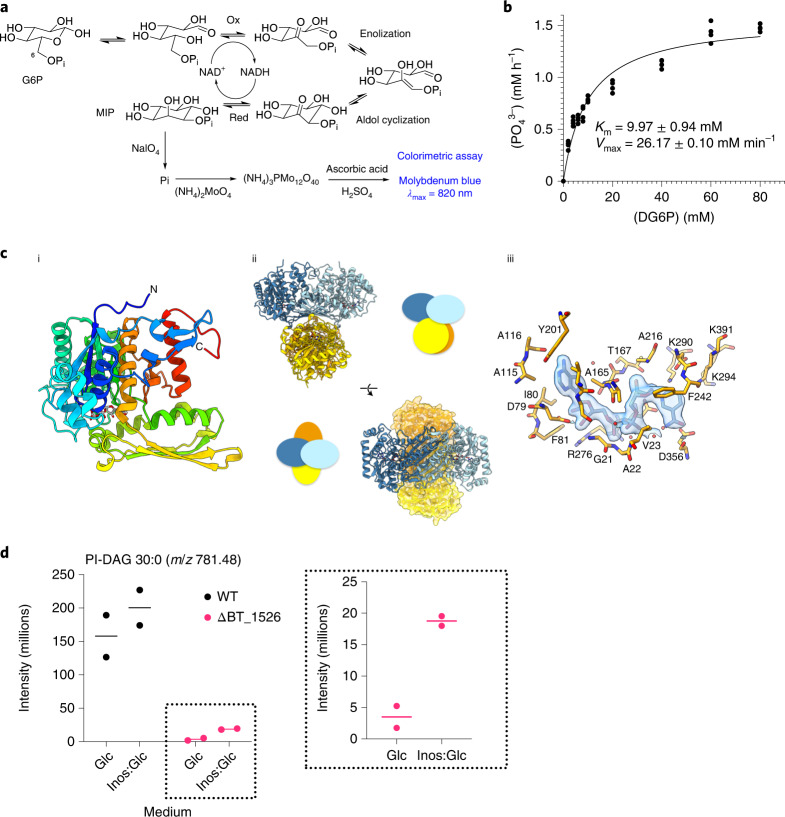
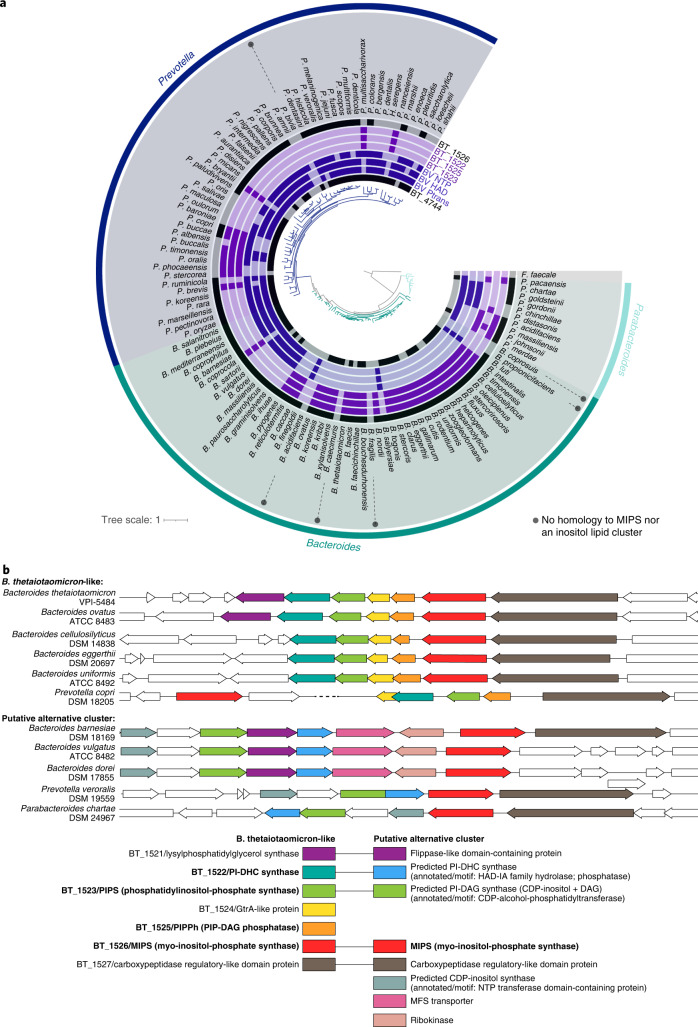
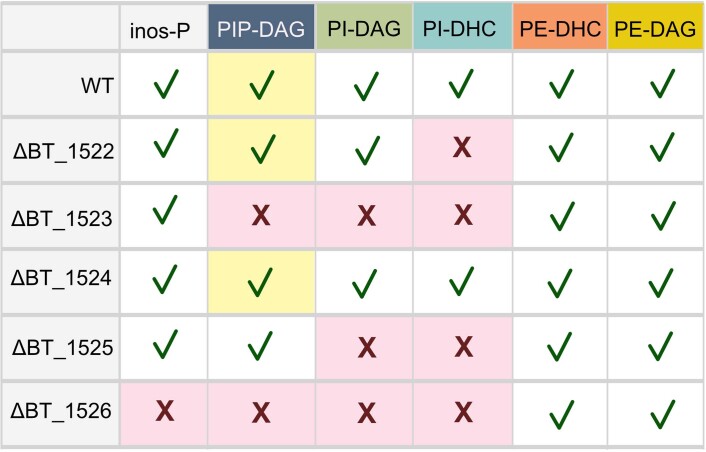
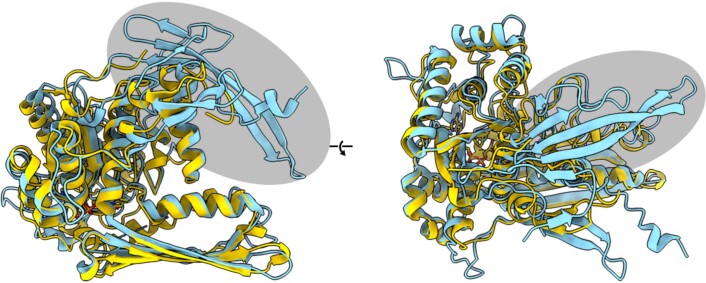
Inositol lipids are ubiquitous in eukaryotes and have finely tuned roles in cellular signalling and membrane homoeostasis. In Bacteria, however, inositol lipid production is relatively rare. Recently, the prominent human gut bacterium Bacteroides thetaiotaomicron (BT) was reported to produce inositol lipids and sphingolipids, but the pathways remain ambiguous and their prevalence unclear. Here, using genomic and biochemical approaches, we investigated the gene cluster for inositol lipid synthesis in BT using a previously undescribed strain with inducible control of sphingolipid synthesis. We characterized the biosynthetic pathway from myo-inositol-phosphate (MIP) synthesis to phosphoinositol dihydroceramide, determined the crystal structure of the recombinant BT MIP synthase enzyme and identified the phosphatase responsible for the conversion of bacterially-derived phosphatidylinositol phosphate (PIP-DAG) to phosphatidylinositol (PI-DAG). In vitro, loss of inositol lipid production altered BT capsule expression and antimicrobial peptide resistance. In vivo, loss of inositol lipids decreased bacterial fitness in a gnotobiotic mouse model. We identified a second putative, previously undescribed pathway for bacterial PI-DAG synthesis without a PIP-DAG intermediate, common in Prevotella. Our results indicate that inositol sphingolipid production is widespread in host-associated Bacteroidetes and has implications for symbiosis.


Conflict of interest statement

The authors declare no competing interests.

Figures

Fig. 1
Fig. 1. Enzymatic pathway for inositol lipid synthesis in BT.
a, The de novo sphingolipid synthesis metabolic pathway in relation to inositol lipid synthesis, with BT enzymes investigated in this study (bolded black) and representative lipid structures, with chain length and branching reflecting predominant structures determined by fatty acid methyl ester analysis (see Supplementary Information, Supplementary Figs. 1 and 2, and Table 6). Branching patterns of dihydroceramide-based lipids are predicted and not confirmed. Sphingolipid structures are named in purple and shown on a light blue background; glycerophospholipid structures are named in green on a grey background. Inositol lipids are outlined with a dashed line box. SPT, serine palmitoyltransferase. b, The genomic region of BT inositol and inositol lipid synthesis, with chromosomal numbering (shown in reverse orientation). Gene colour (blue or red) indicates membership in a predicted operon by BioCyc. Annotations are of the enzyme functions elucidated in this study (due to the lack of a lipid phenotype in its knockout strain, BT_1524 remains hypothetical). Substrates and products for the sphingolipid portion of a are not listed, as these reactions (beyond SPT) have not been characterized in the Bacteroidetes.
Fig. 2
Fig. 2. BT produces inositol phospholipids and sphingolipids.
a, TLC of five standards: PI-DAG, 16:0 phosphatidylinositol; CPE, ceramide phosphoethanolamine; PE-DAG, egg yolk phosphatidylethanolamine; Sa, d18:0 sphinganine; Cer, d18:1/18:0 ceramide (left); six standard (non-acidic) lipid extracts from the iSPT BT strain (used as a background for knockout generation) at 0, 0.2, 1, 5 and 100 ng ml−1 aTC induction of SPT, and WT BT VPI-5482 (middle); and standard lipid extraction from ΔBT_1522, ΔBT_1523, ΔBT_1525 and ΔBT_1526 knockout strains in the iSPT background at 100 ng ml−1 aTC induction of SPT (right). b, TLC of standards: PI-DAG, PE-DAG as in a (left), plus PIP-DAG, 18:1 PI(3)P (left); PIP-DAG lipid extractions of iSPT strains at 0 and 100 ng ml−1 aTC followed by iSPTΔBT_1522, iSPTΔBT_1523, iSPTΔBT_1525 and iSPTΔBT_1526 (middle); and each of their respective complementations at 100 ng ml−1 aTC induction of SPT (right). c, Predicted structures and ion chromatograms demonstrating detection of inositol lipids and sphingolipids in iSPT, iSPTΔBT_1522, iSPTΔBT_1523, iSPTΔBT_1525 and iSPTΔBT_1526 at 100 ng ml−1 aTC induction. Branching patterns of DHC-based lipids are predicted and not confirmed. Source data
Fig. 3
Fig. 3. BT_1526 produces myo-inositol-phosphate in vitro.
a, Proposed mechanism for the MIPS-catalysed NAD-dependent/redox-neutral conversion of G6P to MIP. b, Molybdenum blue assay for detection of MIP. Kinetic analysis of recombinant BT_1526 MIPS using G6P as substrate. c, The crystal structure of BT_1526 MIPS: (i) The monomer subunit, (ii) the tetramer, with cartoon representations to illustrate relative rotations of subunits and (iii) the structure of the MIPS:NAD complex in the cofactor binding site. Letters with numbers indicate the amino acid in the given position in the protein using the one-letter amino acid code. d, Production of inositol lipids during growth in inositol-supplemented minimal medium (‘Glc’, exclusively glucose in medium; ‘Inos:Glc’, 1:1 molar abundance of inositol:glucose). Intensity values for the lipid peak at m/z 781.48, PI-DAG 30:0, measured in lipid extracts from WT and ΔBT_1526 strains grown either in minimal medium with glucose as the carbon source, or a 1:1 mix of myo-inositol:glucose, with n = 2 biological replicates. The inset shows higher y-axis resolution for lipid peaks from the ΔBT_1526 strain. Source data
Fig. 4
Fig. 4. Inositol synthesis influences CPS loci expression and inositol lipids alter AMP resistance and in vivo fitness.
a, Gene expression data (normalized log2 expression values, scaled by row) in the 8 BT CPS loci. Genes were filtered to include those in which maximum log2-normalized expression is >1.5 and exclude those with maximum absolute log2-fold-change difference in expression <1.5 in all pairwise comparisons of conditions. The tree above the expression data represents the Euclidean column clustering defining the sample order by expression similarity. Colour in the far right column indicates gene assignment to one of 8 CPS loci. Strains tested include WT BT, iSPT, ΔBT_1522 and iSPTΔBT_1526 in the iSPT background. SPT induction in the iSPT strains at 0, 0.2, 1.0, 5.0 or 100 ng ml−1 aTC induction is indicated in shades of grey. Labels below each column indicate strain, induction level and replicate ID according to the following pattern: ‘(strain) - (aTC induction in ng ml−1) (replicate A/B)’. Blue and pink shading emphasizes replicates from the ΔBT_1526 and ΔBT_1522 strains, respectively. b, Percent abundance of inositol among total glycosyl residues detected in each WT and inositol lipid knockout strain (n = 3 biological replicates per strain tested; means ± s.d.). Legend and data colours are the same as in c and d. Full capsule analysis (lipids and glycosyl residues) are available in Extended Data Fig. 6. c, IC50 (n = 2 biological replicates per strain) for each WT and BT inositol lipid knockout strain in minimal medium supplemented with the cationic antimicrobial peptide LL-37. Data are representative of two experiments and represented as mean ± s.d. One-way ANOVA F(5,6) = 35.5; P = 0.0002; Tukey’s multiple comparisons: *P ≤ 0.05, **P ≤ 0.01, ***P ≤ 0.001. WT vs ΔBT_1523 P = 0.0124; WT vs ΔBT_1525 P = 0.0007; WT vs ΔBT_1526 P = 0.0016. d, Caecal BT colonization of mice after 14 d bacterial association. Copies of BT (c.f.u.-equivalents quantified by qPCR analysis of BT_1521 copy number) present in mouse caecal contents after 14 d strain association. One-way ANOVA F(3,28) = 5.6; P = 0.004; Tukey’s multiple comparisons: *P ≤ 0.05, **P ≤ 0.01 (n = 8 mice; each point is the mean of 3 technical replicate measurements). WT vs ΔBT_1526 P = 0.0496; ΔBT_1522 vs ΔBT_1523 P = 0.0480; ΔBT_1523 vs ΔBT_1526 P = 0.0050. Normality of data distribution was confirmed using the D’Agostino-Pearson test at alpha = 0.05. e, Percent abundances of WT in the combined WT + ΔBT_1523 population in the initial inoculum (n = 1, mean of 3 technical replicates) and in the caeca of 8 gnotobiotic mice following a 14 d colonization (n = 8 mice; each point is the mean of 3 technical replicates per mouse). The black line indicates the median of the WT BT abundance in mouse caeca following the competition experiment (73.0%). Source data
Fig. 5
Fig. 5. The capacity to produce PI-DHC is widespread among sphingolipid-producing bacteria.
a, TLC of lipid standards and lipid extractions from a diverse array of sphingolipid-producing bacteria. Lanes 1–5, left to right (purple background): PI-DAG, CPE, PE, Sa, Cer. From the sixth lane onwards (blue and green backgrounds) are standard Folch (non-acidic) lipid extractions from: BT iSPT 0 ng ml−1 aTC induction (no SL), WT BT, B. uniformis (DSM 6597), B. fragilis (DSM 2151), B. vulgatus H5_1 (DSM 108228), B. vulgatus (DSM 1447), Prevotella veroralis (ATCC 33779), Prevotella copri (DSM 18205), Porphyromonas gingivalis (DSM 20709), F. major (DSM 103), A. malorum (DSM 14337), S. paucimobilis (ATCC 29837) and N. acidiphiulum (DSM 19966). Homology to BT protein sequences in the inositol lipid cluster using NCBI BlastP (at e-values below 0.001) are indicated below species names with a white circle. Bacteroidetes spp. are on a blue background; 𝛂-Proteobacteria spp. are on a green background. b, Predicted structures and ion chromatograms of PI-DHC structures in lipids extracted from the diverse sphingolipid-producing species. PI-DHC structures include PI-DHC 34:0(OH), PI-DHC 35:0(OH), PI-DHC 36:0(OH), PI-DHC 35:0 and PI-DHC 36:0. Acyl chain length and branching patterns of lipid structures shown are hypothetical, with this distribution probably variable between species. Source data
Fig. 6
Fig. 6. The capacity for inositol lipid synthesis is widespread within the Bacteroidetes.
a, Maximum-likelihood-based phylogeny of representative Bacteroides, Prevotella and Parabacteroides species produced from 71 conserved single-copy genes present in all genomes (identified and concatenated using Anvi’o) and generated by RAxML (best tree; substitution model PROTCAT, matrix name DAYHOFF, Hill-climbing algorithm, bootstrap 50); Flavobacterium faecale is included as an outgroup. The rings surrounding the tree indicate species with genes that have NCBI BlastP homology to the BT inositol lipid cluster (in light purple; BT_1522, BT_1523, BT_1525, BT_1526), the BT Minpp (BT_4744), or representative proteins from the Bacteroides vulgatus putative alternative inositol lipid cluster (in dark purple; phosphatidyltransferase: BVU_RS13105 ‘BV Ptrans’; HAD hydrolase: BVU_RS13115 ‘BV HAD’; NTP transferase: BVU_RS13095 ‘BV NTP’). Homology at an e-value below 1 × 10−8 is indicated by dark coloration in the inner circles. b, Genomic regions surrounding the BT_1526/MIPS homologue in representative Bacteroidetes, compiled using the PATRIC 3.6.9 Compare Region Viewer. Protein homology (determined using NCBI BlastP) to proteins in the BT-like inositol lipid metabolism cluster (left in key) or the Bacteroides vulgatus-like putative alternative inositol metabolism cluster (right in key) is indicated by colour. The functions of enzymes in bold were characterized in this study; sequences with predicted redundant functions between both clusters are linked in the key.
Extended Data Fig. 1
Extended Data Fig. 1. Lipid structures and fragmentation patterns of BT inositol and ethanolamine lipids.
(A) Comparison of LC-MS/MS fragmentation patterns of ΔBT_1525 BT-derived phosphatidylinositol phosphate (PIP-DAG) with the synthetic standard, PI(3)P 18:1/18:1. (B) LC-MS/MS fragmentation patterns of lipid structures present in iSPT BT at 100 ng/mL aTC induction, including phosphoinositol dihydroceramide (PI-DHC) lipids (PI-DHC 34:0(OH), PI-DHC 35:0(OH), PI-DHC 36:0(OH)), PI-DAG 30:0, and PE-DHC 36:0(OH). Loss of the phosphoinositol head group is indicated at mass 259. Fragments characteristic for lipids with phosphoinositol-based headgroups are in red; those for phosphoethanolamine-based headgroups are in blue. Branching patterns of DHC-based lipids are predicted.
Extended Data Fig. 2
Extended Data Fig. 2. Summary of lipid species and inositol metabolites produced by each WT or knockout strain.
Lipid color scheme is consistent with Fig. 2. Red x = not present; green check = present. Inositol-P (“inos-P”) is described as present/absent dependent on the presence of the BT_1526 gene. PIP-DAG = phosphatidylinositol phosphate; PI-DAG = phosphatidylinositol; PI-DHC = phosphoinositol dihydroceramide; PE-DHC = phosphoethanolamine dihydroceramide; PE-DAG = phosphatidylethanolamine. Yellow background for PIP-DAG presence/absence indicates PIP-DAG presence (determined by presence of downstream metabolites), but these lipids are not detectable by mass spectrometry, due to predicted fast turnover.
Extended Data Fig. 3
Extended Data Fig. 3. Lipid comparison of the ΔBT_1524 strain compared to iSPT.
TLC of lipid standards and Folch (non-acidic) lipid extractions from iSPT and ΔBT_1524 strains of BT. Lanes 1–8, left to right: LPC = 16:0 lyso-phosphatidylcholine; PI-DAG = 16:0 phosphatidylinositol; PC = 16:0 phosphatidylcholine; CPE = ceramide phosphoethanolamine; PE = egg yolk phosphatidylethanolamine; CL = cardiolipin (from bovine heart); Sa = d18:0 sphinganine; Cer = d18:1/18:0 ceramide. Following the dashed white line, in lanes 9–10, are iSPT BT lipid extracts from cells grown with 0 or 100 ng/mL aTC induction of SPT. In the final two lanes (11–12) are lipid extracts from ΔBT_1524 BT. “A” and “B” refer to independently generated knockout strains, both confirmed by Sanger sequencing. The retention factors for inositol lipids (phosphatidylinositol “PI-DAG” and phosphoinositol dihydroceramide “PI-DHC”) are indicated by labels to the right of the figure. Source data
Extended Data Fig. 4
Extended Data Fig. 4. Structural comparison of prokaryotic and eukaryotic MIPS proteins.
Secondary structure alignment of MIPS BT_1526 (in yellow) and Saccharomyces cerevisiae MIPS (PDBID: 1P1i) (in cyan). The N-terminal extension present in eukaryotic MIPS structures is highlighted with a gray oval.
Extended Data Fig. 5
Extended Data Fig. 5. Scanning electron microscopy of the iSPT and ΔBT_1526 strains.
Cells were grown in minimal medium at 0 and 100 ng/mL anhydrotetracycline (aTC) induction of SPT prior to imaging by the Max Planck for Biology Tübingen Electron Microscopy Core Facility. Images are representative of multiple images derived from a single experiment.
Extended Data Fig. 6
Extended Data Fig. 6. Capsular components of WT and inositol lipid knockout strains.
(A-D) Glycosyl residues detected in the capsular extraction from each strain, presented as percent molar abundance of total glycosyl residues detected (n = 3 biological replicates per strain tested; data represented as mean values ± S.D.), in separate figures to better compare relative abundances between residues at similar concentrations. Values are in Source Data Table 6. Glc = glucose; GalNAc = N-acetylgalactosamine; GlcNAc = N-acetylglucosamine; Rha = rhamnose; GlcA = glucuronic acid; GalA = galacturonic acid; Man = mannose; Gal = galactose; Fuc = fucose; Xyl = xylose; Inos = inositol. (E) Fatty acid species detected in the capsular extraction from each strain, presented as percent abundance of total fatty acids detected (n = 3 biological replicates per strain tested; data represented as mean values ± S.D.). “15:0(OH)” is in quotations due to uncertainty of its identity - this lipid had a diagnostic signal for a 3-OH fatty acid eluting at RT = 34.800 min, however we could not detect a diagnostic m/z EI fragment (329) characteristic for hydroxypentadecanoic acid (15:0(3:OH)), instead finding an EI fragment at m/z 319. Source data
Extended Data Fig. 7
Extended Data Fig. 7. Growth curves of inositol lipid knockout strains in rich and minimal media.
(A) Growth curves of WT BT and inositol lipid knockout strains in rich medium (BHIS) at 37 °C in anaerobic conditions (all curves with average of n = 3 shown), measured in 96-well format as optical density at 600 nm (OD600). (B) Strain growth in minimal medium (BMM), inoculated using cultures previously growing in rich medium (BHIS).
Extended Data Fig. 8
Extended Data Fig. 8. Pathway comparison between the BT inositol lipid cluster and the predicted alternative inositol lipid pathway.
At left, the BT-like inositol lipid synthesis pathway defined in this work. At right, the putative inositol lipid synthesis pathway genomically predicted for multiple Bacteroidetes spp., with predicted enzymes (in purple) from the Bacteroides vulgatus genome (NCBI reference sequence NC_009614.1). Inositol glycerophospholipids are on a gray background with green text; inositol sphingolipids are on a white background with red text. Branching patterns of BT DHC-based lipids and B. vulgatus lipids are predicted and not confirmed. SPT = serine palmitoyltransferase; MIPS = myo-inositol phosphate synthase; PIPPh = phosphatidylinositol phosphate phosphatase.
Extended Data Fig. 9
Extended Data Fig. 9. Non-hydroxylated inositol-like lipid structures in diverse sphingolipid-producing species.
(A) LC-MS/MS fragmentation patterns of lipids extracted from Novosphingobium acidiphilum consistent with the synthesis of PI-DHC 35:0 and 36:0. (B) LC-MS/MS fragmentation pattern of lipids extracted from Sphingomonas paucimobilis, demonstrating the presence of a headgroup with the same mass as inositol phosphate (259) but lacking the characteristic fragment of this group (241). As such, the headgroup identity remains tentative and is represented with a phosphohexose. (C) LC-MS/MS spectra and fragmentation pattern of a P(Glycerol)-DHC 36:0 structure present in Prevotella copri, Porphyromonas gingivalis, and Bacteroides vulgatus. Branching patterns and acyl chain distribution of lipid structures shown are possible representative structures and are not confirmed.

References

    1. Nakase M, et al. Mannosylinositol phosphorylceramide is a major sphingolipid component and is required for proper localization of plasma-membrane proteins in Schizosaccharomyces pombe. J. Cell Sci. 2010;123:1578–1587. doi: 10.1242/jcs.059139. - DOI - PubMed
    1. Megyeri M, Riezman H, Schuldiner M, Futerman AH. Making sense of the yeast sphingolipid pathway. J. Mol. Biol. 2016;428:4765–4775. doi: 10.1016/j.jmb.2016.09.010. - DOI - PubMed
    1. Dickson EJ, Hille B. Understanding phosphoinositides: rare, dynamic, and essential membrane phospholipids. Biochem. J. 2019;476:1–23. doi: 10.1042/BCJ20180022. - DOI - PMC - PubMed
    1. Phan TK, et al. Phosphoinositides: multipurpose cellular lipids with emerging roles in cell death. Cell Death Differ. 2019;26:781–793. doi: 10.1038/s41418-018-0269-2. - DOI - PMC - PubMed
    1. Haites RE, Morita YS, McConville MJ, Billman-Jacobe H. Function of phosphatidylinositol in mycobacteria. J. Biol. Chem. 2005;280:10981–10987. doi: 10.1074/jbc.M413443200. - DOI - PubMed

Publication types