. 2022 Jun 20;12(1):10382.
doi: 10.1038/s41598-022-14275-x.

The relative abundances of yeasts attractive to Drosophila suzukii differ between fruit types and are greatest on raspberries

Affiliations

The relative abundances of yeasts attractive to Drosophila suzukii differ between fruit types and are greatest on raspberries

Rory Jones et al. Sci Rep. .

Abstract

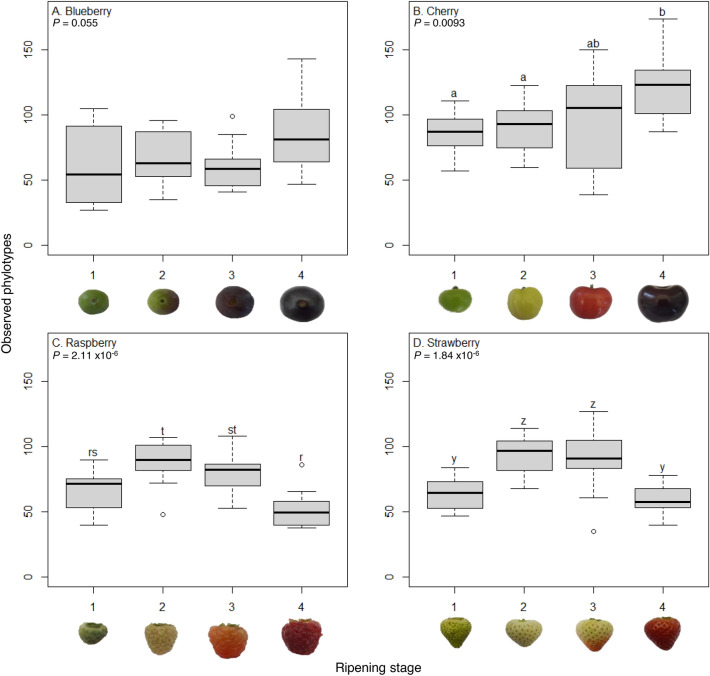
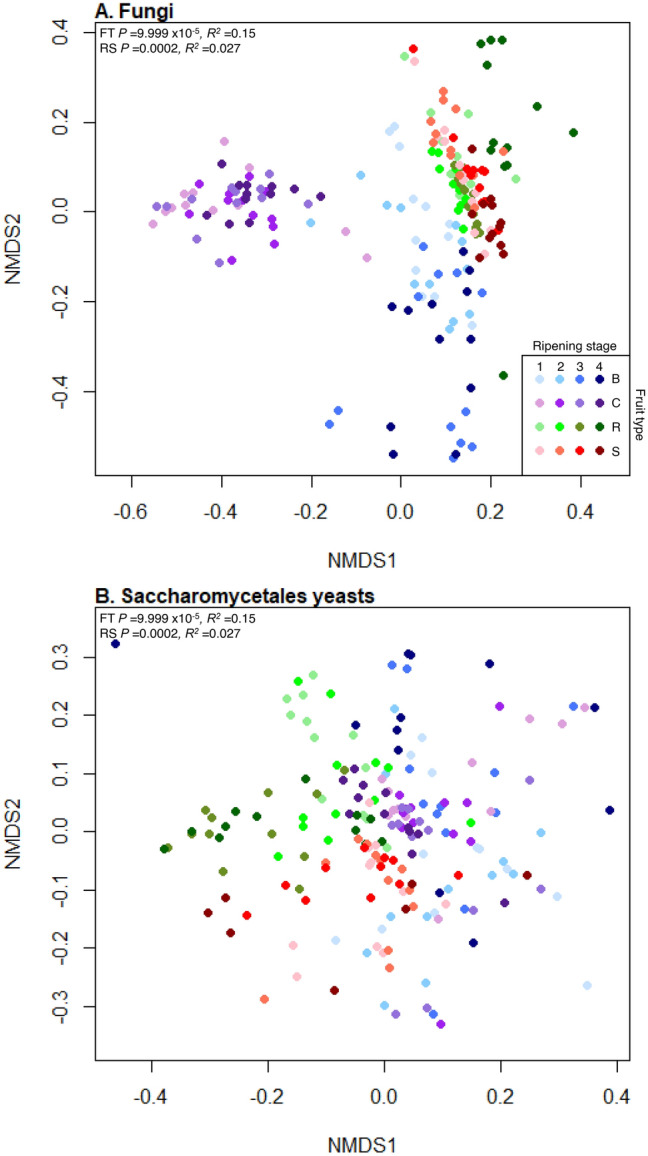
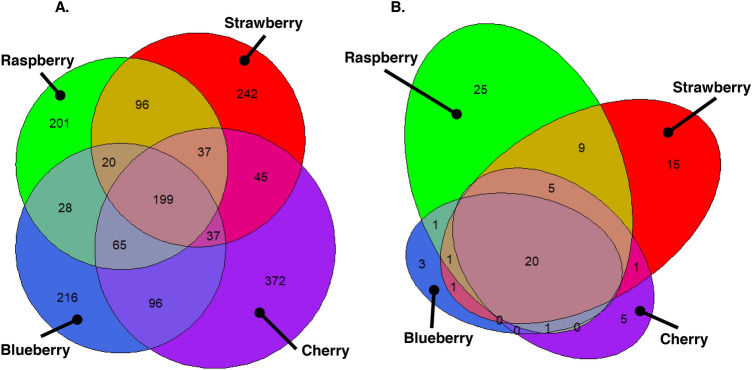
Fungal metabolic volatiles attract Drosophila suzukii which oviposits in ripening fruits, but there are few data describing the fungal microbiomes of commercial fruits susceptible to this insect pest. We tested the hypothesis that fruit type and ripening stage have a significant effect on fruit surface fungal communities using DNA metabarcoding approaches and found strong support for differences in all three fungal community biodiversity metrics analysed (numbers, types, and abundances of taxa). There was an average fivefold greater difference in fungal communities between sites with different fruit types (strawberry, cherry, raspberry, and blueberry) than across fruit developmental stages, demonstrating site and/or fruit type is the greater factor defining fungal community assemblage. The addition of a fungal internal standard (Plectosphaerella cucumerina) showed cherry had relatively static fungal populations across ripening. Raspberry had a greater prevalence of Saccharomycetales yeasts attractive to D. suzukii, including Hanseniaspora uvarum, which aligns with reports that raspberry is among the fruits with greatest susceptibility and attraction to D. suzukii. Greater knowledge of how yeast communities change during fruit maturation and between species or sites may be valuable for developing methods to manipulate fruit microbiomes for use in integrated pest management strategies to control D. suzukii.


Conflict of interest statement

The authors declare no competing interests.

Figures

Figure 1
Figure 1
Absolute fungal cell abundances on cherry epicarp. Number of total fungal (A) and Saccharomycetales yeasts (B) cells per mm2 of cherry epicarp (N = 6 except, stage 3 and 4, N = 5) at four ripening stages (1, unripe/green fruit; 2, de-greening fruit; 3, ripening fruit; and 4, fully ripe/harvest fruit) estimated from DNA read abundances normalised to DNA abundances from the deliberate addition of 265 live Plectosphaerella cucumerina cells prior to DNA extraction. Different lower-case letters above bars show significant differences between ripening stages at P > 0.05, Dunn’s comparisons post-hoc with Benjamini–Hochberg multiple comparison correction.
Figure 2
Figure 2
Number of observed phylotypes across fruit types and maturation stages. Number of fungal phylotypes across four ripening stages (1, unripe/green fruit; 2, de-greening fruit; 3, ripening fruit; and 4, fully ripe/harvest fruit) for blueberry, cherry, raspberry and strawberry (N = 12 except N = 11 for strawberry stage 3). Numbers of fungal phylotypes differ across ripening stages for cherry, raspberry and strawberry but not blueberry (ANOVA, P values shown). Where significant, different lowercase letters represent significant differences in phylotype numbers within each fruit (P < 0.028) with separate Dunn’s comparisons post-hoc (with Benjamini–Hochberg multiple comparison correction). Different letter groups show any significant differences between ripening stages within each fruit separately.
Figure 3
Figure 3
NMDS plots representing the differential presences of fungal phylotypes. Nonmetric Multidimensional Scaling (NMDS) plots of binary Jaccard measures of community dissimilarity of (A) total fungal communities and (B) Saccharomycetales budding yeasts on blueberry (blue), cherry (purple), raspberry (green) and strawberry (red) at four ripening stages (1, unripe/green fruit; 2, de-greening fruit; 3, ripening fruit; and 4, fully ripe/harvest fruit; denoted by shade of colour, lightest shade for green fruit and moving through to darkest shade for fully ripe/harvest). Both total fungal and Saccharomycetales yeasts communities significantly differ in the presences of phylotypes across all fruit types (FT) and ripening stages (RS) by PermANOVA (values shown top right).
Figure 4
Figure 4
NMDS plots representing the differential abundances of fungal phylotypes. Nonmetric Multidimensional Scaling (NMDS) plots of abundance Jaccard measures of community dissimilarity of (A) total fungal communities and (B) Saccharomycetales budding yeasts on blueberry (blue), cherry (purple), raspberry (green) and strawberry (red) at four ripening stages (1, unripe/green fruit; 2, de-greening fruit; 3, ripening fruit; and 4, fully ripe/harvest fruit; denoted by shade of colour, lightest shade for green fruit and moving through to darkest shade for fully ripe/harvest). Both total fungal and Saccharomycetales yeasts communities significantly differ in the presences of phylotypes across all fruit types (FT) and ripening stages (RS) by PermANOVA (values shown top left).
Figure 5
Figure 5
Comparison of shared and discrete numbers of fungal and Saccharomycetales phylotypes between fruits. Venn diagrams of phylotype counts across fruit types for (A) all fungal phylotypes, and (B) Saccharomycetales phylotypes; overlapping segments are approximately proportional to values.
Figure 6
Figure 6
Dynamics of changes in the proportion of budding yeast indicator phylotypes. Mean proportion of reads for the Saccharomycetales budding yeast indicator phylotypes that are significantly overrepresented on (A) raspberry and (B) strawberry (P < 0.04) across the four ripening stages (1, unripe/green fruit; 2, de-greening fruit; 3, ripening fruit; and 4, fully ripe/harvest fruit). Indicator phylotypes are reported to the taxonomic level assigned: lower case letter refers to the taxonomic hierarchy of respective taxa (g = genus; f = family; k = kingdom). Where possible, assignment to genus taxonomic levels is shown in parentheses from matches to deposits in Genbank with > 97% homology identified by manual Blast searches.

References

    1. Ruxton GD, Wilkinson DM, Schaefer HM, Sherratt TN. Why fruit rots: Theoretical support for Janzen's theory of microbe–macrobe competition. Proc. R. Soc. B Biol. Sci. 2014;281:20133320. doi: 10.1098/rspb.2013.3320. - DOI - PMC - PubMed
    1. Knight S, Klaere S, Fedrizzi B, Goddard MR. Regional microbial signatures positively correlate with differential wine phenotypes: Evidence for a microbial aspect to terroir. Sci. Rep. 2015;5:1–10. doi: 10.1038/srep14233. - DOI - PMC - PubMed
    1. Lukša J, Vepštaitė-Monstavičė I, Yurchenko V, Serva S, Servienė E. High content analysis of sea buckthorn, black chokeberry, red and white currants microbiota—A pilot study. Food Res. Int. 2018;111:597–606. doi: 10.1016/j.foodres.2018.05.060. - DOI - PubMed
    1. Vepštaitė-Monstavičė I, et al. Distribution of apple and blackcurrant microbiota in Lithuania and the Czech Republic. Microbiol. Res. 2018;206:1–8. doi: 10.1016/j.micres.2017.09.004. - DOI - PubMed
    1. Cordero-Bueso G, et al. Influence of the farming system and vine variety on yeast communities associated with grape berries. Int. J. Food Microbiol. 2011;145:132–139. doi: 10.1016/J.IJFOODMICRO.2010.11.040. - DOI - PubMed

Publication types