Clinical Trial
. 2022 Jul;28(7):1432-1438.
doi: 10.1038/s41591-022-01861-9. Epub 2022 Jun 20.

Licogliflozin for nonalcoholic steatohepatitis: a randomized, double-blind, placebo-controlled, phase 2a study

Affiliations
Clinical Trial

Licogliflozin for nonalcoholic steatohepatitis: a randomized, double-blind, placebo-controlled, phase 2a study

Stephen A Harrison et al. Nat Med. 2022 Jul.

Abstract

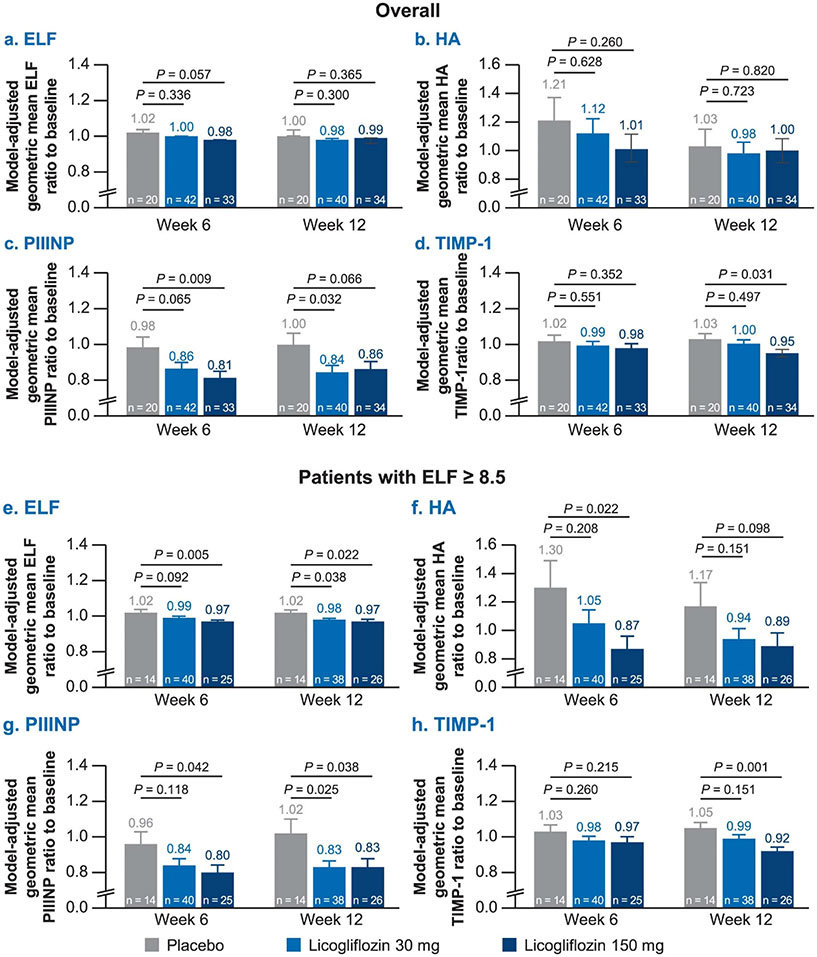
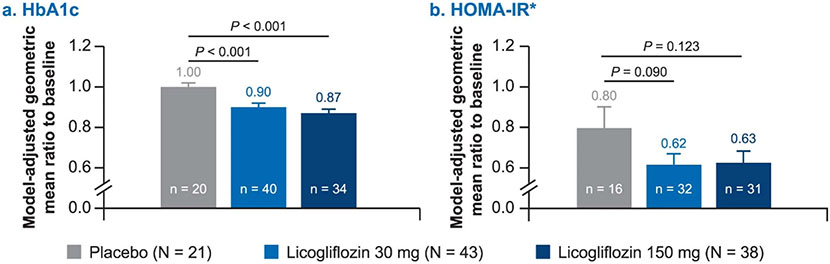
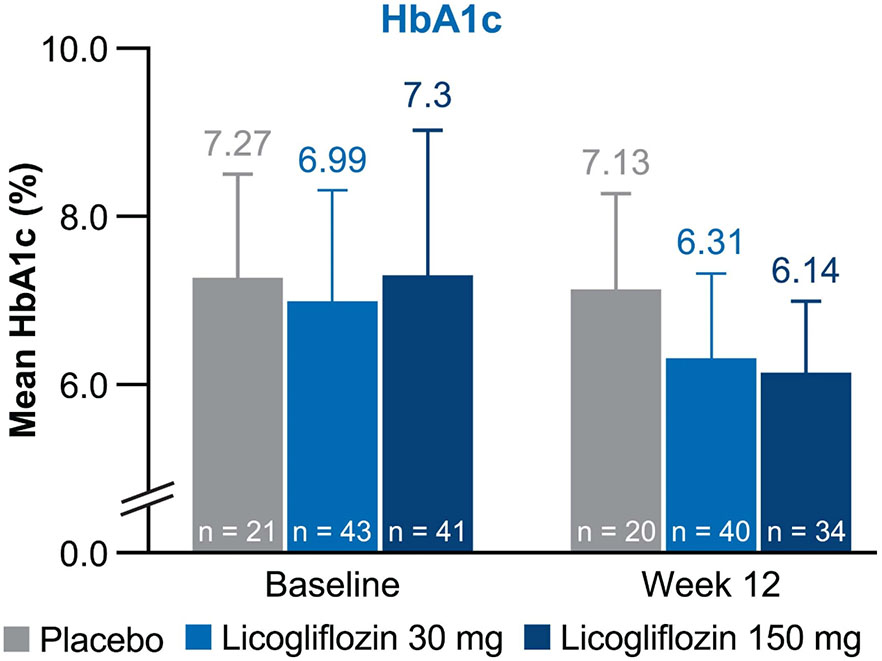
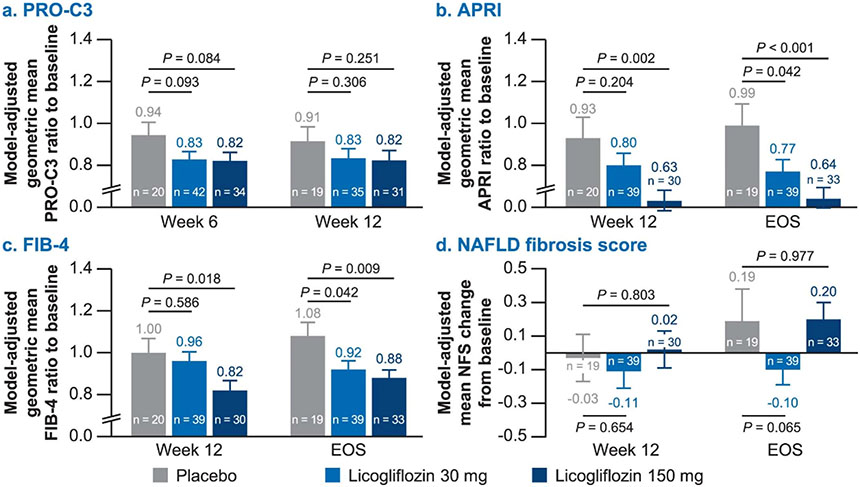
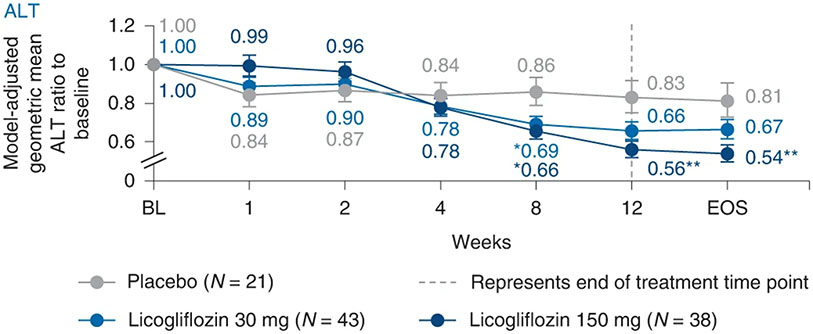
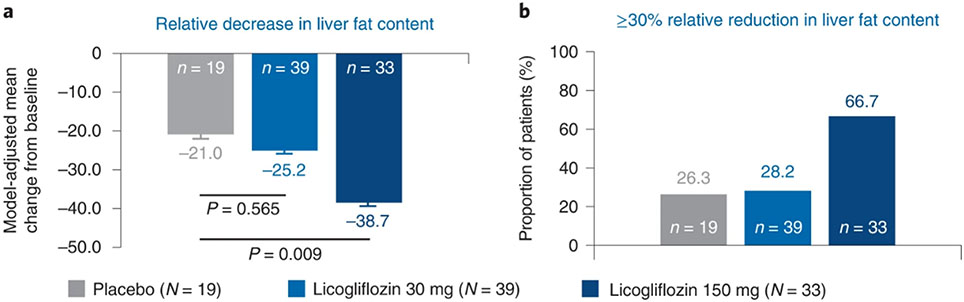
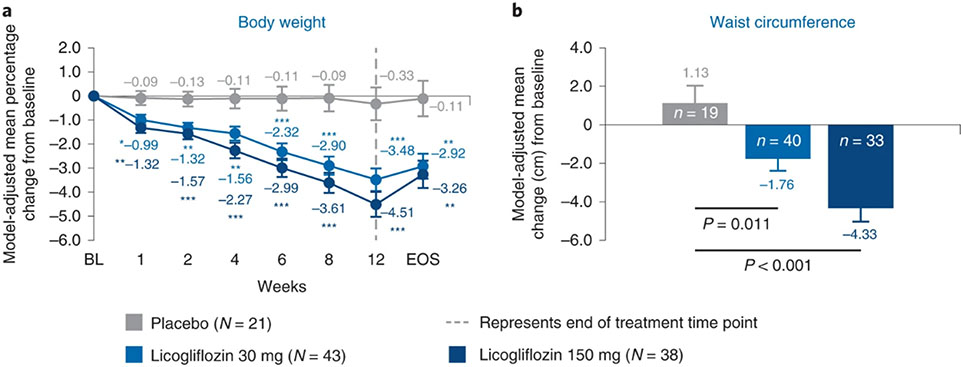
Nonalcoholic steatohepatitis (NASH) is a common chronic liver disease that may advance to fibrosis and lead to mortality; however, no pharmacotherapy is currently available. We tested the hypothesis that inhibition of both the sodium-glucose cotransporters 1 and 2 with licogliflozin would lead to improvement in NASH. A total of 107 patients with phenotypic or histologic NASH were randomized (1:2:2) to receive oral administration of either placebo (n = 21), licogliflozin 30 mg (n = 43) or 150 mg (n = 43) once daily for 12 weeks. Licogliflozin 150 mg showed a significant 32% (80% confidence interval (CI): 21-43%; P = 0.002) placebo-adjusted reduction in serum alanine aminotransferase after 12 weeks of treatment, the primary endpoint of the study. However, the 30 mg dose of licogliflozin did not meet the primary endpoint (placebo-adjusted reduction 21% (80% CI: 7-32%; P = 0.061)). Diarrhea occurred in 77% (33 of 43), 49% (21 of 43) and 43% (9 of 21) of patients treated with licogliflozin 150 mg, 30 mg and placebo, respectively, which was mostly mild in severity. No other major safety concerns were identified. Treatment with 150 mg licogliflozin led to reductions in serum alanine aminotransferase in patients with NASH. Studies of longer duration and in combination with drugs that have different mechanisms of action are needed to validate these findings and to define a role of licogliflozin as a therapeutic option for NASH. ClinicalTrials.gov identifier: NCT03205150.


Figures

Extended Data Fig. 1:
Extended Data Fig. 1:. Overview of the study design.
Patients were screened during a 28-day window, followed by a baseline run-in period of 14-days prior to the day of first treatment. Patients were then randomized in a 1:2:2 ratio to receive a placebo or licogliflozin at 30 mg or 150 mg daily. The study drug was stopped after 12-weeks of treatment and patients were subsequently followed up for 28-days.
Extended Data Fig. 2:
Extended Data Fig. 2:. Change in absolute liver fat content after 12 weeks of treatment with licogliflozin.
a, Absolute decrease in liver fat content (mean change from baseline); b, proportion of patients (%) with an ≥5% absolute reduction in liver fat content. Baseline is defined as the last available measurement prior to the first dose. P values based on two-sided ANCOVA test. Error bars represent s.e. n, number of patients in each treatment group.
Extended Data Fig. 3:
Extended Data Fig. 3:. Liver fat in subgroup of patients with baseline percentage liver fat content ≥10%.
a, Absolute reduction in liver fat content (mean change from baseline); b, relative reduction in liver fat content (% change from baseline). Baseline is defined as the last available measurement prior to the first dose. P values based on two-sided ANCOVA test. n, number of patients in each treatment group.
Extended Data Fig. 4:
Extended Data Fig. 4:. Change in serum AST and GGT levels after 12 weeks of treatment with licogliflozin.
a, AST; b, GGT. Data presented as geometric mean ratio to baseline. Baseline is defined as the mean of measurements taken at the screening and baseline visits. A repeated-measures ANCOVA was performed for the log-transformed ratio to baseline. P values based on two-sided ANCOVA test: *P < 0.05, **P < 0.01, and ***P < 0.001. Error bars represent s.e. n for placebo, licogliflozin 30 mg, and licogliflozin 150 mg for AST: 21, 42, 38 (day 7); 21, 43, 36 (day 14); 21, 41, 33 (day 28); 20, 40, 33 (day 56); 20, 40, 34 (day 84); 19, 39, 34 (EOS); GGT: 21, 42, 38 (day 7); 21, 43, 36 (day 14); 21, 42, 34 (day 28); 20, 42, 34 (day 56); 20, 40, 34 (day 84); 19, 39, 34 (EOS). Dotted gray line represents end-of-treatment time point.
Extended Data Fig. 5:
Extended Data Fig. 5:. Changes in ELF panel and its components after 12 weeks of treatment.
a, ELF; b, HA; c, PIIINP; d, TIMP1; e, ELF (patient ≥ 8.5); f, HA (patient ≥ 8.5); g, PIIINP (patient ≥ 8.5); h, TIMP1 (patient ≥ 8.5). All data presented as geometric mean ratio to baseline. Baseline is defined as the last available measurement prior to the first dose. P values based on two-sided ANCOVA test. N for placebo, licogliflozin 30 mg, and 150 mg are 18, 34, and 29 (ELF, HA, PIIINP, TIMP1); 14, 40, and 26 (ELF ≥ 8.5, HA ≥ 8.5, PIIINP ≥ 8.5, TIMP1 ≥ 8.5). n, number of patients in each treatment group. Error bars represent s.e.
Extended Data Fig. 6:
Extended Data Fig. 6:. Change in metabolic parameters from baseline up to week 12.
a, HbA1c; b, HOMA-IR. *Ten patients who received exogenous insulin were excluded from HOMA-IR calculation (placebo (n = 3), licogliflozin 30 mg (n = 5), and licogliflozin 150 mg (n = 2)). Data presented as geometric mean ratio to baseline. P values based on two-sided ANCOVA test. Baseline is defined as the last available measurement prior to the first dose. n, number of patients in each treatment group. N for placebo, licogliflozin 30 mg, and licogliflozin 150 mg for HbA1c are 20, 40, and 34; N for HOMA-IR are placebo (n = 16), licogliflozin 30 mg (n = 32), and licogliflozin 150 mg (n = 31). Error bars represent s.e.
Extended Data Fig. 7:
Extended Data Fig. 7:. Mean HbA1c by treatment at baseline and week 12.
Data presented as mean (%). Error bars represent SD. n for placebo, licogliflozin 30 mg, and licogliflozin 150 mg for baseline: 21, 43, 41; week 12: 20, 40, 34.
Extended Data Fig. 8:
Extended Data Fig. 8:. Changes in biomarkers of liver fibrosis after 12 weeks of treatment with licogliflozin.
Data presented in subfigures (a–c) as geometric mean ratio to baseline, and in subfigure d, as mean change from baseline. a, PRO-C3; b, APRI; c, FIB4; d, NAFLD fibrosis score. Baseline is defined as the last available measurement prior to the first dose. P values based on two-sided ANCOVA test. N for placebo, licogliflozin 30 mg, and 150 mg are 21, 43, and 37 (APRI, FIB4, NAFLD fibrosis score) 20, 42, and 34 (Pro-C3). Error bars represent s.e.
Extended Data Fig. 9:
Extended Data Fig. 9:. Study outcomes with licogliflozin treatment in patients with or without diarrhea.
a, Bodyweight; b, ALT; c, placebo-adjusted decrease in LFC. P values based on two-sided ANCOVA test: *P < 0.05, **P < 0.01, and ***P < 0.001. Dotted gray line represents end of treatment time point. Data in subfigure a presented as mean % change from baseline, b, as geometric mean ratio to baseline, and c, as mean (%) reduction. Error bars represent s.e. n for placebo, licogliflozin 30 mg, and licogliflozin 150 mg for bodyweight in subgroup with diarrhea: 12, 21, 8 (day 7); 12, 22, 8 (day 14); 11, 21, 5 (day 28); 11, 21, 7 (day 42); 11, 21, 7 (day 56); 10, 19, 7 (day 84); 10, 19, 7 (EOS); bodyweight in subgroup without diarrhea: 9, 21, 30 (day 7); 9, 21, 28 (day 14); 9, 21, 25 (day 28); 9, 21, 27 (day 42); 9, 21, 26 (day 56); 9, 21, 27 (day 84); 9, 21, 27 (EOS). ALT in subgroup with diarrhea: 12, 21, 8 (day 7); 12, 22, 8 (day 14); 12, 21, 7 (day 28); 11, 21, 7 (day 56); 11, 19, 6 (day 84); 10, 18, 7 (EOS); ALT in subgroup without diarrhea: 9, 21, 30 (day 7); 9, 21, 28 (day 14); 9, 21, 27 (day 28); 9, 21, 27 (day 56); 9, 21, 26 (day 84); 9, 21, 27 (EOS). LFC in subgroup with diarrhea: 11, 18, 7 (day 84) and in subgroup without diarrhea: 8, 21, 26 (day 84). LFC, liver fat content.
Extended Data Fig. 10:
Extended Data Fig. 10:. Summary of findings of licogliflozin in NASH.
1He, Y.L. et al. Diabetes Obes. Metab. 21, 1311–1321 (2019). 2Current study data. ALT, alanine aminotransferase; GLP-1, glucagon-like peptide 1; NASH, nonalcoholic steatohepatitis; SGLT, sodium–glucose cotransporters; wt, weight.
Fig. 1:
Fig. 1:. Patient disposition.
Two patients in the licogliflozin 150 mg treatment group were excluded from the PD analysis set: one patient was excluded due to <80% compliance in study treatment administration, and the second patient because study treatment was administered in the evening, instead of at lunchtime, throughout the study. BL, baseline; n, number of patients in each treatment group; PD, pharmacodynamics; PK, pharmacokinetic; SAF, safety analysis set.
Fig. 2:
Fig. 2:. Changes in levels of serum alanine aminotransferase from baseline up to week 12.
Data are presented as geometric mean ratio of ALT to baseline. Baseline is defined as the mean of measurements taken at the screening and baseline visits. A repeated-measures ANCOVA was performed for the log-transformed ratio to baseline. P values were based on two-sided ANCOVA test: *P < 0.05, **P < 0.01. Error bars represent s.e.; n for placebo, licogliflozin 30 mg and licogliflozin 150 mg are 21, 42, 38 (day 7); 21, 43, 36 (day 14); 21, 42, 34 (day 28); 20, 42, 34 (day 56); 20, 40, 34 (day 84); 19, 39, 34 (EOS). n, number of patients in each treatment group; s.e., standard error.
Fig. 3:
Fig. 3:. Change in relative liver fat content after 12 weeks of treatment with licogliflozin.
a, Relative decrease in liver fat content (mean change from baseline). b, Proportion of patients (%) with ≥30% relative reduction in liver fat content. Baseline is defined as the last available measurement before the first dose. P values based on two-sided ANCOVA test. Error bars represent s.e. n, number of patients in each treatment group.
Fig. 4:
Fig. 4:. Change in anthropometric parameters from baseline up to week 12.
a, Mean percentage change in bodyweight from baseline. b, Mean change in waist circumference from baseline. *P < 0.05, **P < 0.01 and ***P < 0.001. P values based on two-sided ANCOVA test. Baseline is defined as the last available measurement before the first dose. n for placebo, licogliflozin 30 mg and licogliflozin 150 mg for bodyweight are 21, 42, 38 (day 7); 21, 43, 36 (day 14); 20, 42, 30 (day 28); 20, 42, 34 (day 42); 20, 42, 33 (day 56); 19, 40, 34 (day 84); 19, 40, 34 (EOS), respectively. n for placebo, licogliflozin 30 mg and licogliflozin 150 mg for waist circumference are 19, 40 and 33, respectively. Error bars represent s.e. n, number of patients in each treatment group.

References

    1. Younossi Z et al. Global burden of NAFLD and NASH: trends, predictions, risk factors and prevention. Nat. Rev. Gastroenterol. Hepatol 15, 11–20 (2018). - PubMed
    1. Chalasani N et al. The diagnosis and management of nonalcoholic fatty liver disease: practice guidance from the American Association for the Study of Liver Diseases. Hepatology 67, 328–357 (2018). - PubMed
    1. Williams CD et al. Prevalence of nonalcoholic fatty liver disease and nonalcoholic steatohepatitis among a largely middle-aged population utilizing ultrasound and liver biopsy: a prospective study. Gastroenterology 140, 124–131 (2011). - PubMed
    1. Wong VW et al. Pathogenesis and novel treatment options for non-alcoholic steatohepatitis. Lancet Gastroenterol. Hepatol 1, 56–67 (2016). - PubMed
    1. Younossi ZM Non-alcoholic fatty liver disease - A global public health perspective. J. Hepatol 70, 531–544 (2019). - PubMed

Publication types

MeSH terms

Associated data