. 2022 Jun 20;13(1):3536.
doi: 10.1038/s41467-022-31151-4.

Near-zero-index ultra-fast pulse characterization

Affiliations

Near-zero-index ultra-fast pulse characterization

Wallace Jaffray et al. Nat Commun. .

Abstract

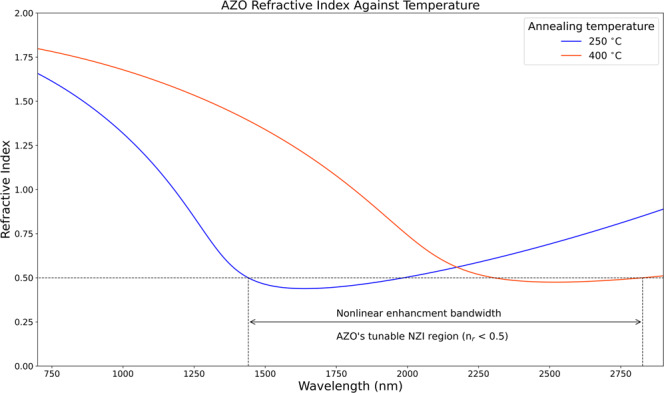
Transparent conducting oxides exhibit giant optical nonlinearities in the near-infrared window where their linear index approaches zero. Despite the magnitude and speed of these nonlinearities, a "killer" optical application for these compounds has yet to be found. Because of the absorptive nature of the typically used intraband transitions, out-of-plane configurations with short optical paths should be considered. In this direction, we propose an alternative frequency-resolved optical gating scheme for the characterization of ultra-fast optical pulses that exploits near-zero-index aluminium zinc oxide thin films. Besides the technological advantages in terms of manufacturability and cost, our system outperforms commercial modules in key metrics, such as operational bandwidth, sensitivity, and robustness. The performance enhancement comes with the additional benefit of simultaneous self-phase-matched second and third harmonic generation. Because of the fundamental importance of novel methodologies to characterise ultra-fast events, our solution could be of fundamental use for numerous research labs and industries.


Conflict of interest statement

The authors declare no competing interests.

Figures

Fig. 1
Fig. 1. Zero-Index FROG.
a Experimental setup used to record FROG traces. Central panel summarises input/outputpolarisation states. Maximum frequency conversion was attained for horizontally polarised input beams for both SH and TH (both horizontally polarised). No harmonic generation can be found for a vertically polarised input. b Breakdown of phase matching conditions for each harmonic generated in the film.
Fig. 2
Fig. 2. Nonlinear efficiency comparison amongst flat systems.
2D materials, metasurfaces, perovskite nanocrystals, and NZI thin films are considered as benchmark technologies.
Fig. 3
Fig. 3. SH-FROG measurements.
a SH FROG traces experimentally acquired from our AZO film. b Reconstructed FROG traces generated by the FROG retrieval algorithm (Retrieval error of 0.0027). c Recovered temporal amplitude (solid blue line) and phase (dashed orange line) profiles (FWHM time duration t=30.61fs). d Recovered spectral amplitude (solid blue line) and phase (dashed orange line) profiles. This plot also reports the experimentally acquired input spectra (dotted green line) for comparison.
Fig. 4
Fig. 4. TH-FROG measurements.
a TH FROG traces experimentally acquired from our AZO film. b Reconstructed FROG traces generated by the FROG retrieval algorithm (Retrieval error of 0.0067). c Recovered temporal amplitude (solid blue line) and phase (dashed orange line) profiles (FWHM time duration t=30.48fs). d Recovered spectral amplitude (solid blue line) and phase (dashed orange line) profiles. This plot also reports the experimentally acquired input spectra (dotted green line) for comparison.
Fig. 5
Fig. 5. Operational bandwidth measurements.
TH autocorrelations as taken at various input central wavelengths. The NZI nonlinear bandwidth has a FWHM of 268 nm (enough to accommodate a 9 fs transform-limited pulse).
Fig. 6
Fig. 6. Optical properties engineering via fabrication means.
Refractive index dispersions of AZO thin films are reported for two different annealing temperatures (250 °C, blue curve on the left; and 400 °C, red curve on the right). The data in this plot have been repurposed from.
Fig. 7
Fig. 7. SH and TH sensitivity analysis in NZI films.
SH (left) and TH (right) spectra at various input pulse energies from AZO films. All curves are reported at zero delay from the FROG traces. SH plots start at energies as low as 850 nJ, while TH plots start at 100 nJ.

References

    1. Fortunato E, et al. Transparent conducting oxides for photovoltaics. MRS Bull. 2007;32:242–247. doi: 10.1557/mrs2007.29. - DOI
    1. Kinsey N, et al. Near-zero-index materials for photonics. Nat. Rev. Mater. 2019;4:742–760. doi: 10.1038/s41578-019-0133-0. - DOI
    1. Reshef O, et al. Nonlinear optical effects in epsilon-near-zero media. Nat. Rev. Mater. 2019;4:535–551. doi: 10.1038/s41578-019-0120-5. - DOI
    1. Khurgin JB, et al. Adiabatic frequency shifting in epsilon-near-zero materials: the role of group velocity. Optica. 2020;7:226–231. doi: 10.1364/OPTICA.374788. - DOI
    1. Secondo R, Khurgin J, Kinsey N. Absorptive loss and band non-parabolicity as a physical origin of large nonlinearity in epsilon-near-zero materials. Opt. Mater. Express. 2020;10:1545–1560. doi: 10.1364/OME.394111. - DOI