. 2022 Sep;16(9):2169-2180.
doi: 10.1038/s41396-022-01259-y. Epub 2022 Jun 20.

Cyanophages from a less virulent clade dominate over their sister clade in global oceans

Affiliations

Cyanophages from a less virulent clade dominate over their sister clade in global oceans

Ilia Maidanik et al. ISME J. 2022 Sep.

Abstract

Environmental virus communities are highly diverse. However, the infection physiology underlying the evolution of diverse phage lineages and their ecological consequences are largely unknown. T7-like cyanophages are abundant in nature and infect the marine unicellular cyanobacteria, Synechococcus and Prochlorococcus, important primary producers in the oceans. Viruses belonging to this genus are divided into two distinct phylogenetic clades: clade A and clade B. These viruses have narrow host-ranges with clade A phages primarily infecting Synechococcus genotypes, while clade B phages are more diverse and can infect either Synechococcus or Prochlorococcus genotypes. Here we investigated infection properties (life history traits) and environmental abundances of these two clades of T7-like cyanophages. We show that clade A cyanophages have more rapid infection dynamics, larger burst sizes and greater virulence than clade B cyanophages. However, clade B cyanophages were at least 10-fold more abundant in all seasons, and infected more cyanobacteria, than clade A cyanophages in the Red Sea. Models predicted that steady-state cyanophage abundances, infection frequency, and virus-induced mortality, peak at intermediate virulence values. Our findings indicate that differences in infection properties are reflected in virus phylogeny at the clade level. They further indicate that infection properties, together with differences in subclade diversity and host repertoire, have important ecological consequences with the less aggressive, more diverse virus clade having greater ecological impacts.


Conflict of interest statement

The authors declare no competing interests.

Figures

Fig. 1
Fig. 1. Comparison of the infection physiology between pairs of clade A and clade B T7-like cyanophage infecting the same Synechococcus host.
ac Cyanophage growth curves, df burst sizes, gi virulence as the percentage of lysed host cells, jl decay as loss of infectivity, mo plaque sizes. a, d, g, j, m Clade A Syn5 phage and clade B S-TIP37 phage infecting WH8109. b, e, h, k, n Clade A S-CBP42 phage and clade B S-RIP2 phage infecting WH7803. c, f, i, l, o Clade A S-TIP28 phage and clade B S-TIP67 phage infecting CC9605. The host strain is shown at the right of the panels. Red and blue lines or bars show results for clade A and clade B phages, respectively. ac, gI Error bars indicate standard deviations. df Burst size results are for single cells. jl The solid line shows the fitted multi-level linear model. mo The time after infection at which plaques were photographed appears above the images. *p value < 0.05; **p value < 0.01; ***p value < 0.001; n.s. p > 0.05. Means, variances, number of replicates and p values are shown in Tables 1 and S3.
Fig. 2
Fig. 2. The annual dynamics of water column density and nutrients at Station A in the Gulf of Aqaba, Red Sea.
a σ density anomaly (b) Total oxidized nitrogen, NO2 + NO3 (TON), c phosphate (PO4). The contours are interpolations performed using DIVA gridding. All plots were created by Ocean Data View (http://odv.awi.de/). The data from 4 April 2013 were published previously [37] and are shown here for complete presentation of the annual cycle.
Fig. 3
Fig. 3. The annual dynamics of phytoplankton at Station A in the Gulf of Aqaba, Red Sea.
a Extracted chlorophyll a concentrations, b Synechococcus abundances, c Prochlorococcus abundances. Black points indicate samples. The contours are interpolations performed using DIVA gridding. All plots were created by Ocean Data View (http://odv.awi.de/). The data from 4 April 2013 were published previously [37] and are shown here for complete presentation of the annual cycle.
Fig. 4
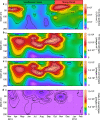
Fig. 4. The annual dynamics of viruses at Station A in the Gulf of Aqaba, Red Sea.
a Virus-like particle abundances, b total T7-like cyanophage abundances, c clade B T7-like cyanophage abundances, d clade A T7-like cyanophage abundances. Black points indicate samples. The contours are interpolations performed using DIVA gridding. All plots were created by Ocean Data View (http://odv.awi.de/). See SI Appendix, Fig. S3 for individual depth profiles of T7-like cyanophages. The data from 4 April 2013 in (bd) were published previously [37] and are shown here for complete presentation of the annual cycle.
Fig. 5
Fig. 5. Proportion of cyanobacterial populations infected by T7-like cyanophages at Station A in the Gulf of Aqaba, Red Sea.
a Synechococcus infection (n = 18), and b Prochlorococcus infection (n = 24), by clade A (red) and clade B (blue) T7-like cyanophages from samples collected in March and September 2014. **p value < 0.01; ***p value < 0.001.
Fig. 6
Fig. 6. Modeling host and virus population abundances based on infection properties of T7-like cyanophages.
Schematic representation of model results of host and virus population sizes at steady-state where clade A and clade B cyanophages infect distinct cyanobacterial genotypes (a) or the same cyanobacterial genotype (b). Icon areas are approximations of the relative abundance of host and virus populations at steady-state. The change in steady-state abundances of cyanobacterial hosts (c) and cyanophages (d) as a function of virulence for a clade A (red) and a clade B (blue) cyanophages infecting distinct cyanobacterial genotypes. d Cases for clade A and clade B phages are shown when the virulence of the other phage clade (clade B and clade A phages, respectively) were fixed at the averages determined empirically. Open red and blue circles indicate modeled abundances at average virulence values measured in this study for clade A and clade B cyanophages, respectively. e Abundance ratios of clade B to clade A cyanophages at steady-state for a range of virulence values in which clade A virulence is greater than clade B virulence. Red closed circle indicates modeled abundance ratio of clade B to clade A cyanophages (2.1) at average virulence values for both clades. The lowest virulence value at which clade B cyanophages persist in the presence of the more virulent clade A cyanophage (0.06) is shown by the dashed horizontal line. See SI Appendix, Table S4 for values of all model parameters, including average virulence for T7-like clade A and clade B cyanophages.
Fig. 7
Fig. 7. Effect of virulence and burst size on steady-state abundances of cyanobacteria and cyanophages.
a T7-like cyanophage abundances, b host abundances, c infected host abundances, d mortality rate of hosts, at mean infection physiology levels measured in this study (left most bar in each panel) and as a result of changes in cyanophage burst size and virulence, when infected by clade A or clade B cyanophages. Burst size or virulence values were reduced or increased 2-fold or 3-fold relative to the mean for each clade separately while holding the other variable at the average value for this clade of cyanophages. Values of these variables were held constant at the average for the other phage clade. Latent period was not assessed as this parameter does not influence steady-state abundances of either host or phage in this model (see Eqs. 7, 9, 10 and 12 in Methods). See SI Appendix, Table S4 for values of all model parameters.

References

    1. Fuhrman JA. Marine viruses and their biogeochemical and ecological effects. Nature. 1999;399:541–8. doi: 10.1038/21119. - DOI - PubMed
    1. Weinbauer MG, Rassoulzadegan F. Are viruses driving microbial diversification and diversity? Environ Microbiol. 2004;6:1–11. doi: 10.1046/j.1462-2920.2003.00539.x. - DOI - PubMed
    1. Breitbart M. Marine viruses: truth or dare. Ann Rev Mar Sci. 2012;4:425–48. doi: 10.1146/annurev-marine-120709-142805. - DOI - PubMed
    1. Aiewsakun P, Adriaenssens EM, Lavigne R, Kropinski AM, Simmonds P. Evaluation of the genomic diversity of viruses infecting bacteria, archaea and eukaryotes using a common bioinformatic platform: Steps towards a unified taxonomy. J Gen Virol. 2018;99:1331–43. doi: 10.1099/jgv.0.001110. - DOI - PMC - PubMed
    1. Dion MB, Oechslin F, Moineau S. Phage diversity, genomics and phylogeny. Nat Rev Microbiol. 2020;18:125–38. doi: 10.1038/s41579-019-0311-5. - DOI - PubMed

Publication types