. 2022 Jun;4(6):724-738.
doi: 10.1038/s42255-022-00583-z. Epub 2022 Jun 20.

Adaptive stimulation of macropinocytosis overcomes aspartate limitation in cancer cells under hypoxia

Affiliations

Adaptive stimulation of macropinocytosis overcomes aspartate limitation in cancer cells under hypoxia

Javier Garcia-Bermudez et al. Nat Metab. 2022 Jun.

Abstract

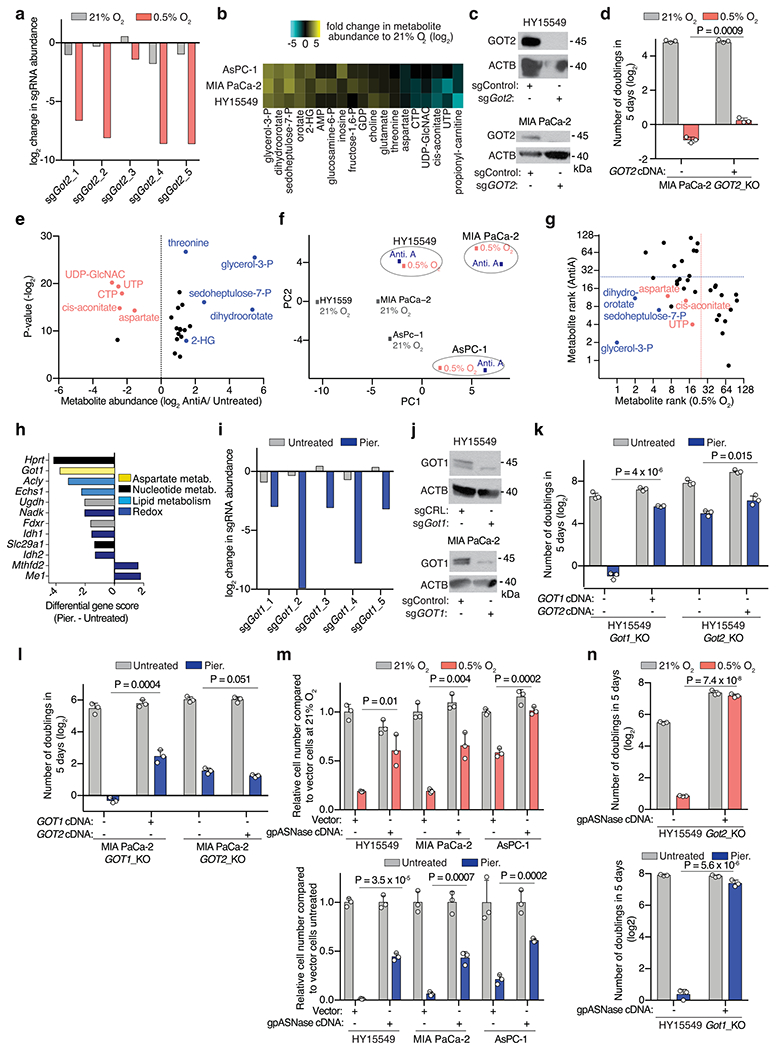
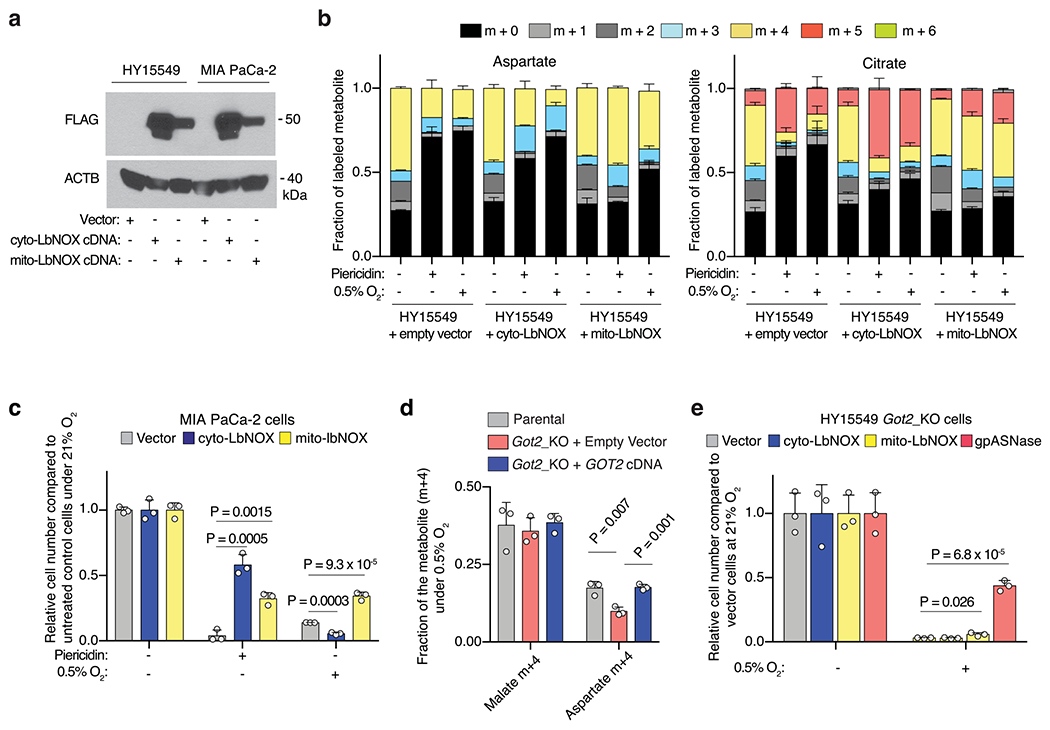
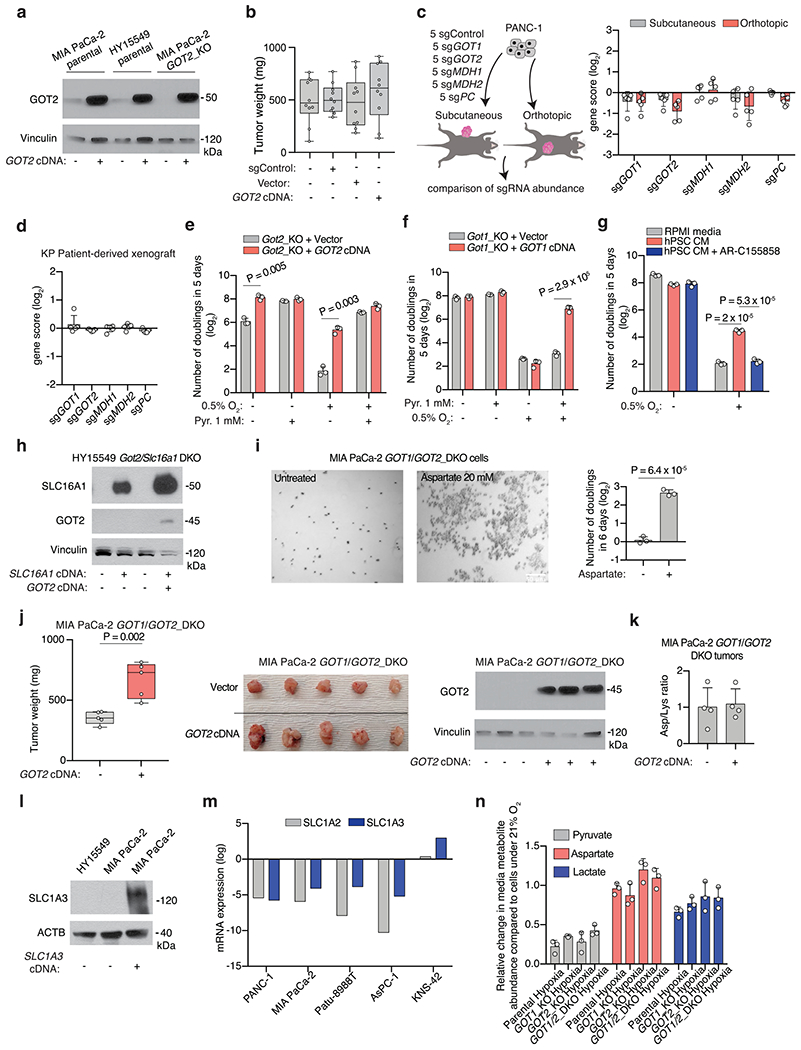
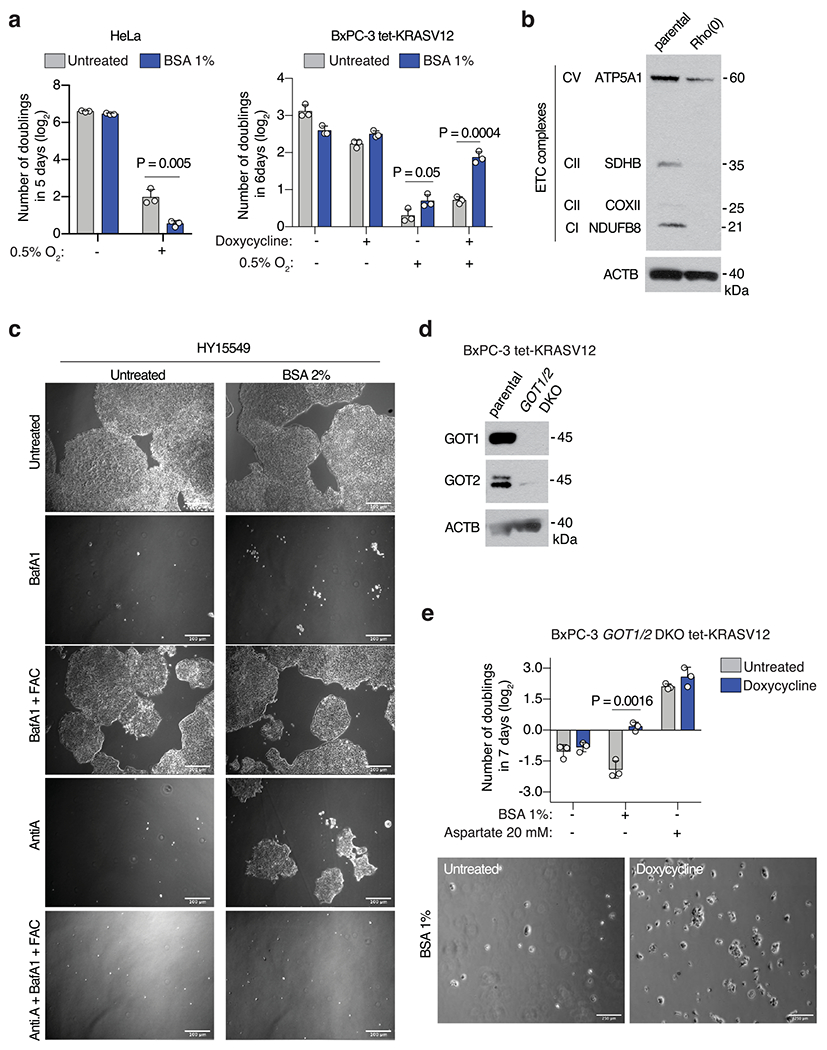
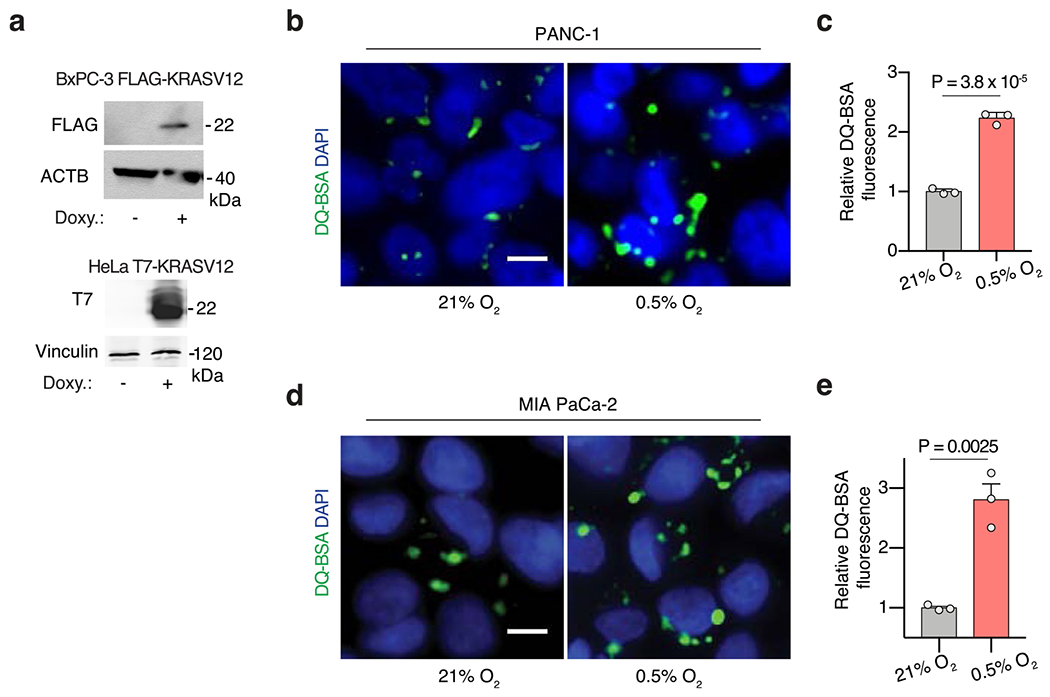
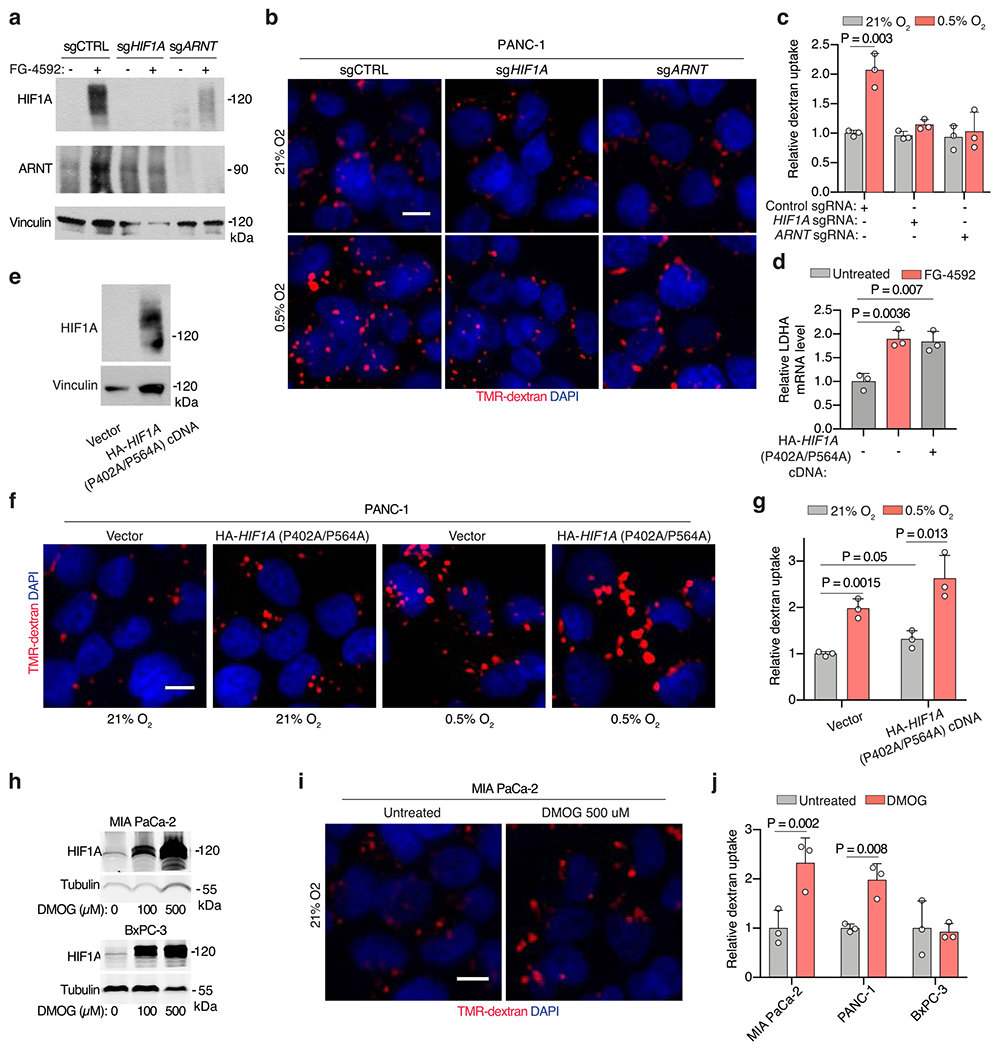
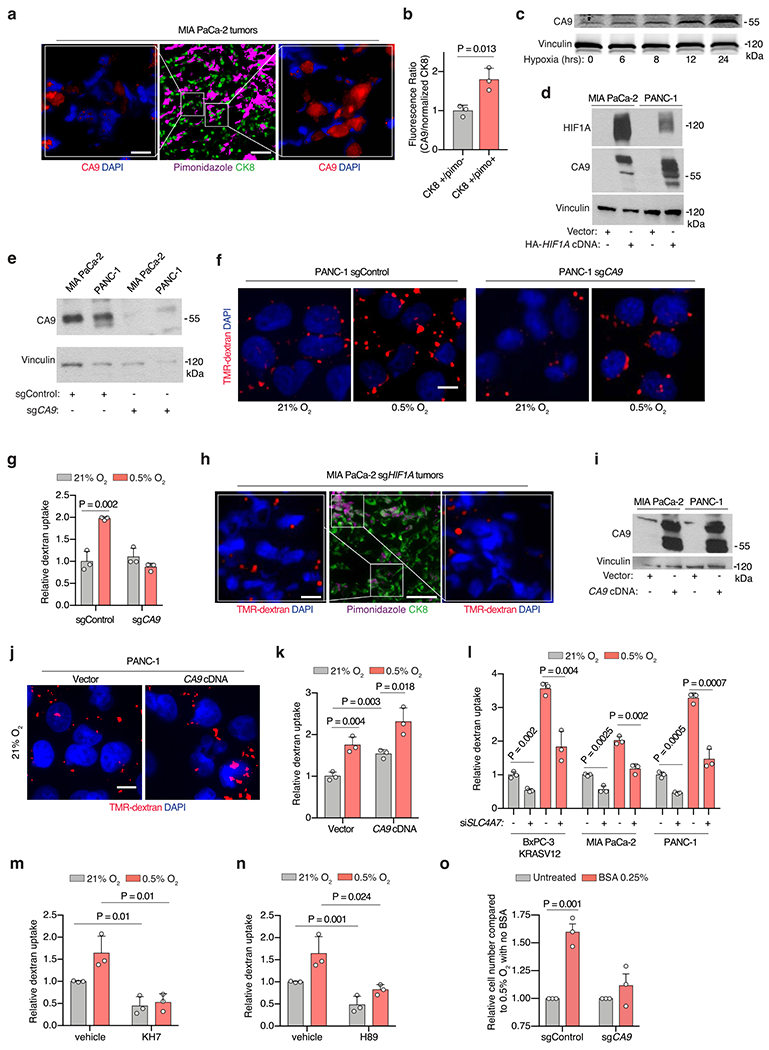
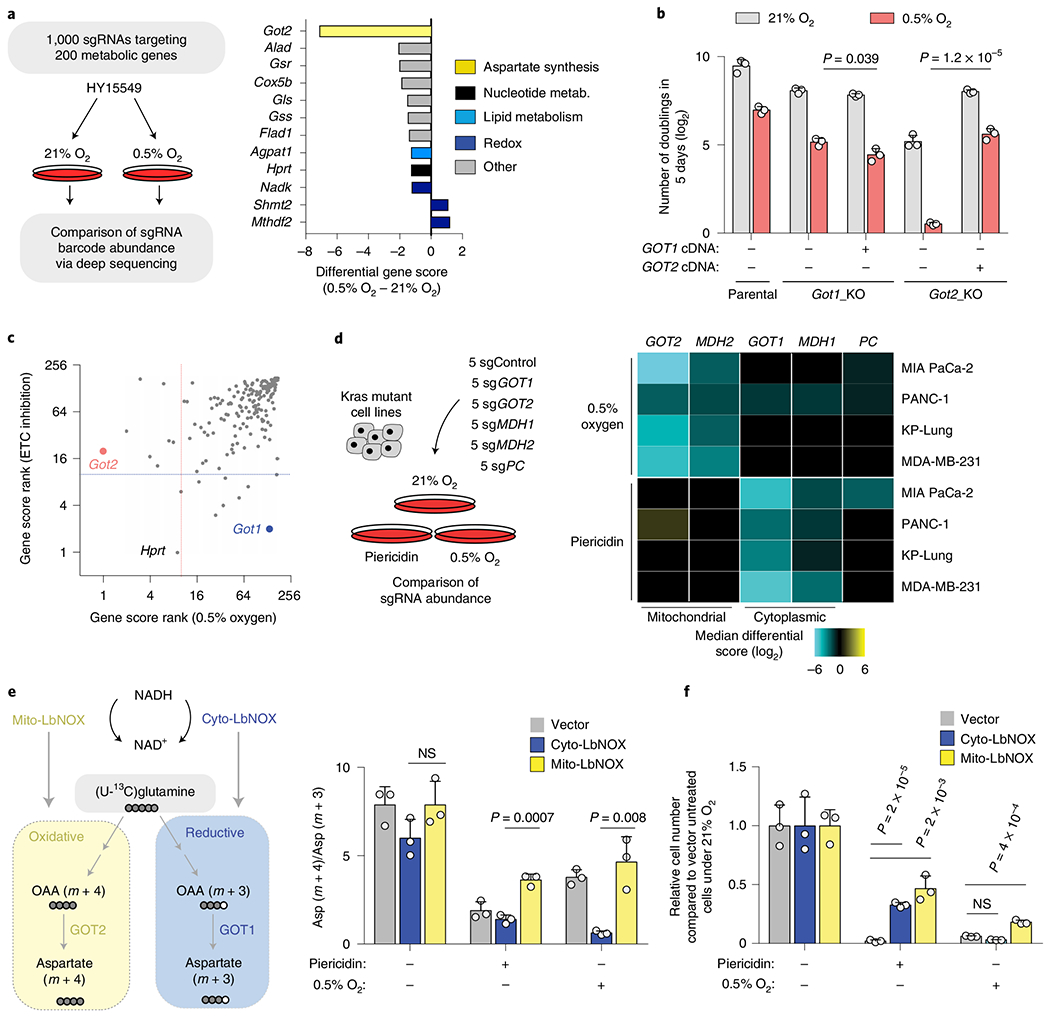
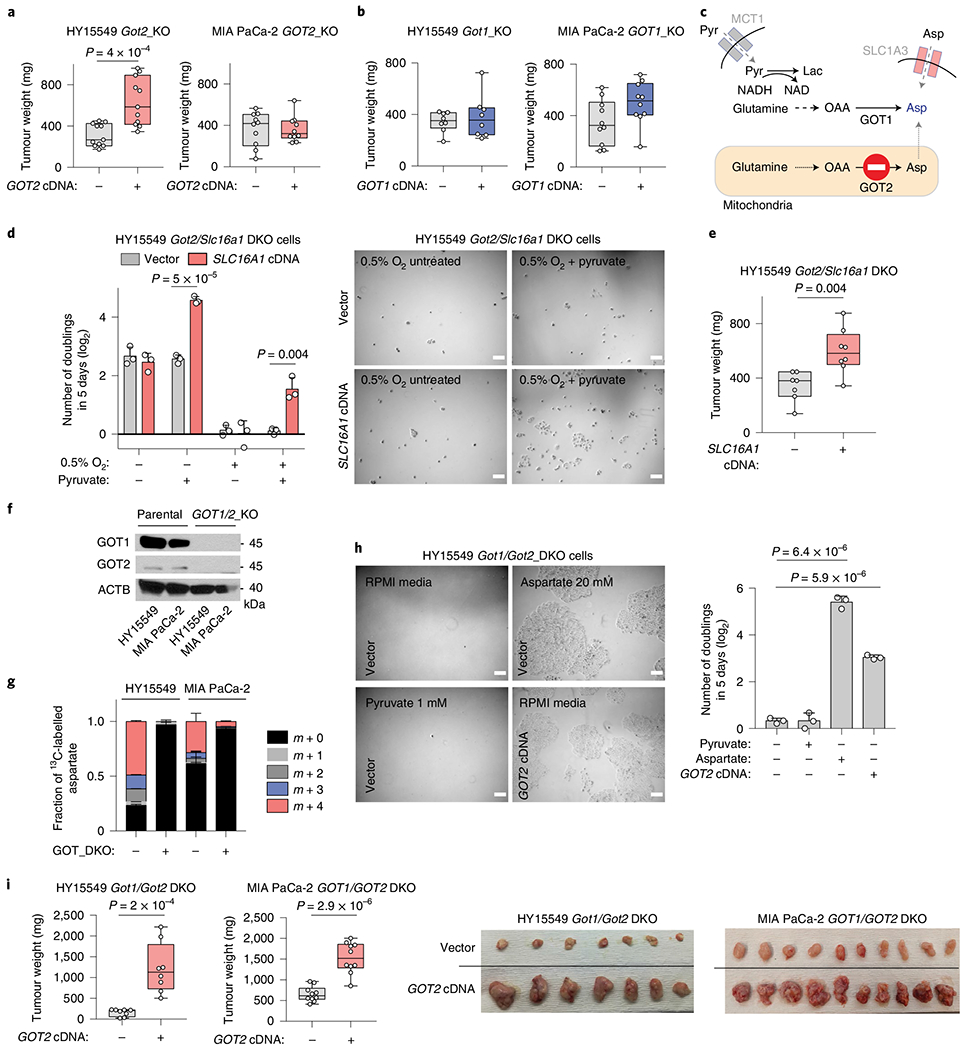
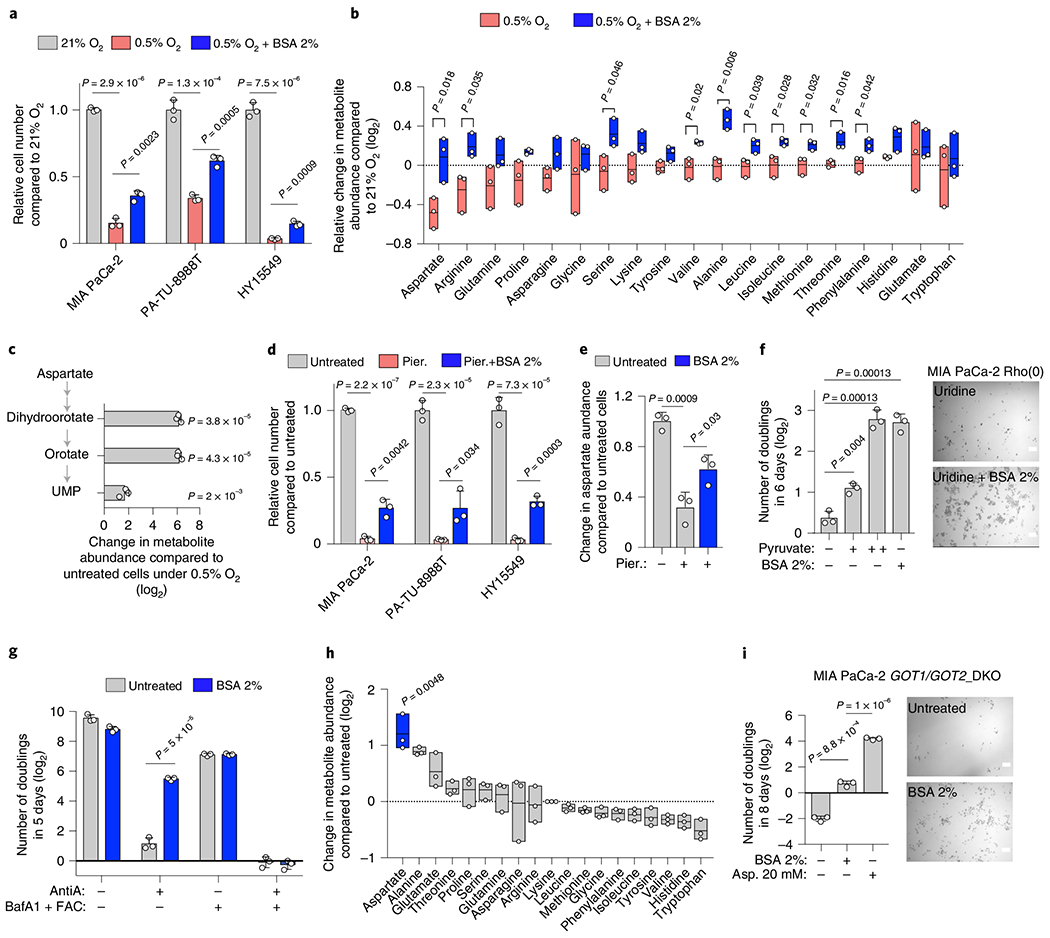
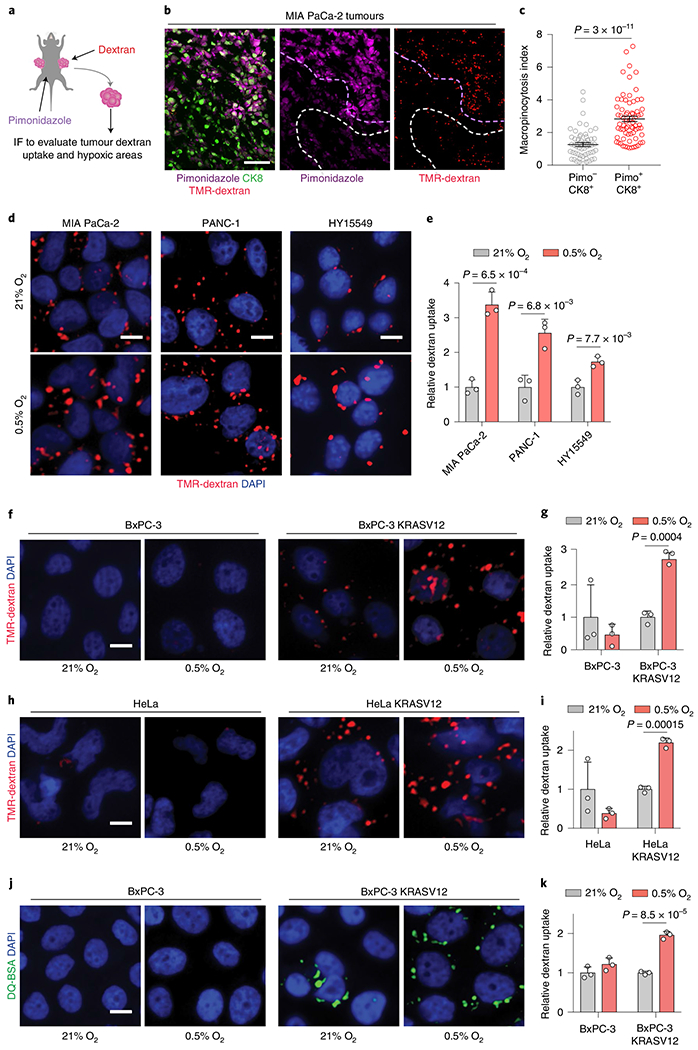
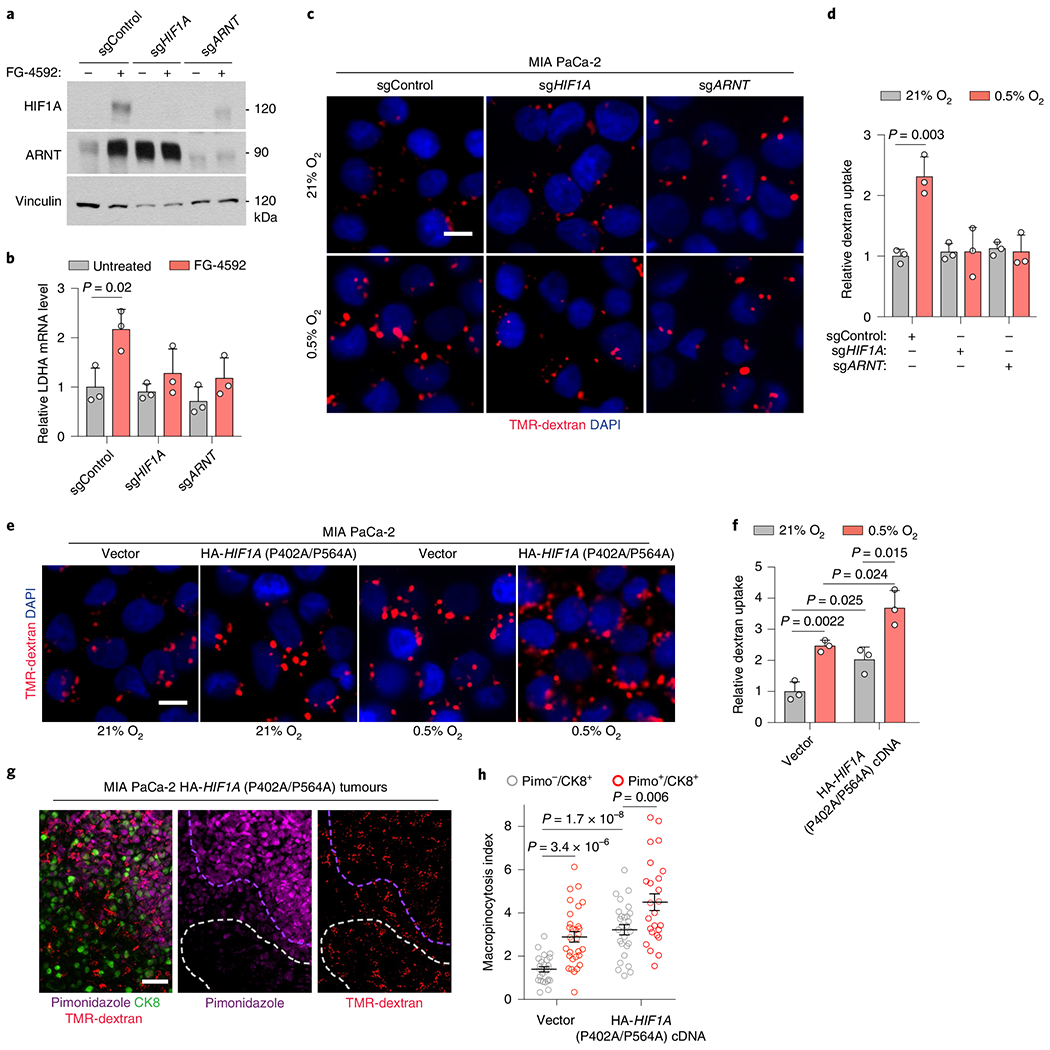
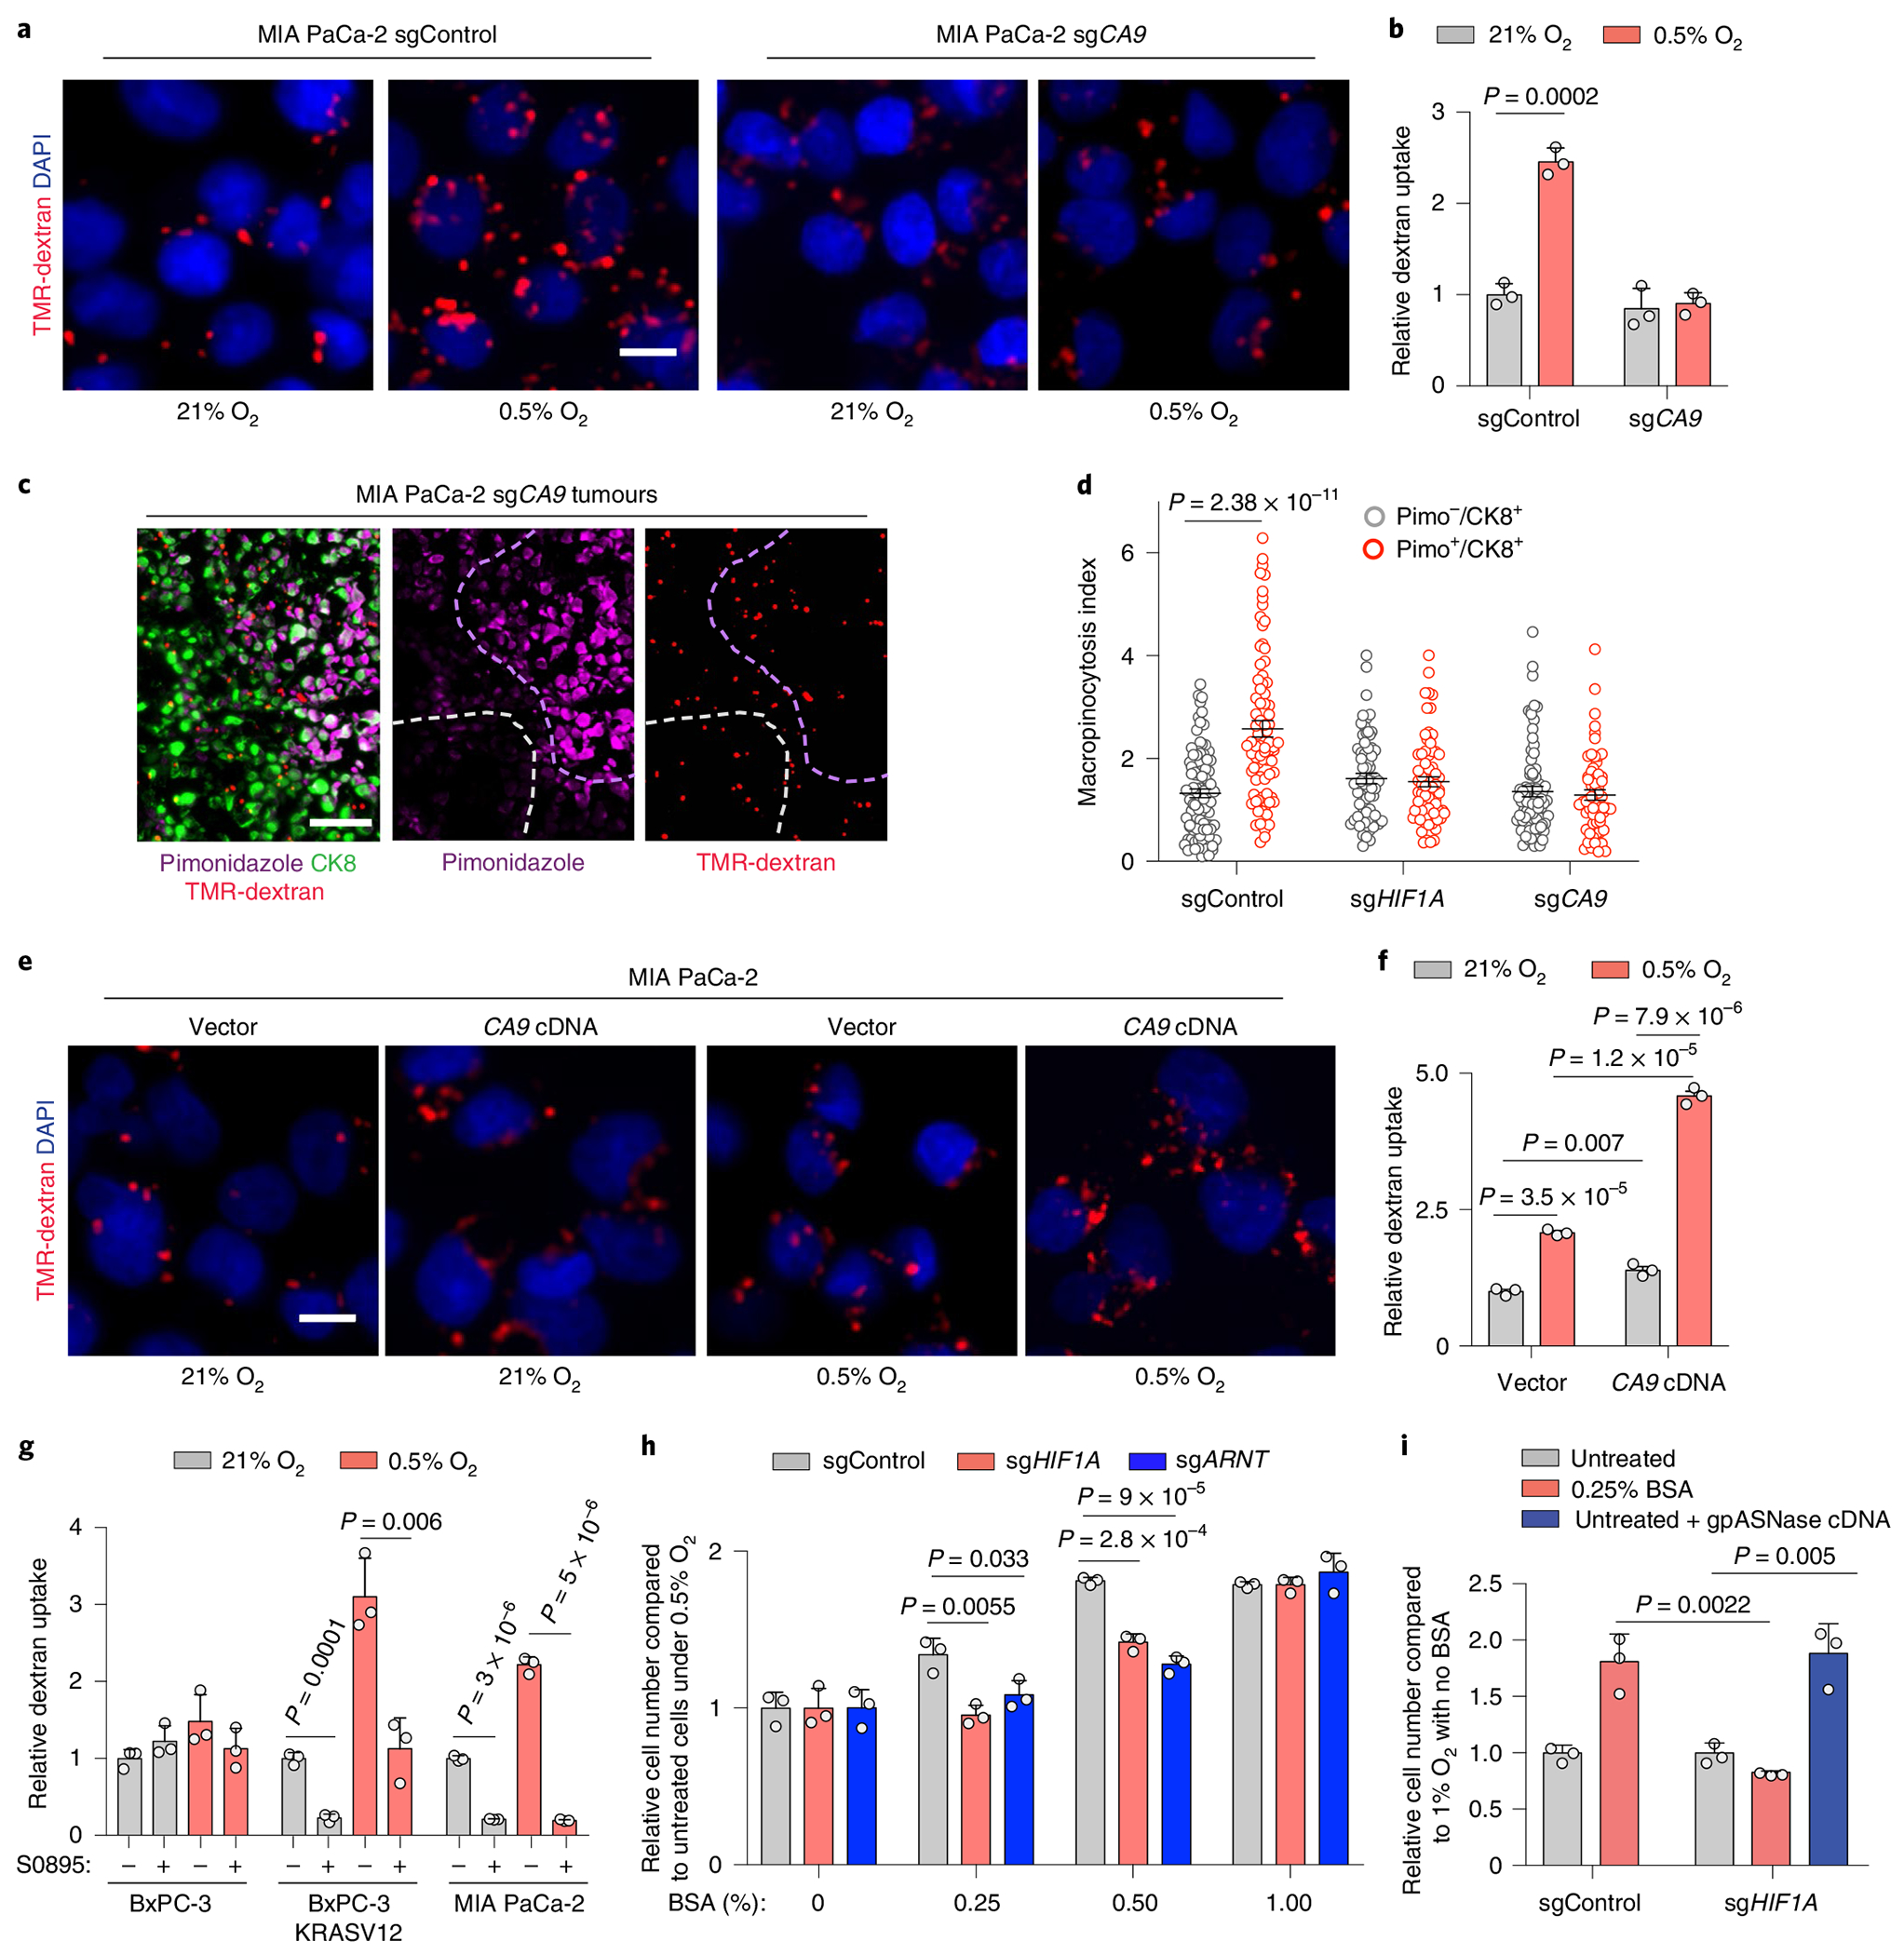
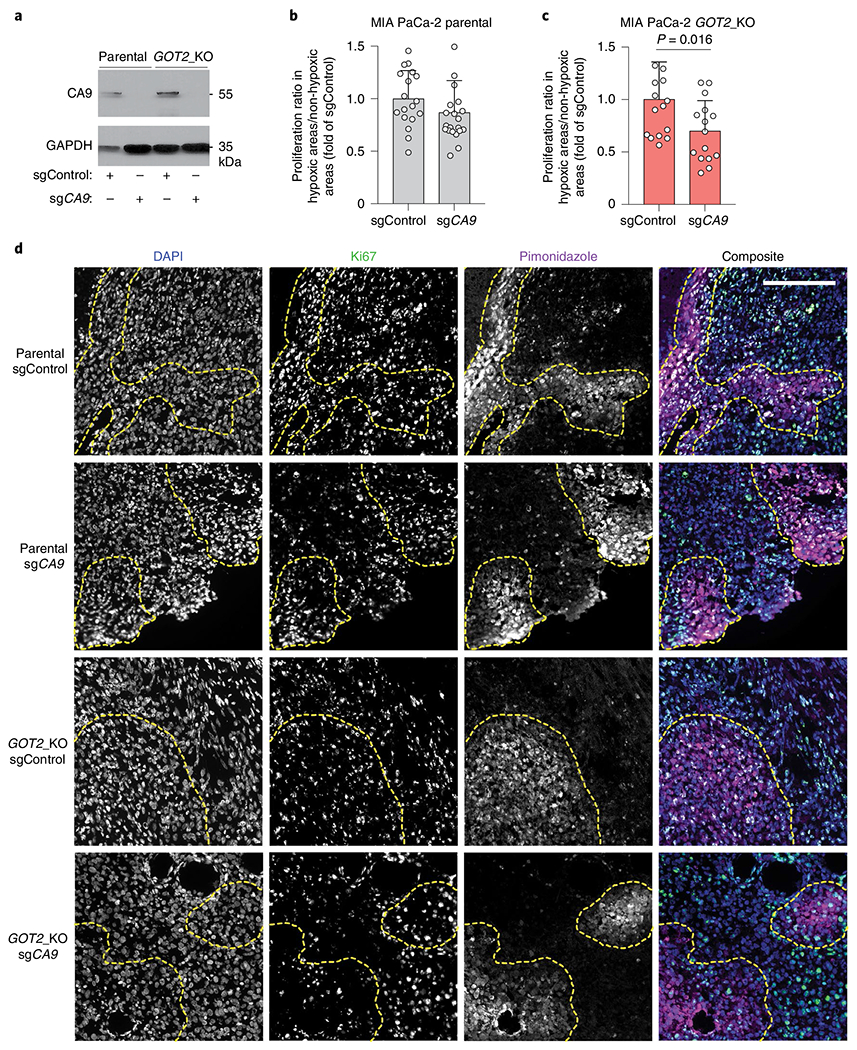
Stress-adaptive mechanisms enable tumour cells to overcome metabolic constraints under nutrient and oxygen shortage. Aspartate is an endogenous metabolic limitation under hypoxic conditions, but the nature of the adaptive mechanisms that contribute to aspartate availability and hypoxic tumour growth are poorly understood. Here we identify GOT2-catalysed mitochondrial aspartate synthesis as an essential metabolic dependency for the proliferation of pancreatic tumour cells under hypoxic culture conditions. In contrast, GOT2-catalysed aspartate synthesis is dispensable for pancreatic tumour formation in vivo. The dependence of pancreatic tumour cells on aspartate synthesis is bypassed in part by a hypoxia-induced potentiation of extracellular protein scavenging via macropinocytosis. This effect is mutant KRAS dependent, and is mediated by hypoxia-inducible factor 1 (HIF1A) and its canonical target carbonic anhydrase-9 (CA9). Our findings reveal high plasticity of aspartate metabolism and define an adaptive regulatory role for macropinocytosis by which mutant KRAS tumours can overcome nutrient deprivation under hypoxic conditions.


Conflict of interest statement

Competing interests

K.B. is scientific adviser to Nanocare Pharmaceuticals and a consultant to Barer Institute. The remaining authors declare no competing interests.

Figures

Extended Data Fig. 1 |
Extended Data Fig. 1 |. Hypoxia and ETC inhibition trigger similar metabolic signatures in PDAC cells.
(a) Individual sgRNA scores for GOT2 under indicated conditions. (b) Heat map showing fold changes (log2) of polar metabolites significantly changed when comparing normoxic to hypoxic culture conditions. (c) Immunoblot analysis of GOT2. ACTB is a loading control. (d) Fold change in cell number (log2) of MIA PaCa-2 GOT2KO cell line expressing indicated constructs grown under indicated conditions for 5 days. (e) Common metabolite changes across three PDAC cell lines upon ETC inhibition. (f) Principal component analysis (PCA) of metabolic changes in indicated PDAC cell lines under indicated conditions. (g) Ranks of metabolites most significantly changed (p value < 0.01, dotted lines) across 3 PDAC cell lines under indicated conditions. Metabolites significantly accumulated (blue) or depleted (pink) under both conditions are in the lower left quadrant (right). (h) Top scoring genes and their differential gene scores in HY15549 cells treated with piericidin (Pier.) compared to untreated cells. (i) Individual sgRNA scores for GOT1 in HY15549 cells in indicated conditions. (j) Immunoblot analysis of GOT1 in indicated cell lines expressing indicated sgRNAs. ACTB is a loading control. (k) Fold change in cell number (log2) of indicated HY15549 cell lines expressing indicated constructs for 5 days in the presence or absence of Pier., 20 nM. (l) Fold change in cell number (log2) of indicated cell lines expressing indicated cDNAs grown for 5 days in the presence or absence of Pier., 20 nM. (m) Relative fold change in cell number of indicated parental PDAC cell lines transduced with indicated cDNAs grown for 5 days under indicated conditions; Pier., 20-100. (n) Fold change in cell number (log2) of indicated HY15549 cell lines transduced with indicated vectors grown for 5 days under indicated conditions; Pier. 50 nM. a, i, bars represent individual sgRNA scores; d, k, l, m, n, Bars represent mean ± s.d. d, k, l, m, n, n = 3 biologically independent samples. Statistical significance was determined by two-tailed unpaired t-test.
Extended Data Fig. 2 |
Extended Data Fig. 2 |. Mitochondrial NAD+ is limiting for PDAC cell proliferation under hypoxia.
(a) Immunoblot analysis of FLAG-tagged cytoplasmic (cyto-) and mitochondrial (mito-) LbNOX heterologous expression in the indicated cell lines. ACTB was used as a loading control. (b) Fraction of labelled aspartate (left) and citrate (right) derived from labelled glutamine in control and cyto- or mito-LbNOX expressing HY15549 cells cultured for 8 h with [U-13C]-Glutamine (500 μM) with piericidin treatment (50 nM) or under 0.5% oxygen. Colours indicate mass isotopomers. (c) Expression of LbNOX enzymes rescues proliferation of MIA PaCa-2 cells under piericidin treatment (50 nM), whereas only mito-LbNOX expression rescues proliferation under 0.5% O2. Data is shown as fold change in cell number in the indicated cell lines grown for 5 days relative to untreated cells cultured at 21% O2. (d) Fraction of 13C-labeled aspartate (m + 4) and malate (m + 4) in HY15549 parental and GOT2-knockout cells transduced with a control vector or an sgRNA-resistant GOT2 cDNA cultured for 24 hours under hypoxia in the presence of [U-13C]-L-glutamine (1 mM). (e) Relative fold change in cell number of HY15549 GOT2-knockout cells transduced with a control vector or the indicated cDNAs grown for 5 days under hypoxia (0.5% O2) to those cultured under normoxia (21% O2). b-e, Bars represent mean ± s.d. b-e, n = 3 biologically independent samples. Statistical significance was determined by two-tailed unpaired t-test.
Extended Data Fig. 3 |
Extended Data Fig. 3 |. Aspartate synthesis by GOTs is essential in culture but redundant for in vivo tumor growth.
(a) Immunoblot analysis of indicated proteins and cell lines with vinculin loading control. (b) Weights of subcutaneous tumor xenografts from MIA PaCa-2 cells transduced with indicated vectors. (c) In vivo sgRNA competition assay scheme (left). Gene scores for indicated conditions (right). Each dot represents one sgRNA (n = 5 tumours). (d) Gene scores for in vivo sgRNA competition assay performed in KRAS-mutant PDAC patient-derived xenografts (PDX). Each dot represents an sgRNA (n = 5 subcutaneous tumors). (e, f) Fold change cell number of GOT2-KO HY15549 cells transduced with indicated vectors grown 5 days under indicated conditions. Pyruvate (Pyr). (g) Fold change in cell number of HY15549 cells grown 5 days in regular or conditioned media from hPSCs (hPSC CM) with or without monocarboxylate transporter inhibitor AR-C155858 (5 μM). (h) Immunoblot analysis of indicated cells under indicated conditions with vinculin as loading control. (i). Representative bright-field micrographs of indicated cells grown 6 days in the indicated media. Scale bar = 50 μM (left). Quantification graph (right); aspartate (20 mM). (j) Weights, images, and immunoblot analysis of indicated tumors with vinculin loading control (right). (k) Relative aspartate abundance normalized to lysine levels of established xenografts from indicated cells transduced with indicated vectors. (l) Immunoblot of SLC1A3 in indicated cell lines with b-actin loading control. (m) SLC1A2 and SLC1A3 mRNA expression data from the Cancer Cell Line Encyclopedia (CCLE) (log transformed) in KP PDAC cell lines and a glioma cell line (KNS-42). (n) Relative abundance of indicated metabolites in the culture media of indicated MIA PaCa-2 cells grown under indicated conditions for 24 hours in the presence of pyruvate (100 μM). c, d, e, f, g, i, k, n Bars represent mean ± s.d. b, j, boxes represent the median, first, and third quartiles; whiskers represent the minima and maxima. c, d, e, f, g, i, k, n, n = 3; b, n = 10; j, n = 5; k, n = 4. All replicates are biologically independent. Statistical significance determined by two-tailed unpaired t-test.
Extended Data Fig. 4 |
Extended Data Fig. 4 |. Macropinocytosis enables proliferation of KRAS-mutant cells under conditions where aspartate is limited.
(a) Fold change in cell number (log2) of HeLa (left) or BxPC-3 tet-KRASV12 (right) cells cultured under indicated concentrations of oxygen for 5-6 days in the presence or absence of 1% BSA. BxPC-3 tet-KRASV12 cells were cultured in the presence or absence of doxycycline (0.1μ/mL) to activate KRASV12 expression. (b) Immunoblot analysis of several members of the ETC complex in parental MIA PaCa-2 cells or Rho(0) counterparts. ACTB was used as a loading control. (c) Representative bright-field micrographs of HY15549 cells cultured for 5 days in media with or without 2% BSA. Where indicated, cells were treated with bafilomycin A1 (BafA1, 10 nM), ferric ammonium citrate (FAC, 0.1 μg/mL) and complex III inhibitor antimycin A (Anti. A, 100 nM). Scale bar = 50 μm. (d) Immunoblot analysis of GOT1 and GOT2 in GOT1/2- double knockout BxPC-3 tet-KRASV12 cells compared to parental controls. ACTB was used as a loading control. (e) Fold change in cell number (log2) of GOT1/2- double knockout BxPC-3 tet-KRASV12 cells cultured in the indicated media conditions for 7 days in the presence or absence of doxycycline (0.1 μg/mL) (top). Representative bright-field micrographs of GOT1/2- double knockout BxPC-3 tet-KRASV12 cells in media supplemented with 1% BSA in the presence and absence of doxycycline (0.1 μg/mL) (bottom). a, e, Bars represent mean ± s.d. a, e, n = 3 biologically independent samples. Statistical significance was determined by two-tailed unpaired t-test.
Extended Data Fig. 5 |
Extended Data Fig. 5 |. Hypoxia-induced macropinocytosis depends on oncogenic KRAS in PDACs.
(a) Immunoblot analysis of FLAG and T7, showing inducible expression of stably transduced FLAG-tagged KRASG12V BxPC-3 cells and T7-tagged KRASG12V HeLa cells after addition of doxycycline (1 μg/mL for 2 days). ACTB or vinculin were used as a loading control. (b-e) Representative images (b, d) and quantification (c, e) of DQ-BSA fluorescence (green) in PANC-1 (b, c) and MIA PaCa-2 (d, e) cells under normoxia (21% O2) and hypoxia (0.5% O2). Nuclei are labeled with DAPI (blue). Scale bar, 10 μm. In c, e, data are presented relative to normoxia. c, e, Bars represent mean ± s.e.m. At least 500 (c, d) cells were quantified in each biological replicate (n = 3). Statistical significance was determined by two-tailed unpaired t-test.
Extended Data Fig. 6 |
Extended Data Fig. 6 |. HIF1A stabilization stimulates macropinocytosis in PDAC cells and tumors.
(a) Immunoblot analysis indicated proteins in the indicated sgRNA-transduced PANC-1 cells treated with FG-4592 as shown. Vinculin is a loading control. (b, c) Representative images (b) and quantification (c) of TMR-dextran (red) uptake in control or sgHIF1A- or sgARNT-transduced PANC-1 cells cultured under indicated conditions. Nuclei are blue. Scale bar, 10 μm. In c, data are values normalized to control normoxic cells. (d) Relative mRNA levels of the HIF1A-target lactate dehydrogenase A (LDHA) in the indicated MIA PaCa-2 cell lines expressing the indicated vectors and treated with the prolyl-hydroxylase (PHD)-inhibitor FG-4592 (100 μM, 72 hrs) as shown. (e, f) Representative images (e) and quantification (f) of TMR-dextran (red) uptake in PANC-1 cells expressing indicated constructs cultured under indicated conditions. Nuclei are blue. Scale bar, 10 μm. In f, data are normalized to values for control normoxic cells. (g) Immunoblot analysis of HIF1A in MIA PaCa-2 and BxPC-3 cells treated with 0, 100, and 500 μM of the prolyl-hydroxylase inhibitor DMOG under normoxia (21% O2). Tubulin was used as a loading control. (h) Representative images of TMR-dextran (red) uptake in MIA PaCa-2 cells in the absence or presence of DMOG (500 μM) under normoxia (21% O2). Nuclei are labeled with DAPI (blue). Scale bar, 10 μm. (i) Quantification of macropinocytic uptake in MIA PaCa-2, PANC-1 and BxPC-3 cells treated in the absence or presence of DMOG (500 μM) under normoxia (21% O2). Data are presented relative to values obtained for untreated cells. (j) Representative images of TMR-dextran (red) uptake from sections of xenograft tumors arising from MIA PaCa-2 cells transduced with sgRNAs targeting HIF1A or ARNT with tumor cells immunostained with anti-CK8 (green), and pimonidazole detected with anti-pimonidazole (purple). Nuclei are labeled with DAPI (blue). Scale bar = 50 μm, inset = 10 μm c, d, f, i, Bars represent mean ± s.e.m. d, n = 3 independent, biological replicates. At least 500 (c, f, i) cells were quantified in each biological replicate (n = 3). Statistical significance for all experiments was determined by two-tailed unpaired t-test.
Extended Data Fig. 7 |
Extended Data Fig. 7 |. Bicarbonate generation by CA9 mediates the effect of HIF1A on PDAC macropinocytosis under hypoxia.
(a) Representative images of CA9 (red) from sections of indicated tumor xenografts with +CK8 tumor cells (green), and hypoxic areas (purple). Nuclei are blue. Scale bar = 10 uM. (b) Immunofluorescence of CA9 relative to CK8 in sections of MIA PaCa-2 xenograft tumors. Data are normalized to values from CK8 +/pimo-areas. (c) Immunoblot analysis of CA9 in MIA PaCa-2 cells grown under hypoxia (0.5% O2) for the indicated times (hours). (d) Immunoblot analysis of indicated proteins in the indicated cell lines expressing indicated constructs. (e) Immunoblot analysis of CA9 in the indicated cell lines transduced with the indicated sgRNAs. (f, g) Representative images (f) and quantification (g) of TMR-dextran (red) uptake in PANC-1 cells transduced with indicated constructs and cultured under the indicated conditions. Nuclei are blue. Scale bar, 10 μm. In g, data are normalized to values from normoxic control cells. (h) Immunoblot analysis of CA9 in indicated cells transduced with indicated vectors. (i) Representative images of TMR-dextran (red) uptake in indicated PANC-1 cells cultured under indicated conditions. Nuclei are blue. Scale bar = 10uM. (j) Quantification of TMR-dextran uptake in indicated PANC-1 cells under indicated conditions. Data are normalized to values from control cells. (k) Quantification of TMR-dextran uptake in the indicated cell lines transfected with indicated constructs and cultured under indicated conditions. Data are normalized to values from control normoxic cells. (l) Quantification of TMR-dextran uptake in MIA PaCa-2 cells treated with soluble adenylate cyclase inhibitor KH7 under indicated conditions. Data normalized to values obtained from control normoxic cells. (m) Quantification of TMR-dextran uptake in MIA PaCa-2 cells treated with the PKA inhibitor H89 (15 μM) as shown under indicated conditions. Data are normalized to values obtained for control normoxic cells. b, g, j, k, l, m, Bars represent mean ± s.e.m. At least 300 (b) and 500 (g, j, k, l, m) cells were quantified in each biological replicate (n = 3). Vinculin is a loading control in all immunoblots shown. Statistical significance was determined by two-tailed unpaired t-test.
Fig. 1 |
Fig. 1 |. The metabolic route for aspartate synthesis in hypoxic pancreatic cancer cells.
a, Scheme of the focused CRISPR–Cas9 based genetic screen in a Ras mutant mouse PDAC line (HY15549) grown under normoxic (21% O2) or hypoxic conditions (0.5% O2) for 14 population doublings (left). Top scoring genes and their differential gene scores in the focused CRISPR screen (right). b, Number of doublings (log2) of indicated parental, Got1 and Got2-knockout HY15549 cell lines expressing sgRNA-resistant GOT1 or GOT2 cDNA and grown for 5 days under normoxic (21% O2) or hypoxic conditions (0.5% O2). c, Plot of gene score ranks of hypoxia and ETC inhibitor CRISPR screens in HY15549 cells. d, Scheme of the in vitro sgRNA competition assay performed in KRAS-mutant cancer cell lines transduced with a pool of five control sgRNAs (sgControl) and sgRNAs targeting five enzymes involved in aspartate metabolism (GOT1, GOT2, MDH1, MDH2 and PC) (left). Heat map showing median differential gene scores in the indicated cell lines on low oxygen (0.5% O2) or treatment with piericidin, an ETC inhibitor (right). e, Scheme depicting the oxidative (yellow) and reductive (blue) routes from which aspartate can be synthesized from glutamine, and the activation of each pathway by mito- and cyto-LbNOX enzymes. Filled circles represent 13C atoms derived from [U-13C]-l-glutamine (left). Oxidative (m + 4) to reductive (m + 3) aspartate ratio in HY15549 cell lines grown under 21% O2, 0.5% O2 or in the presence of piericidin (50 nM) (right). f, Relative fold change in cell number in HY15549 cell lines transduced with a vector control, cyto-LbNOX or mito-LbNOX grown for 5 days under 0.5% O2 or in the presence of piericidin (50 nM). b,e,f, Bars represent mean±s.d.; b,d,e,f, n = 3 biologically independent samples. Statistical significance was determined by a two-tailed unpaired t-test. NS, not significant.
Fig. 2 |
Fig. 2 |. The plasticity of aspartate metabolism in PDAC tumours.
a,b, Weights of subcutaneous tumour xenografts derived from GOT2 (a) and GOT1-knockout (KO) (b) cell lines transduced with a control vector or an sgRNA-resistant cDNA. c, Scheme depicting metabolic pathways that compensate for the loss of aspartate synthesis in GOT2-knockout cells. d, Number of doublings (log2) of Got2/Slc16a1 double-knockout (DKO) HY15549 cells transduced with a control vector or an sgRNA-resistant SLC16A1 cDNA after 5 days of growth in the absence or presence of pyruvate (100 μM) (left). Representative bright-field micrographs of indicated cells under 0.5% O2 in the presence or absence of pyruvate (100 μM). Scale bar, 50 μm (right). e, Weights of subcutaneous tumour xenografts derived from the Got2/Slc16a1 double-knockout HY15549 cells transduced with a control vector or an sgRNA-resistant SLC6A1 cDNA. f, Immunoblot analysis of GOT1 and GOT2 in indicated cell lines. ACTB was used as loading control. g, Fraction of 13C-labelled aspartate in indicated cell lines cultured for 8 h in the presence of 0.5 mM [U-13C]-l-glutamine. h, Representative bright-field micrographs (left) and number of doublings (log2) (right) of Got1/Got2-double-knockout HY15549 cells transduced with a control vector or an sgRNA-resistant GOT2 cDNA grown for 5 days in indicated culture conditions. Scale bar, 50 μm (left). i, Weights of subcutaneous tumour xenografts derived from the indicated Got1/Got2 double-knockout cell lines transduced with a control vector or an sgRNA-resistant GOT2 cDNA (left). Representative images of indicated tumours (right). a,b,e,i, boxes represent the median, and the first and third quartiles, and the whiskers represent the minima and maxima of all data points. d,g,h, Bars represent mean± s.d. a,b,e,i, n = 11, 11, 10, 10, 8, 8, 10, 10, 7, 8, 8 and 8 biologically independent samples in each graph shown, respectively. d,g,h, n = 3 biologically independent samples. Statistical significance was determined by a two-tailed unpaired t-test.
Fig. 3 |
Fig. 3 |. Macropinocytosis provides sufficient aspartate to enable PDAC cell growth under hypoxic culture conditions.
a, Relative cell number of indicated cell lines grown under indicated conditions. b, Relative change (log2) in amino acid abundance in MIA PaCa-2 cells grown under indicated conditions. c, Relative change (log2) in the indicated metabolites in MIA PaCa-2 cells grown under 0.5% O2 with 2% BSA to those without. d, Relative cell number of indicated cell lines treated with piericidin (Pier.; MIA PaCa-2, PA-TU-8998T 100 nM; HY15549 30 nM) for 5 days in the presence or absence of 2% BSA. e, Relative aspartate abundance of MIA PaCa-2 cells treated with piericidin (150 nM) with or without 2% BSA compared to controls. Metabolite abundance is normalized by total protein levels. f, Number of doublings (log2) of MIA PaCa-2 Rho(0) cells grown for 6 days in media supplemented with uridine (50 μg ml−1) in the presence or absence of pyruvate (+, 100 μM; ++, 1 mM) or 2% BSA (left). Representative bright-field micrographs of MIA PaCa-2 Rho(0) cells for indicated conditions. Scale bar, 50 μm (right). g, Number of doublings (log2) of HY15549 cells grown for 5 days in the absence and presence of 2% BSA, antimycin A (AntiA., 100 nM) or Bafilomycin A1 (BafA1, 10 nM + ferric ammonium citrate (FAC) 0.1 μg ml−1). h, Relative change (log2) in amino acid abundance of GOT1/GOT2 double-knockout MIA PaCa-2 cells grown for 48 h with or without 2% BSA. Aspartate is highlighted in blue. i, Number of doublings (log2) of indicated cells grown for 8 days in regular RPMI media and media supplemented with 2% BSA or aspartate (20 mM) (left). Representative bright-field micrographs of GOT1/GOT2 double-knockout MIA PaCa-2 cells in the presence or absence of BSA 2%. Scale bar, 50 μm (right). a,cg,i, Bars represent mean±s.d.; b,h, boxes represent the median, and the first and third quartiles. ai, n = 3 biologically independent samples. Statistical significance determined by a two-tailed unpaired t-test.
Fig. 4 |
Fig. 4 |. Hypoxia upregulates macropinocytosis in mutant KRAS cells in vivo and in vitro.
a, Schematic of in vivo assay for administering intratumoral TMR-dextran and intraperitoneal pimonidazole injection to identify macropinosomes and hypoxic regions of tumours, respectively. IF, immunofluorescence. b, Hypoxic tumour areas display more macropinocytosis than neighbouring non-hypoxic areas. Representative images from sections of MIA PaCa-2 xenograft tumour tissue showing macropinosomes labelled with TMR-dextran (red), tumour cells immunostained with anti-CK8 (green) and pimonidazole detected with antipimonidazole (purple). Dashed lines indicate high (purple) and low (white) areas of pimonidazole staining. Scale bar, 50 μm. c, Quantification of macropinocytic uptake in b showing tumour macropinocytosis index in hypoxic tumour areas (CK8+/Pimo+, red) relative to non-hypoxic tumour areas (CK8+/Pimo, grey). d,e, Representative images (d) and quantification (e) of TMR-dextran (red) uptake in MIA PaCa-2, PANC-1 and HY15549 cells under normoxia (21% O2) and hypoxia (0.5% O2). Nuclei are labelled with DAPI (blue). Scale bar, 10 μm. In e, data are presented relative to normoxic controls for respective lines. fi, Hypoxia-induced macropinocytosis depends on oncogenic RAS. Representative images (f,h) and quantification (g,i) of TMR-dextran (red) uptake in BxPC-3 cells (f,g) and HeLa cells (h,i) without and with expression of doxycycline-inducible KRASG12V grown in normoxia (21% O2) or hypoxia (0.5% O2). Nuclei are labelled with DAPI (blue). Scale bar, 10 μm. In g,i, data are presented relative to normoxic controls for respective lines. j,k, Representative images (j) and quantification (k) of DQ-BSA fluorescence (green) in BxPC-3 cells without and with expression of doxycycline-inducible KRASG12V grown in normoxia (21% O2) or hypoxia (0.5% O2). Scale bar, 10 μm. In k, data are presented relative to normoxia of the respective cell line. c,e,g,i,k, Bars represent mean ± s.e.m. At least 300 (c) or 500 (e,g,i,k) cells were quantified in each biological replicate (n = 3). Statistical significance was determined by a two-tailed unpaired t-test.
Fig. 5 |
Fig. 5 |. HIF1A is necessary and sufficient for hypoxia-dependent upregulation of micropinocytosis.
a, Immunoblot analysis of indicated proteins in MIA PaCa-2-knockout cell lines treated with the prolyl-hydroxylase (PHD)-inhibitor FG-4592 (100 μM, 72 h). Vinculin is a loading control. FG-4592 is used to stabilize HIFs and confirm pathway disruption. b, Relative mRNA levels of HIF1A-target lactate dehydrogenase A (LDHA) in the indicated MIA PaCa-2-knockout cells treated with FG-4592 (100 μM for 72 h) compared to controls. c,d, Representative images (c) and quantification (d) of TMR-dextran (red) uptake in the indicated MIA PaCa-2-knockout cell lines under normoxia (21% O) or hypoxia (0.5% O2). Nuclei in blue. Scale bar, 10 μm. In d, data are normalized to normoxic controls. e,f, Representative images (e) and quantification (f) of TMR-dextran (red) uptake in MIA PaCa-2 cells transduced with indicated constructs under indicated conditions. Scale bar, 10 μm. In f, data are normalized to normoxic vector controls. g, Representative images from indicated MIA PaCa-2 xenografts showing macropinosomes (red), CK8+ tumour cells (green) and hypoxic areas (purple). Nuclei in blue. Dashed lines highlight hypoxic (purple) and normoxic (white) areas. Scale bar, 50 μm. h, Quantification of macropinocytic uptake in indicated MIA PaCa-2 xenografts in hypoxic (CK8+/Pimo+, red) and non-hypoxic (CK8+/Pimo, grey) tumour areas. Data are normalized to normoxic areas in sgControl tumours. b,d,fh, Bars represent mean ± s.e.m. b,d, n = 3 independent biological replicates; at least 500 (d,f) or 300 (g,h) cells were quantified in each biological replicate (n = 3). Statistical significance for all experiments was determined by a two-tailed unpaired t-test.
Fig. 6 |
Fig. 6 |. The HIF1A target CA9 is required for the upregulation of macropinocytosis in response to hypoxia.
a,b, Representative images (a) and quantification (b) of TMR-dextran (red) uptake in sgControl or sgCA9-transduced MIA PaCa-2 cells under indicated conditions. Nuclei are blue. Scale bar, 10 μm. Data are normalized to values in normoxic control cells. c, Representative images from sections of xenograft tumours derived from MIA PaCa-2 cells transduced with an sgRNA targeting CA9 showing macropinosomes (red), CK8+ tumour cells (green) and hypoxic areas (purple). Nuclei are blue. Dashed lines indicate hypoxic (purple) and normoxic (white) areas. Scale bar, 50 μm. d, Quantification of macropinocytic uptake in c for hypoxic (CK8+/Pimo+, red) and normoxic tumour areas (CK8+/Pimo, grey) in tumours arising from cells transduced with an sgControl, sgHIF1A or sgCA9. Data are presented relative to those of non-hypoxic areas in sgControl-transduced tumours. e,f, Representative images (e) and quantification (f) of TMR-dextran (red) uptake in control or CA9 overexpressing MIA PaCa-2 cells under indicated conditions. Nuclei are blue. Scale bar, 10 μm. In f, data are normalized to values in normoxic controls. g, Quantification of dextran uptake in the indicated cell lines treated with the bicarbonate transporter inhibitor S0895 (15 μM) as shown under indicated conditions. Data are normalized to values in normoxic, untreated controls. h, Relative cell number of the indicated MIA PaCa-2 cell lines grown for 5 days under hypoxia (0.5% O2) with increasing concentrations of BSA (0–1%). Data are presented relative to hypoxic cells transduced with a control sgRNA and cultured without BSA. i, Relative cell number in the indicated MIA PaCa-2 cell lines transduced with a control vector or gpASNase cDNA grown for 5 days under hypoxia (1% O2) and in the absence or presence of BSA (0.25%). Data are presented relative to values obtained for sgControl hypoxic cells cultured without BSA. b,d,f,g, Bars represent mean ± s.e.m.; At least 500 (b,d,g) or 300 (f) cells were quantified in each biological replicate (n = 3). h,i, Bars represent mean ± s.d., n = 3 biologically independent samples. Statistical significance was determined by a two-tailed unpaired t-test.
Fig. 7 |
Fig. 7 |. Loss of CA9 inhibits hypoxic cancer cell growth under aspartate limitation.
a, Immunoblot analysis of CA9 in the indicated MIA PaCa-2 cell lines transduced with a control sgRNA or an sgRNA targeting CA9. GAPDH was used as a loading control. b,c, Quantification of ratio of percent Ki67 positive cells in hypoxic (pimonidazole positive) to neighbouring normoxic (pimonidazole negative) regions in MIA PaCa-2 parental tumours (b) MIA PaCa-2 GOT2 knockout tumours (c) transduced with a control sgRNA (sgControl) or sgCA9. Data are presented relative to values obtained for sgControl tumours. d, Representative immunofluorescent images of tumour xenografts derived from indicated MIA PaCa-2 cells stained for DAPI (nucleus), Ki67 (proliferation) and pimonidazole (hypoxia marker). Scale bar, 200 μM. c,d, Bars represent mean ± s.e.m. n = total numbers of fields evaluated from all five tumours analysed, 18, 20, 14 and 15 for each group, respectively. Statistical significance determined by a two-tailed Student’s t-test.

Comment in

  • GOT2 consider the tumor microenvironment.
    Do BT, Vander Heiden MG. Do BT, et al. Trends Cancer. 2022 Nov;8(11):884-886. doi: 10.1016/j.trecan.2022.09.004. Epub 2022 Sep 21. Trends Cancer. 2022. PMID: 36153305 Free PMC article.

References

    1. Lyssiotis CA & Kimmelman AC Metabolic interactions in the tumor microenvironment. Trends Cell Biol. 27, 863–875 (2017). - PMC - PubMed
    1. DeBerardinis RJ, Lum JJ, Hatzivassiliou G & Thompson CB The biology of cancer: metabolic reprogramming fuels cell growth and proliferation. Cell Metab. 7, 11–20 (2008). - PubMed
    1. Prior IA, Hood FE & Hartley JL The frequency of ras mutations in cancer. Cancer Res. 80, 2969–2974 (2020). - PMC - PubMed
    1. Ying H. et al. Oncogenic Kras maintains pancreatic tumors through regulation of anabolic glucose metabolism. Cell 149, 656–670 (2012). - PMC - PubMed
    1. Son J. et al. Glutamine supports pancreatic cancer growth through a KRAS-regulated metabolic pathway. Nature 496, 101–105 (2013). - PMC - PubMed

Publication types

Substances