. 2022 Jun;4(6):672-682.
doi: 10.1038/s42255-022-00584-y. Epub 2022 Jun 20.

A YAP/TAZ-TEAD signalling module links endothelial nutrient acquisition to angiogenic growth

Affiliations

A YAP/TAZ-TEAD signalling module links endothelial nutrient acquisition to angiogenic growth

Yu Ting Ong et al. Nat Metab. 2022 Jun.

Abstract

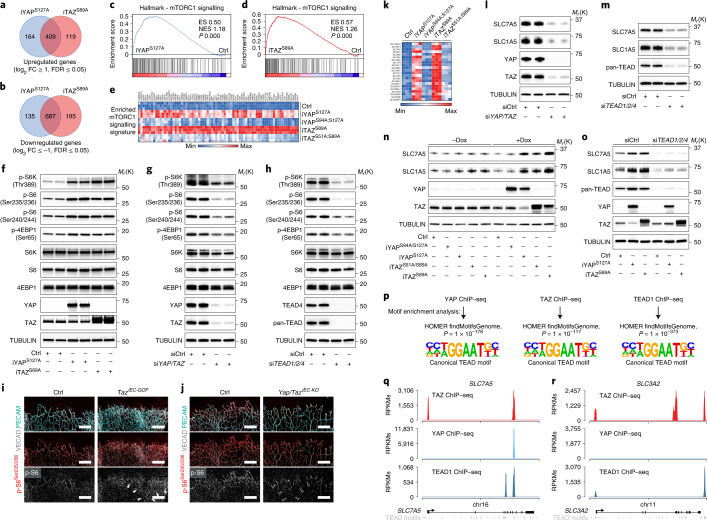
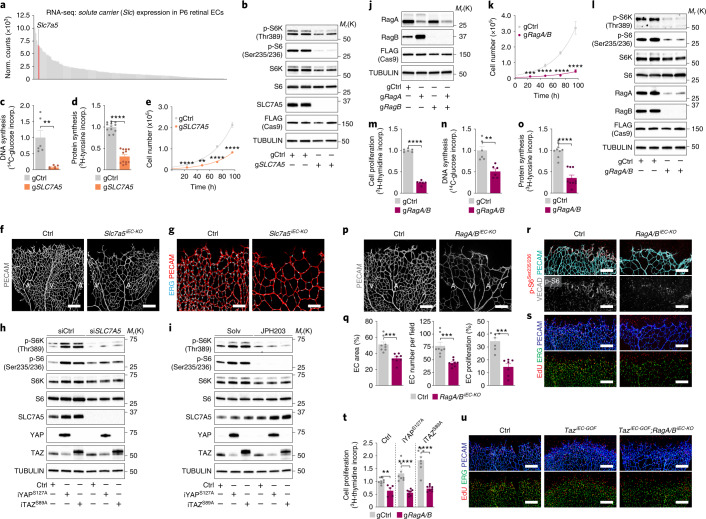
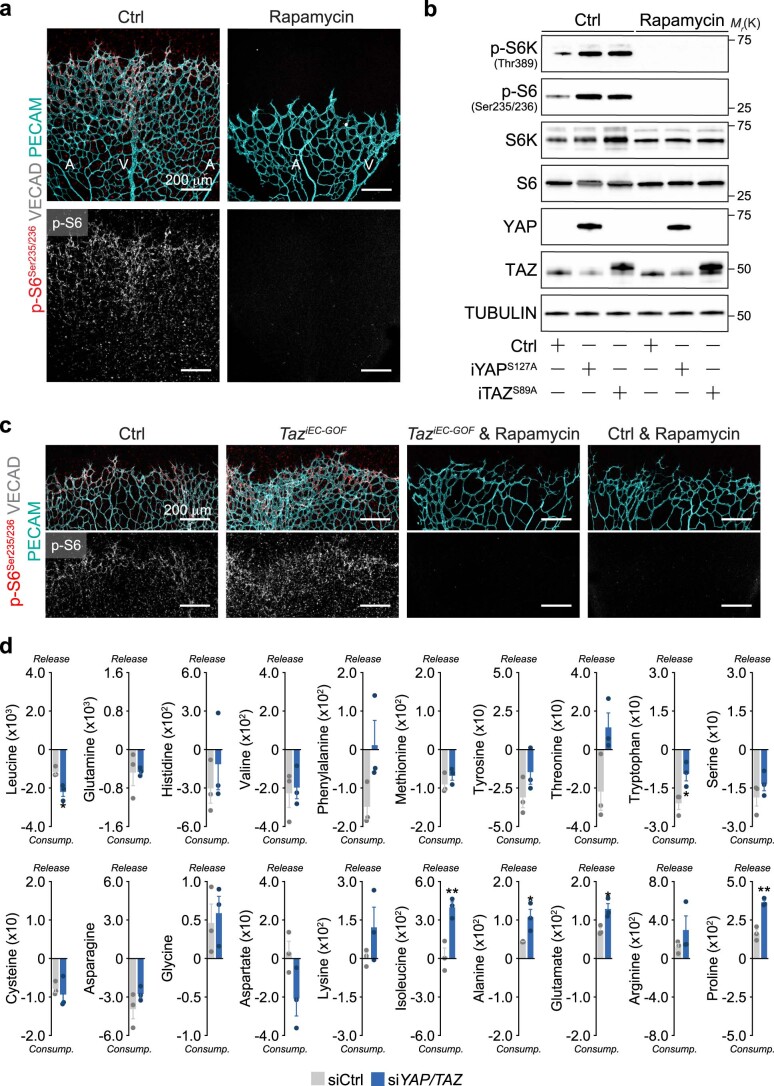
Angiogenesis, the process by which endothelial cells (ECs) form new blood vessels from existing ones, is intimately linked to the tissue's metabolic milieu and often occurs at nutrient-deficient sites. However, ECs rely on sufficient metabolic resources to support growth and proliferation. How endothelial nutrient acquisition and usage are regulated is unknown. Here we show that these processes are instructed by Yes-associated protein 1 (YAP)/WW domain-containing transcription regulator 1 (WWTR1/TAZ)-transcriptional enhanced associate domain (TEAD): a transcriptional module whose function is highly responsive to changes in the tissue environment. ECs lacking YAP/TAZ or their transcriptional partners, TEAD1, 2 and 4 fail to divide, resulting in stunted vascular growth in mice. Conversely, activation of TAZ, the more abundant paralogue in ECs, boosts proliferation, leading to vascular hyperplasia. We find that YAP/TAZ promote angiogenesis by fuelling nutrient-dependent mTORC1 signalling. By orchestrating the transcription of a repertoire of cell-surface transporters, including the large neutral amino acid transporter SLC7A5, YAP/TAZ-TEAD stimulate the import of amino acids and other essential nutrients, thereby enabling mTORC1 activation. Dissociating mTORC1 from these nutrient inputs-elicited by the loss of Rag GTPases-inhibits mTORC1 activity and prevents YAP/TAZ-dependent vascular growth. Together, these findings define a pivotal role for YAP/TAZ-TEAD in controlling endothelial mTORC1 and illustrate the essentiality of coordinated nutrient fluxes in the vasculature.


Conflict of interest statement

The authors declare no competing interests.

Figures

Fig. 1
Fig. 1. Nuclear TAZ signalling drives vascular growth.
a, Yap/Taz transcript levels in ECs sorted from postnatal day (P) 6 mouse retinas as determined by RNA-seq (n = 4 independent samples). b, YAP/TAZ immunoblot analysis of ECs isolated from murine brains and lungs. c, Schematic of the Taztag reporter containing GFP, FLAG and a biotin-labelling peptide. d, Expression of the reporter-tagged TAZ protein in whole lung lysates of wild-type, heterozygous and homozygous Taztag mice. VEGFR2, endothelial marker. e, Quantification of TAZ subcellular localization in ECs of Taztag/tag P6 retinas. N, preferentially nuclear; NC, nucleo-cytoplasmic; C, preferentially cytoplasmic (n = 10 independent samples). f, Images of GFP, ERG and PECAM-labelled P6 retinas derived from Taztag/tag mice. The grey images (lower panels) show the isolated GFP signal. The small (white) boxed area is shown at higher magnification in the upper right corner. Scale bars, 50 μm. g, Immunolabelling for TAZ, GFP and PECAM in P6 retinas of TaziEC-GOF (Pdgfb-CreERT2;Rosa26-TazS89A fl/fl) and control (Ctrl; Rosa26-TazS89A fl/fl) mice. The grey images (right panels) show the isolated TAZ signal. Scale bar, 100 μm. h, Confocal images of PECAM-labelled P6 mouse retinas of Ctrl and TaziEC-GOF mice. A, artery; V, vein. Scale bar, 200 μm. i, Quantification of vascular parameters in Ctrl and TaziEC-GOF mutants as indicated (EC area, n = 16 (Ctrl) and 14 (TaziEC-GOF) independent samples; EC number/field, n = 12 (Ctrl) and 10 (TaziEC-GOF) independent samples; EC proliferation, n = 13 (Ctrl) and 6 (TaziEC-GOF) independent samples). j, ERG and PECAM- labelled retinas at P6 showing a hyperplastic vasculature in TaziEC-GOF mice. k, Immunofluorescence images of the angiogenic front in P6 retinas of Ctrl and TaziEC-GOF mice labelled for EdU, ERG and PECAM-. Scale bar, 200 μm. Western blot data in b and d are from the respective experiment, processed in parallel and are representative of three independent experiments. For a,d,e and i, data represent mean ± s.e.m.; two-tailed unpaired t-test was used. **P < 0.01; ***P < 0.001; ****P < 0.0001; NS, not significant. The numerical data, unprocessed western blots and P values are provided as source data. Source data
Fig. 2
Fig. 2. TEADs are redundant transcriptional effectors of endothelial YAP/TAZ signalling.
a,b, Volcano plots of proteins interacting with FLAG-tagged TAZS89A (a) or YAPS127A (b) in HUVECs (n = 3 independent samples). Red dots denote proteins that are significantly enriched in the TAZS89A or YAPS127A interactome (log2 fold change (FC) ≥ 1 and false discovery rate (FDR) < 0.05). c,d, Immunoblot analysis of endothelial TAZ (c) and YAP (d) immunoprecipitates validating the interaction of endogenous YAP/TAZ with TEADs. e, mRNA expression profile of Tead1–4 in murine ECs isolated from P6 mouse retinas as determined by RNA-seq analysis (n = 4 independent samples). f, Transcript abundance of TEAD1–4 in HUVECs as assessed by RNA-seq (n = 3 independent samples). g, PECAM-immunofluorescence labelling of P6 retinas illustrating a sparse vascular network in mice lacking expression of Tead1, Tead2 and Tead4 in ECs (Pdgfb-CreERT2;Tead1fl/fl;Tead2−/−;Tead4fl/fl). h, Reduced endothelial proliferation in Tead1/2/4iEC-KO mutants as shown by EdU, ERG and PECAM colabelling of P6 retinas. Scale bars in g,h, 200 μm. i, Quantification of vascular parameters in Ctrl and Tead1/2/4iEC-KO mice (EC area, n = 8 (Ctrl) and 6 (Tead1/2/4iEC-KO) independent samples; EC number/field, n = 6 (Ctrl) and 5 (Tead1/2/4iEC-KO) independent samples; EC proliferation, n = 7 (Ctrl) and 5 (Tead1/2/4iEC-KO) independent samples). Western blot data in c and d are from the respective experiment, processed in parallel and are representative of at least three independent experiments. For e, f and i, data represent mean ± s.e.m.; two-tailed unpaired t-test. ***P < 0.001. The numerical data, unprocessed western blots and P values are provided as source data. Source data
Fig. 3
Fig. 3. YAP/TAZ-TEAD fuel endothelial mTORC1 activity by orchestrating the transcription of nutrient transporters.
a,b, Venn diagrams of up- (a) or downregulated (b) genes (log2 fold change (FC) ≥1 and FDR ≤ 0.05) in HUVECs transduced with inducible YAPS127A (iYAPS127A), TAZS89 (iTAZS89A) or control (Ctrl) lentiviruses as assessed by RNA-seq. c,d, Gene set enrichment analysis plots depicting an enrichment of genes associated with activated mTORC1 signalling in HUVECs expressing iYAPS127A (c) or iTAZS89A (d). ES, enrichment score; NES, normalized enrichment score. e, Heatmap of the enriched ‘mTORC1 signalling’ genes showing induction of these transcripts by iYAPS127A and iTAZS89A but not by the TEAD-binding-deficient iYAPS94A/S127A iTAZS51A/S89A mutants (n = 3 independent samples). f, Immunoblot analysis of S6K, S6 and 4EBP1 in Ctrl, iYAPS127A and iTAZS89A transduced HUVECs, assessing phosphorylation at mTORC1-sensitive sites. g,h, Phosphorylation status of S6K, S6 and 4EBP1 in HUVECs that were transfected with siRNAs targeting YAP/TAZ (siYAP/TAZ) (g) or TEAD1/TEAD2/TEAD4 (siTEAD1/2/4) (h). i,j, Immunolabelling of p-S6Ser235/236, VECAD and PECAM in P6 retinas of Ctrl, TaziEC-GOF (i) and Yap/TaziEC-KO (j) mutants. Scale bars, 200 μm. The isolated p-S6Ser235/236 signal is shown in grey at the bottom. Arrows indicate the peri-venous region in TaziEC-GOF (white) and Yap/TaziEC-KO mice (transparent). k, Heatmap of solute carrier expression in Ctrl, iYAPS127A-, iYAPS94A/S127A-, iTAZS89- or iTAZS51A/S89A-expressing HUVECs determined by RNA-seq (n = 3 independent samples). l,m, Immunoblot analysis of SLC7A5 and SLC1A5 in siYAP/TAZ (l) or siTEAD1/2/4 (m) transfected HUVECs. n, SLC7A5 and SLC1A5 protein levels in HUVECs expressing Ctrl, iYAPS127A, iTAZS89A, iYAPS94A/S127A or iTAZS51A/S89A. o, TEAD-depleted HUVECs fail to induce SLC7A5 and SLC1A5 in response to iYAPS127A or ITAZS89A overexpression as determined by immunoblotting. p, Analysis of endothelial YAP, TAZ and TEAD1 ChIP–seq peaks revealed the TEAD-binding sequence as a highly enriched motif. q,r, TAZ, YAP and TEAD1 ChIP–seq signals at the SLC7A5 (q) and SLC3A2 (r) genomic loci. RPKMs, reads per kilobase per million mapped reads. Western blot data in fh and lo are from the respective experiment, processed in parallel and are representative of at least three independent experiments. For c and d, the Kolmogorov–Smirnov test was used. The unprocessed blots are provided as source data. Source data
Fig. 4
Fig. 4. Nutrient-mediated mTORC1 signalling is critical for YAP/TAZ-induced vascular growth.
a, RNA-seq analysis of solute carrier expression in P6 mouse retinal ECs (n = 4 independent samples). b, S6K and S6 phosphorylation in control (gCtrl) and SLC7A5-depleted (gSLC7A5) HUVECs. Cells were generated by CRISPR–Cas9. c,d, DNA (c) and protein (d) synthesis in gCtrl and gSLC7A5 ECs (DNA synthesis, n = 6 independent samples; protein synthesis: n = 12 independent samples; incorp., incorporation). e, Cell numbers in gCtrl and gSLC7A5 HUVECs (n = 6 independent samples). f,g, PECAM (f) or ERG and PECAM (g) labelled P6 retinas of Ctrl (Slc7a5fl/fl) and Slc7a5iEC-KO (Pdgfb-creERT2;Slc7a5fl/fl) mice. A, artery; V, vein. Scale bar f, 200 μm; g, 100 μm. h,i, S6K and S6 phosphorylation in Ctrl, iYAPS127A and iTAZS89A HUVECs, in which SLC7A5 was inactivated by siRNA (siSLC7A5) (h) or the inhibitor JPH203 (i). j, RagA/B immunoblots in gRagA, gRagB and gRagA/B HUVECs. k, Cell numbers in gCtrl and gRagA/B HUVECs (n = 6 independent samples). l, Analysis of mTORC1 activity markers in RagA/B-depleted HUVECs. m, Proliferation is compromised in RagA/B-deficient HUVECs (n = 6 independent samples). n,o, Diminished anabolism in RagA/B-deficient HUVECs (DNA synthesis (n): n = 6 independent samples; protein synthesis (o): n = 9 independent samples). p, PECAM immunolabelling in P6 Ctrl (RagAfl/fl;RagBfl/fl) and RagA/BiEC-KO (Pdgfb-creERT2;RagAfl/fl;RagBfl/fl) mice. Scale bar, 200 μm. q, Vascular parameters in Ctrl and RagA/BiEC-KO mice (EC area, n = 8 (Ctrl) and 8 (RagA/BiEC-KO) independent samples; EC number/field, n = 8 (Ctrl) and 8 (RagA/BiEC-KO) independent samples; EC proliferation, n = 7 (Ctrl) and 7 (RagA/BiEC-KO) independent samples). r, p-S6Ser235/236, VECAD and PECAM labelling of P6 retinas from Ctrl and RagA/BiEC-KO mice. s, Images of P6 Ctrl and RagA/BiEC-KO retinas labelled for EdU, ERG and PECAM. Scale bars in r,s, 200 μm. t, Proliferation in Ctrl, iYAPS127A and iTAZS89A-ECs subjected to simultaneous depletion of RagA/B (n = 8 independent samples). u, Images of EdU, ERG and PECAM-labelled P6 retinas in Ctrl, TaziEC-GOF and TaziEC-GOF;RagA/BiEC-KO mice. Scale bars, 200 μm. Immunoblotting data in b,hj,l are representative of at least three independent experiments. For ce,k,mo,q and t, data represent mean ± s.e.m.; two-tailed unpaired t-test. **P < 0.01; ***P < 0.001; ****P < 0.0001. Numerical data, unprocessed blots and P values are provided as source data. Source data
Extended Data Fig. 1
Extended Data Fig. 1. Inactivation of endothelial TAZ mimics several of the YAP/TAZ mutant phenotypes.
a, EdU, ERG and PECAM immunofluorescence labelling of P6 mouse retinas depicting reduced vascular density and impaired endothelial proliferation in Yap/TaziEC-KO (Pdgfb-CreERT2;Yapfl/fl/Tazfl/fl) mice following injection of 4OHT from P1-P4. 4OHT-treated Yapfl/fl/Tazfl/fl mice served as control (Ctrl). A, artery; V, vein. The images of the isolated PECAM signal are shown in grey at lower magnification in the upper part of the panel. b, Confocal images of ERG and PECAM labelled P6 retinas of Ctrl and Yap/TaziEC-KO mice. c, Quantification of vascular parameters in Ctrl and Yap/TaziEC-KO mice at P6 as indicated (EC coverage: n = 12 (Ctrl) and 6 (Yap/TaziEC-KO) independent samples; EC number/field: n = 9 (Ctrl) and 6 (Yap/TaziEC-KO) independent samples; EC proliferation: n = 7 (Ctrl) and 4 (Yap/TaziEC-KO) independent samples). d-f, Confocal images (d,e) and quantifications (f) of PECAM (d) and ERG and PECAM (e) labelled Ctrl (Yapfl/fl) and YapiEC-KO (Pdgfb-CreERT2;Yapfl/fl) retinas at P6 (EC coverage: n = 4 (Ctrl) and 8 (YapiEC-KO) independent samples; EC number/field: n = 4 (Ctrl) and 6 (YapiEC-KO) independent samples). g-i, Confocal images (g,h) and quantifications (i) of PECAM (g) and ERG and PECAM (h) labelled Ctrl (Tazfl/fl) and TaziEC-KO (Pdgfb-CreERT2;Tazfl/fl) retinas at P6 (EC coverage: n = 8 (Ctrl) and 11 (TaziEC-KO) independent samples; EC number/field: n = 5 (Ctrl) and 10 (TaziEC-KO) independent samples). For c, f and i, data represent mean ± s.e.m.; two-tailed unpaired t-test. *P < 0.05; **P < 0.01; ****P < 0.0001; NS, not significant. The numerical data and P values are provided as source data. Source data
Extended Data Fig. 2
Extended Data Fig. 2. Expression and subcellular localization of TAZ in angiogenic ECs.
a, RNA-seq analysis of YAP and TAZ transcript levels in different human EC cultures (n = 3 independent samples). HAECs, human aortic ECs; HMVECs, human microvascular ECs; HUVECs, human umbilical vein ECs; HDLEC, human dermal lymphatic ECs. b, Immunoblot analysis of YAP and TAZ protein expression in different endothelial subtypes. c, Targeting strategy to generate a Taz (Wwtr1) knock-in allele encoding for a GFP, FLAG, and biotin-labelling peptide tagged TAZ protein. A schematic representation of the wild-type Taz (Wwtr1) locus, the targeting vector, the recombined as well as the excised locus is shown. E57, exons 5 to 7. Triangles denote loxP sites. Neo, neomycin positive selection cassette. GFB, GFP-FLAG-biotin labelling peptide fusion tag. DTA, diphteria toxin negative selection marker. d, PCR analysis of genomic DNA obtained from wild-type, heterozygote and homozygote Taztag mice. Lane 1, DNA marker. e, RT-qPCR analysis of the canonical YAP/TAZ target gene Ctgf in retinal ECs derived from wild-type (Ctrl) and homozygous Taztag/tag mice, showing no expression difference between the two genotypes (n = 2 (Ctrl) and 3 (Taztag/tag) independent samples). f, g, ERG- and PECAM- immunofluorescence staining (f) and quantification of vascular parameters (g) of P6 Ctrl and Taztag/tag retinas, revealing no gross difference in vascular morphogenesis between the two genotypes (EC area: n = 4 (Ctrl) and 8 (Taztag/tag) independent samples; Number of ECs: n = 3 (Ctrl) and 9 (Taztag/tag) independent samples). h, Images of the vascular front and plexus in TAZ, ERG and PECAM labelled P6 mouse retinas derived from C57BL/6 wild-type mice. The images in grey (right panels) show the isolated TAZ signal. Western blot data in b are from the respective experiment, processed in parallel, and are representative of at least three independent experiments. For a, e and g, data represent mean ± s.e.m.; two-tailed unpaired t-test. **P < 0.01; ****P < 0.0001; NS, not significant. The numerical data, unprocessed western blots and P values are provided as source data. Source data
Extended Data Fig. 3
Extended Data Fig. 3. Generation and validation of conditional Taz gain-of-function mice.
a, Schematic representations of the wild-type Rosa26 locus, the targeting vector, the recombined as well as the excised allele are shown. A cassette containing the CAG promoter, a floxed STOP sequence, a cDNA encoding for 3xFLAG-tagged TAZS89A and IRES-nGFP was inserted into the Rosa26 locus. Triangles denote loxP sites. DTA, diphteria toxin negative selection marker; pA, polyA signal. b, Immunoblot analysis of total lung lysates from control (Ctrl, Rosa26-TazS89A fl/fl) and mutant mice (TaziEC-GOF, Pdgfb-creERT2;Rosa26-TazS89A fl/fl). 4OHT was administered from P1 to P4 and samples analyzed at P6. Arrow heads indicate expression of the FLAG-tagged TazS89A mutant. c, RT-qPCR analysis of retinal ECs at P6, showing increased expression of the canonical YAP/TAZ target gene Ctgf in TaziEC-GOF mice when compared to Ctrl (n = 4 independent samples). d, Immunofluorescence staining for GFP, ERG and PECAM in P6 retinas depicting a nuclear GFP signal in PECAM positive vessels of TaziEC-GOF mutants, which is absent in Ctrl mice. e, Higher magnification images of P6 retinas labelled for EdU, ERG and PECAM showing increased EC proliferation in the TaziEC-GOF mice. f, g, Confocal images (f) and quantification of endothelial coverage (g) in PECAM labelled P6 retinas obtained from Ctrl (Yapfl/fl;Tazfl/fl;Rosa26-TazS89A fl/wt), Yap/TaziEC-KO (Pdgfb-creERT2;Yapfl/fl;Tazfl/fl;Rosa26-TazS89A wt/wt) and Yap/TaziEC-KO;TaziEC-GOF (Pdgfb-creERT2;Yapfl/fl;Tazfl/fl;Rosa26-TazS89A fl/wt) mice (EC coverage: n = 16 (Ctrl), 7 (Yap/TaziEC-KO) and 8 (Yap/TaziEC-KO;TaziEC-GOF) independent samples). Western blot data in b are from the respective experiment, processed in parallel, and are representative of at least three independent experiments. For c, g, data represent mean ± s.e.m.; two-tailed unpaired t-test. *P < 0.05; **P < 0.01; ****P < 0.0001. The numerical data, unprocessed western blots and P values are provided as source data. Source data
Extended Data Fig. 4
Extended Data Fig. 4. Vascular phenotypes of Tead mutant mice in the postnatal mouse retina.
a-c, PECAM immunofluorescence labelling of P6 (a) Tead2KO (Tead2-/-), (b) Tead4iEC-KO (Pdgfb-CreERT2;Tead4fl/fl) and (c) Tead1/4iEC-KO (Pdgfb-CreERT2;Tead1fl/fl;Tead4fl/fl) retinas, showing only mild vascular phenotypes when compared to controls (Tead2+/+, Tead4fl/fl and Tead1fl/fl;Tead4fl/fl, respectively). d, Quantification of endothelial coverage in Ctrl, Tead2KO, Tead4iEC-KO and Tead1/4iEC-KO mice (EC area: n = 3 (Ctrl) and 4 (Tead2KO); EC area: n = 3 (Ctrl) and 3 (Tead4iEC-KO); EC area: n = 4 (Ctrl) and 4 (Tead1/4iEC-KO) independent samples). e, Higher magnification images of P6 retinas from Ctrl and Tead1/2/4iEC-KO mice, showing a sparse capillary network with clumped endothelial sprouts in the mutants. f, Confocal images of ERG and PECAM stained P6 retinas in Ctrl and Tead1/2/4iEC-KO mice, revealing a hypocellular endothelial network in the endothelial Tead mutant retinas. For d, data represent mean ± s.e.m.; two-tailed unpaired t-test. *P < 0.05; NS, not significant. The numerical data and P values are provided as source data. Source data
Extended Data Fig. 5
Extended Data Fig. 5. Forced nuclear expression of YAP or TAZ induces canonical YAP/TAZ signaling in ECs.
a, Immunoblots of HUVECs transduced with doxycycline (Dox)-inducible control (Ctrl), YAPS127A (iYAPS127A) and TAZS89A (iTAZS89A) encoding lentiviruses, showing expression of FLAG-tagged YAPS127A and TAZS89A upon Dox treatment. Samples were analyzed 48 h after treatment with Dox or vehicle. b, RT-qPCR analysis of the canonical YAP/TAZ target genes ANKRD1, CTGF, and CYR61 in iYAPS127A and iTAZS89A expressing HUVECs. Expression changes are shown relative to Ctrl (n = 8 independent samples). c, d, Gene set enrichment analysis (GSEA) showing an enrichment of the YAP-conserved target gene expression signature in the transcriptomes of iYAPS127A (c) and iTAZS89A (d) expressing HUVECs. ES, enrichment score; NES, normalized enrichment score. e, f, FLAG immunoprecipitation studies in HUVECs overexpressing FLAG-tagged iYAPS127A and iYAPS94A/S127A (e) or iTAZS89A and iTAZS51A/S89A (f). The mutation of serine 94 to alanine in YAP and serine 51 to alanine in TAZ disrupts the interaction of (nuclear) YAP and TAZ with TEADs. g, Heatmap of mRNA expression changes in HUVECs expressing Ctrl, iYAPS127A, iYAPS94A/S127A, iTAZS89A or iTAZS51A/S89A as determined by RNA-seq. Canonical YAP/TAZ target genes are shown (n = 3 independent samples). Western blot data in a, e and f are from the respective experiment, processed in parallel, and are representative of at least three independent experiments. For b, data represent mean ± s.e.m.; two-tailed unpaired t-test. For c, d, Kolmogorov-Smirnov test. *P < 0.05; **P < 0.01; ***P < 0.001; ****P < 0.0001. The numerical data, unprocessed western blots and P values are provided as source data. Source data
Extended Data Fig. 6
Extended Data Fig. 6. Canonical YAP/TAZ signaling controls mTORC1, anabolism and proliferation in ECs in vitro.
a-c, Quantification of S6K (a) and S6 (b,c) phosphorylation in iYAPS127A or iTAZS89A expressing ECs as determined by immunoblotting (p-S6KThr389: n = 6 independent samples; p-S6Ser235/236: n = 4 independent samples; p-S6Ser240/244: n = 4 independent samples). d, e, DNA (d) and protein (e) synthesis in Ctrl, iYAPS127A and iTAZS89A HUVECs. Parameters were determined by assessing the incorporation of radiolabeled 14C-D-glucose into DNA or 3H-tyrosine into protein (DNA synthesis: n = 12 (Ctrl), 10 (iYAPS127A) and 11 (iTAZS89A) independent samples; Protein synthesis: n = 18 (Ctrl), 16 (iYAPS127A) and 16 (iTAZS89A) independent samples). f, Assessment of proliferation in iYAPS127A and iTAZS89A expressing HUVECs as measured by 3H-thymidine DNA incorporation (n = 15 independent samples). g, Cell counts over a 96 h period, demonstrating increased cell numbers in iYAPS127A and iTAZS89A expressing HUVECs when compared to Ctrl (n = 9 independent samples). h-j, Quantification of S6K (h) and S6 (i,j) phosphorylation in HUVECs transfected with siRNAs targeting YAP/TAZ (siYAP/TAZ). A pool of non-targeting siRNAs (siCtrl) was used as a control (p-S6KThr389: n = 8 independent samples; p-S6Ser235/236: n = 8 independent samples; p-S6Ser240/244: n = 6 independent samples). k, l, Reduction in DNA (k) and protein synthesis (l) in YAP/TAZ-depleted ECs (DNA synthesis: n = 6 (siCtrl) and 5 (siYAP/TAZ) independent samples; Protein synthesis: n = 15 (siCtrl) and 14 (siYAP/TAZ) independent samples). m, Reduced cell proliferation in YAP/TAZ-deficient HUVECs as assessed by 3H-thymidine incorporation into DNA (n = 12 independent samples). n, Reduced cell counts in siYAP/TAZ versus siCtrl HUVECs (n = 9 independent samples). o-q, Quantification of S6K (o) and S6 (p,q) phosphorylation in HUVECs transfected with siRNAs targeting TEAD1, TEAD2 and TEAD4 (siTEAD1/2/4). Non-targeting siRNAs (siCtrl) were used as a control (p-S6KThr389: n = 4 independent samples; p-S6Ser235/236: n = 4 independent samples; p-S6Ser240/244: n = 4 independent samples). For a – q, data represent mean ± s.e.m.; two-tailed unpaired t-test. *P < 0.05; **P < 0.01; ***P < 0.001; ****P < 0.0001. The numerical data and P values are provided as source data. Source data
Extended Data Fig. 7
Extended Data Fig. 7. Canonical YAP/TAZ signaling regulates endothelial mTORC1 in vivo.
a,b, Higher magnifications images of p-S6Ser235/236, VE-cadherin (VECAD), and PECAM immunostainings in P6 retinas of Ctrl, TaziEC-GOF (a) and Yap/TaziEC-KO (b) mutants. The isolated p-S6Ser235/236 signal is shown in grey at the bottom of the panels. c, Immunolabeling of p-S6Ser235/236, VECAD, and PECAM in P6 retinas of Ctrl and Tead1/2/4iEC-KO mice. d-f, Quantification of endothelial p-S6Ser235/236 signals in (d) TaziEC-GOF (n = 14 (Ctrl) and 10 (TaziEC-GOF) independent samples), (e) Yap/TaziEC-KO (n = 7 (Ctrl) and 8 (Yap/TaziEC-KO) independent samples) and (f) Tead1/2/4iEC-KO mutants (n = 10 (Ctrl) and 4 (Tead1/2/4iEC-KO) independent samples). g,h, p-S6Ser240/244, VECAD, and PECAM immunolabelling in P6 Ctrl, TaziEC-GOF (g) and Yap/TaziEC-KO (h) mutants. For d-f, data represent mean ± s.e.m.; two-tailed unpaired t-test. **P < 0.01. The numerical data and P values are provided as source data. Source data
Extended Data Fig. 8
Extended Data Fig. 8. mTOR inhibition prevents TAZ-induced vascular overgrowth.
a, Immunolabeling of p-S6Ser235/236, VECAD and PECAM stained wild-type retinas showing reduced vascular growth and extinguished S6 phosphorylation in mice treated with the mTOR inhibitor rapamycin. Mice were treated with solvent (Ctrl) or rapamycin from P1-P5 and analyzed at P6. The isolated p-S6Ser235/236 signal is shown in grey in the lower panels. A, artery; V, vein. b, Immunoblot analysis of ECs transduced with doxycycline (Dox)-inducible YAPS127A (iYAPS127A), TAZS89A (iTAZS89A) or control (Ctrl) lentiviruses, and treated with Dox as well as rapamycin or vehicle. c, Confocal images showing p-S6Ser235/236, VECAD and PECAM stained P6 retinas in Ctrl and TaziEC-GOF mice after intraperitoneal administration of vehicle or rapamycin from P1 to P5. Mice were also injected with 4OHT (P1 to P4) to induce Cre-mediated recombination of the TazGOF allele. The isolated p-S6Ser235/236 signal is shown in grey in the lower panels. d, Analysis of amino acid consumption and release in control (siCtrl) and YAP/TAZ-deficient (siYAP/TAZ) HUVECs as determined by LC-MS/MS (n = 3 independent samples). Western blot data in b are from the respective experiment, processed in parallel, and are representative of at least three independent experiments. For d, data represent mean ± s.e.m.; two-tailed unpaired t-test, *P < 0.05. **P < 0.01. The numerical data, unprocessed western blots and P values are provided as source data. Source data
Extended Data Fig. 9
Extended Data Fig. 9. Characterization of direct YAP/TAZ-TEAD target genes in ECs.
a,b, ChIP-seq signals of TAZ, YAP and TEAD1 at the genomic loci of the canonical target genes ANKRD1 (a) and AXL (b). ChIP-seq signals are represented as reads per kilobase per million mapped reads (RPKMs). c,d, Slc7a5 expression in ECs isolated from the lungs of Rosa26-TazS89A fl/fl (c) or Yapfl/fl;Tazfl/fl (d) mice followed by transduction with control (AdCtrl) or Cre-encoding (AdCre) adenoviruses. Slc7a5 transcript levels were determined by RT-qPCR (c, n = 6 independent samples; d, n = 6 independent samples). e, Reduced cell proliferation in SLC7A5-deficient HUVECs (gSLC7A5) as measured by 3H-thymidine DNA incorporation (n = 8 independent samples). Values are represented as fold change relative to control (gCtrl). f, Quantification of vascular parameters in Ctrl and Slc7a5iEC-KO mice as indicated (EC area: n = 8 (Ctrl) and 10 (Slc7a5iEC-KO) independent samples; EC number / field: n = 9 (Ctrl) and 11 (Slc7a5iEC-KO) independent samples; EC proliferation: n = 9 (Ctrl) and 11 (Slc7a5iEC-KO) independent samples). g, Immunofluorescence staining for EdU, ERG and PECAM in P6 Ctrl and Slc7a5iEC-KO retinas. h, Confocal images of VECAD, p-S6Ser235/236 and PECAM stained P6 retinas of Ctrl and Slc7a5iEC-KO mice, suggesting reduced mTORC1 signaling in Slc7a5 mutants. The isolated p-S6Ser235/236 signal is shown in grey at the bottom of the panel. i, Immunoblots of HUVECs transduced with Ctrl or SLC7A5 encoding lentivirus, showing that overexpression of SLC7A5 is insufficient to restore mTORC1 activity in YAP/TAZ-depleted HUVECs (siYAP/TAZ). Western blot data in i are from the respective experiment, processed in parallel, and are representative of at least three independent experiments. For c, d, e-f, data represent mean ± s.e.m.; two-tailed unpaired t-test. **P < 0.01; ***P < 0.01; ****P < 0.0001. The numerical data, unprocessed western blots and P values are provided as source data. Source data
Extended Data Fig. 10
Extended Data Fig. 10. Suppression of endothelial RAG GTPase signaling inhibits mTORC1 and proliferation in ECs.
a, RT-qPCR analysis in gCtrl and gRagA/B HUVECs, showing that RagA/B deficiency does not alter MTOR transcript levels (n = 3 independent samples). b, c, Immunoblot analysis (b) and quantification (c) of mTOR protein levels in control (gCtrl) or in RagA/B-depleted (gRagA/B) HUVECs, confirming the RT-qPCR analysis (n = 4 independent samples). d, Analysis of mTOR/LAMP2 co-localization in RagA/B-deficient ECs as assessed by immunofluorescence imaging (n = 5 independent samples). e, Immunofluorescence images of gCtrl and gRagA/B HUVECs stained for the lysosomal protein LAMP2, mTOR, phalloidin (PHAL) and DAPI, showing reduced mTOR/LAMP2 co-localization in gRagA/B ECs when compared to gCtrl. f, Higher magnification images of P6 Ctrl and RagA/BiEC-KO mutant mice labelled for p-S6Ser235/236, VECAD and PECAM. The images in the lower panel show the isolated p-S6Ser235/236 signal in grey. g, Higher magnification confocal images of P6 Ctrl and RagA/BiEC-KO retinas labelled for EdU, ERG and PECAM demonstrating a reduced number of proliferating ECs in the mutants. h, i, Suppression of DNA (h) and protein (i) synthesis in Ctrl, iYAPS127A and iTAZS89A HUVECs subjected to simultaneous depletion of RagA/B. DNA synthesis was measured by assessing the incorporation of 14C-glucose into DNA (n = 5 independent samples). Protein synthesis was measured by assessing the incorporation of 3H-tyrosine into protein (n = 9 independent samples). Western blot data in b are from the respective experiment, processed in parallel, and are representative of three independent experiments. For a, c, d, h and i, data represent mean ± s.e.m.; two-tailed unpaired t-test. *P < 0.05; **P < 0.01; ***P < 0.001; ****P < 0.0001; NS, not significant. The numerical data, unprocessed western blots and P values are provided as source data. Source data

Comment in

References

    1. Augustin HG, Koh GY. Organotypic vasculature: from descriptive heterogeneity to functional pathophysiology. Science. 2017;357:eaal2379. - PubMed
    1. Potente M, Makinen T. Vascular heterogeneity and specialization in development and disease. Nat. Rev. Mol. Cell Biol. 2017;18:477–494. - PubMed
    1. Palm W, Thompson CB. Nutrient acquisition strategies of mammalian cells. Nature. 2017;546:234–242. - PMC - PubMed
    1. Li X, Sun X, Carmeliet P. Hallmarks of endothelial cell metabolism in health and disease. Cell Metab. 2019;30:414–433. - PubMed
    1. Kim J, et al. YAP/TAZ regulates sprouting angiogenesis and vascular barrier maturation. J. Clin. Invest. 2017;127:3441–3461. - PMC - PubMed

Publication types

MeSH terms