. 2022 Jun 20;79(7):371.
doi: 10.1007/s00018-022-04400-4.

SHANK3 deficiency leads to myelin defects in the central and peripheral nervous system

Affiliations

SHANK3 deficiency leads to myelin defects in the central and peripheral nervous system

Mariagiovanna Malara et al. Cell Mol Life Sci. .

Abstract

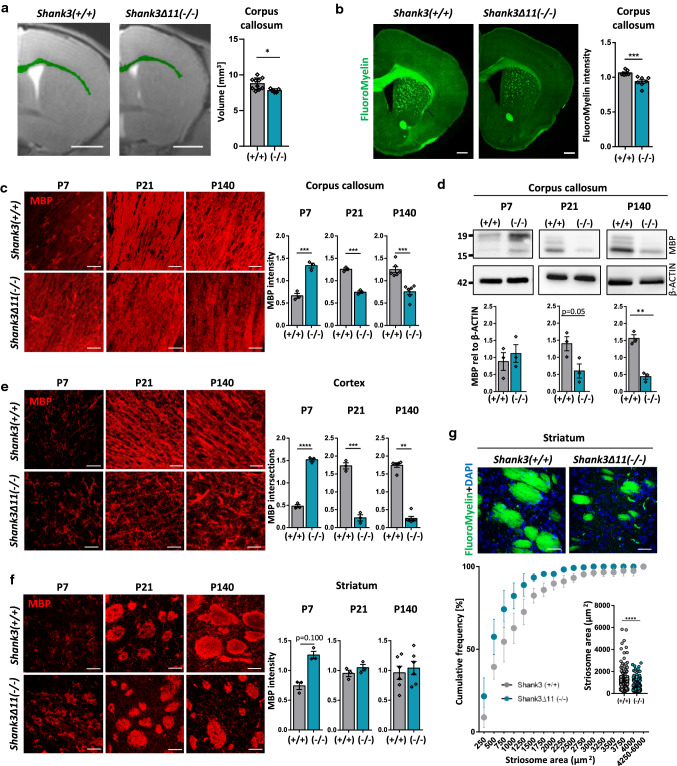
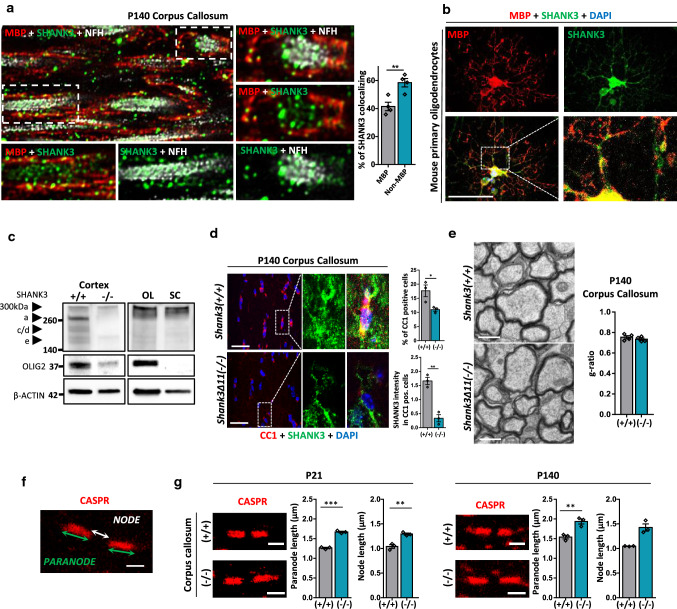
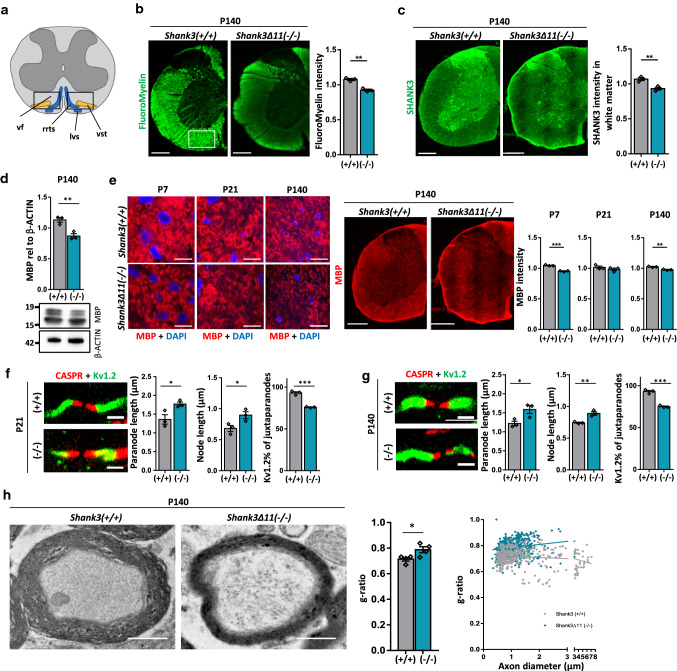
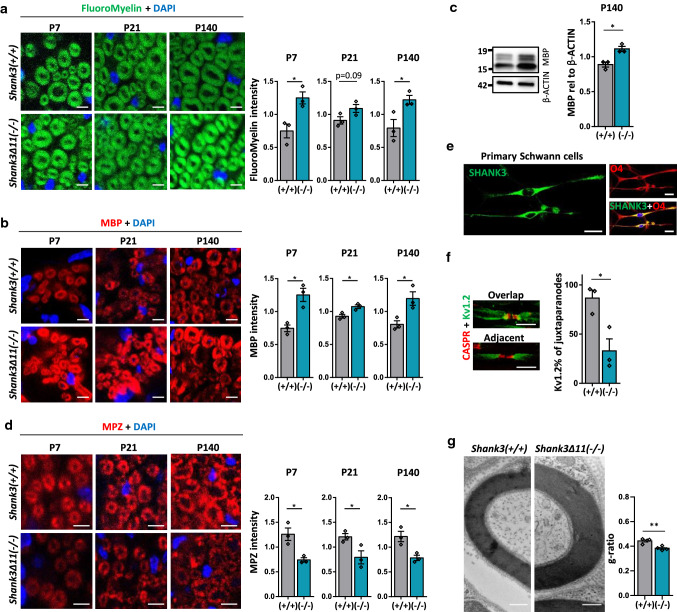
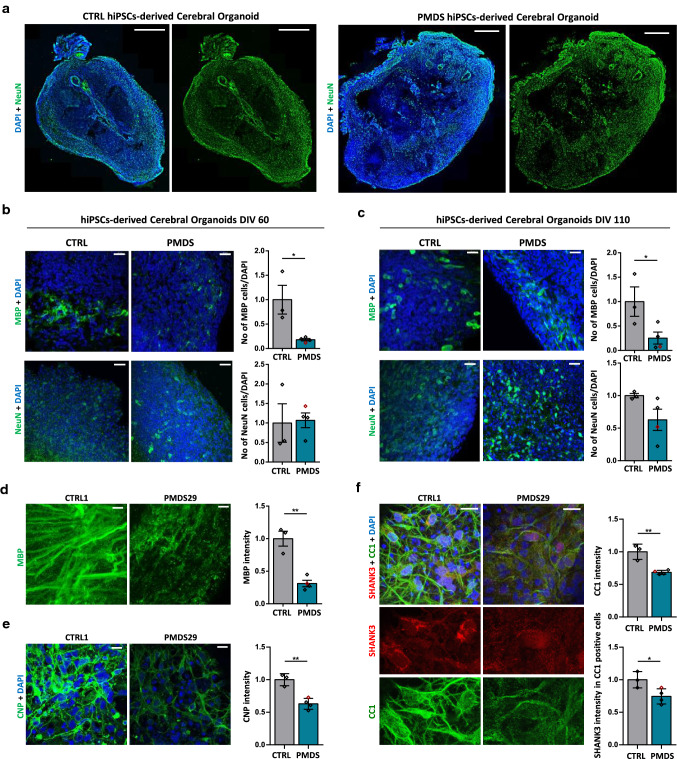
Mutations or deletions of the SHANK3 gene are causative for Phelan-McDermid syndrome (PMDS), a syndromic form of autism spectrum disorders (ASDs). We analyzed Shank3Δ11(-/-) mice and organoids from PMDS individuals to study effects on myelin. SHANK3 was found to be expressed in oligodendrocytes and Schwann cells, and MRI analysis of Shank3Δ11(-/-) mice revealed a reduced volume of the corpus callosum as seen in PMDS patients. Myelin proteins including myelin basic protein showed significant temporal and regional differences with lower levels in the CNS but increased amounts in the PNS of Shank3Δ11(-/-) animals. Node, as well as paranode, lengths were increased and ultrastructural analysis revealed region-specific alterations of the myelin sheaths. In PMDS hiPSC-derived cerebral organoids we observed an altered number and delayed maturation of myelinating cells. These findings provide evidence that, in addition to a synaptic deregulation, impairment of myelin might profoundly contribute to the clinical manifestation of SHANK3 deficiency.

Keywords: ASD; Myelin; SHANK3; hiPSCs.


Conflict of interest statement

The authors declare no competing interests.

Figures

Fig. 1
Fig. 1
White matter and MBP expression are changed in the brain of Shank3Δ11(−/−) mice. a MRI analysis of corpus callosum volume in 9-week-old male Shank3(+ / +) and Shank3Δ11(−/−) animals. Scale bar 2 mm. n = 10 + / + , n = 5 −/− animals. Mean ± SEM. Student’s Unpaired t test, p = 0.0211. b FluoroMyelin intensity analysis in corpus callosum of 140-day-old Shank3(+ / +) and Shank3Δ11(−/−) animals. Scale bar 500 μm. n = 7 animals. Mean ± SEM. Mann–Whitney test, p = 0.0006. c MBP IHC and intensity analysis in corpus callosum of 7-, 21- and 140-day-old Shank3(+ / +) and Shank3Δ11(−/−) animals. Scale bar 30 μm. n = 3 animals, P140 n = 6. Mean ± SEM. Student’s Unpaired t test, P7 p = 0.0010, P21 p = 0.0002, P140 p = 0.0003. d Western Blot analysis of MBP and β-ACTIN in corpus callosum of 7-, 21- and 140-day-old Shank3(+ / +) and Shank3Δ11(−/−) animals. n = 3 animals. Mean ± SEM. Student’s Unpaired t test, P7 p = 0.5564, P21 p = 0.0526, P140 p = 0.0011. e MBP IHC and analysis of number of intersections in cortex of 7-, 21- and 140-day-old Shank3(+ / +) and Shank3Δ11(−/−) animals. Scale bar 30 μm. n = 3 animals, P140 n = 6. Mean ± SEM. Student’s Unpaired t test, P7 p < 0.0001, P21 p = 0.0003, Mann–Whitney test P140 p = 0.0022. f MBP IHC and intensity analysis in striatum of 7-, 21- and 140-day-old Shank3(+ / +) and Shank3Δ11(−/−) animals. Scale bar 30 μm. n = 3 animals, P140 n = 6. Mean ± SEM. Mann–Whitney test P7 p = 0.100, Student’s Unpaired t test, P21 p = 0.2726, P140 p = 0.6264. g FluoroMyelin and DAPI staining in striatum of 140-day-old Shank3(+ / +) and Shank3Δ11(−/−) animals and analysis of striosome area. Scale bar 30 μm. n = 4 striosomes collected from 4 animals. Mean ± SEM. Student’s Unpaired t test, p < 0.0001
Fig. 2
Fig. 2
SHANK3 expression in myelinating cells. a SHANK3, MBP and NFH IHC in corpus callosum of 140-day-old Shank3(+ / +) animals using expansion microscopy. The percentage of SHANK3 in the MBP compartment relative to the total SHANK3 content per fiber is shown. n = 4 animals. Mean ± SEM. Student’s Unpaired t test, p = 0.0073. b SHANK3 and MBP ICC in mouse primary oligodendrocytes. Scale bar 50 μm. c Western Blot analysis for SHANK3, OLIG2 and β-ACTIN in cortical lysates, primary oligodendrocytes (OL), and primary Schwann cells (SC). d SHANK3 and CC1 IHC and analysis in corpus callosum of 140-day-old Shank3(+ / +) and Shank3Δ11(−/−) animals. Scale bar 15 μm. n = 3 animals. Mean ± SEM. CC1-positive: Student’s Unpaired t test, p = 0.0370. SHANK3/CC1-positive: Student’s Unpaired t test, p = 0.0017. e TEM analysis of corpus callosum of 140-day-old Shank3(+ / +) and Shank3Δ11(−/−) animals. g-ratio was analyzed. Mean ± SEM. Scale bar 0.5 μm. n = 4 animals. Student’s Unpaired t test, p = 0.3674. f Paranodal CASPR immunofluorescence image. Measurement of paranode length (indicated by green arrow) and node length (indicated by white arrows). Scale bar 2 μm. g CASPR IHC and analysis in corpus callosum of 21 and 140 days old Shank3(+ / +) and Shank3Δ11(−/−) animals. Scale bar 2 μm. n = 3 animals. Mean ± SEM. Student’s Unpaired t test, P21: paranode p = 0.0001, node p = 0.0038. P140: paranode p = 0.0074, node Mann–Whitney test p = 0.100
Fig. 3
Fig. 3
White matter and MBP expression are changed in the spinal cord of Shank3Δ11(−/−) mice. a Schematic illustration of the analyzed region in cervical spinal cord. vf: ventral funiculus, rrts: rostral reticulo-spinal tract, lvs: lateral vestibulo-spinal tract, vst: ventral spino-thalamic tract. Blue: descending fiber tract, yellow: ascending fiber tract. b FluoroMyelin intensity analysis in cervical spinal cord of 140-day-old Shank3(+ / +) and Shank3Δ11(−/−) animals. Scale bar 500 μm. n = 3 animals. Mean ± SEM. Student’s Unpaired t test, p = 0.0016. c SHANK3 IHC and analysis in ventral cervical spinal cord of 140-day-old Shank3(+ / +) and Shank3Δ11(−/−) animals. Scale bar 500 μm. n = 3 animals. Mean ± SEM. Student’s Unpaired t test, p = 0.0089. d Western Blot analysis of MBP and β-ACTIN in cervical spinal cord of 140-day-old Shank3(+ / +) and Shank3Δ11(−/−) animals. n = 3 animals. Mean ± SEM. Student’s Unpaired t test, p = 0.0080. e MBP and DAPI IHC and analysis in ventral cervical spinal cord of 7-, 21- and 140-day-old Shank3(+ / +) and Shank3Δ11(−/−) animals. Scale bar 20 μm. n = 3 animals. Mean ± SEM. Student’s Unpaired t test, P7 p = 0.0003, P21 p = 0.3205, P140 p = 0.0041. f + g CASPR and Kv1.2 IHC (labeled in red and green, respectively) and analysis in ventral lumbar spinal cord of 21- and 140-day-old Shank3(+ / +) and Shank3Δ11(−/−) animals. Scale bar 2 μm. n = 3 animals. Mean ± SEM. Student’s Unpaired t test, P21: paranode p = 0.0388, node p = 0.0444, adjacent p = 0.0003. P140: paranode p = 0.0380, node p = 0.0063, adjacent p = 0.0003. h TEM analysis of ventral cervical spinal cord of 140-day-old Shank3(+ / +) and Shank3Δ11(−/−) animals. n = 4 animals. Mean ± SEM. g-ratio was analyzed. Student’s Unpaired t test, p = 0.03. Scale bar 2 μm. g-ratio of individual axons as a function of axon diameter. Shank3(+ / +) R2 = 0.0257, Shank3Δ11(−/−) R2 = 0.02904, Slope: p < 0.0001, Intercepts: Shank3(+ / +) = 0.727, Shank3Δ11(−/−) = 0.7602
Fig. 4
Fig. 4
White matter, MBP and MPZ expression are changed in the sciatic nerve of Shank3Δ11(−/−) mice. a FluoroMyelin analysis and DAPI staining in sciatic nerve of 7-, 21- and 140-day-old Shank3(+ / +) and Shank3Δ11(−/−) animals. Scale bar 5 µm. n = 3 animals. Mean ± SEM. Student’s Unpaired t test, P7 p = 0.0224, P21 p = 0.0912, P140 p = 0.0425. b MBP and DAPI IHC and analysis in sciatic nerve of 7-, 21- and 140-day-old Shank3(+ / +) and Shank3Δ11(−/−) animals. Scale bar 5 µm. n = 3 animals. Mean ± SEM. Student’s Unpaired t test. P7 p = 0.0104, P21 p = 0.0205, P140 p = 0.0280. c Western Blot analysis of MBP and β-ACTIN in sciatic nerve of 140-day-old Shank3(+ / +) and Shank3Δ11(−/−) animals. n = 3 animals. Mean ± SEM. Student’s Unpaired t test, p = 0.0117. d MPZ and DAPI IHC and analysis in sciatic nerve of 7-, 21- and 140-day-old Shank3(+ / +) and Shank3Δ11(−/−) animals. Scale bar 10 µm. n = 3 animals. Mean ± SEM. Student’s Unpaired t test. P7 p = 0.0177, P21 p = 0.0477, P140 p = 0.0205. e SHANK3 localization in O4-positive primary Schwann cells. Scale bar 20 µm. f CASPR and Kv1.2 IHC in sciatic nerve of 140-day-old Shank3(+ / +) and Shank3Δ11(−/−) animals. Scale bar 10 µm. n = 3 animals. Percentage of adjacent CASPR and Kv1.2 structures. Mean ± SEM. Student’s Unpaired t test, p = 0.0216. g TEM analysis of sciatic nerve. Myelinated axons of 140-day-old Shank3(+ / +) and Shank3Δ11(−/−) animals and g-ratio analysis. Student’s Unpaired t test, p = 0.0035
Fig. 5
Fig. 5
Human cerebral organoids recapitulate the MBP changes seen in vivo. a IHC for NeuN and DAPI in DIV 110 hiPSC-organoids of CTRL and PMDS. Scale bar 500 μm. b IHC for MBP and DAPI, NeuN and DAPI in DIV 60 hiPSC-organoids of CTRL and PMDS. The InsG line is indicated in red. Number of MBP-positive cells: Student’s Unpaired t test, p = 0.0212. Mean ± SEM. Number of NeuN positive cells: Student’s Unpaired t test, p = 0.8895. Scale bar 30 μm. c IHC for MBP and DAPI, NeuN and DAPI in DIV 110 hiPSC-organoids of CTRL and PMDS. Number of MBP-positive cells: Student’s Unpaired t test, p = 0.0496. Mean ± SEM. Number of NeuN positive cells: Student’s Unpaired t test, p = 0.1156. Scale bar 30 μm. d IHC for MBP and DAPI in DIV 110 hiPSC-organoids of CTRL and PMDS. The InsG line is indicated in red. n = 3 organoids per cell line. Mean ± SEM. MBP intensity: Student’s Unpaired t test, p = 0.0017. Scale bar 30 μm. e CNP IHC in DIV120 hiPSC-derived air–liquid interface cerebral organoids (ALI-COs) of CTRL and PMDS. The InsG line is indicated in red. Student’s Unpaired t test, p = 0.0026. Scale bar 10 μm. f SHANK3 and CC1 IHC in DIV120 hiPSC-derived ALI-COs of CTRL and PMDS. The InsG line is indicated in red. Mean ± SEM. Student’s Unpaired t test. CC1 intensity p = 0.0032. SHANK3 in CC1-positive p = 0.0382. Scale bar 10 μm

Similar articles

Cited by

References

    1. DSM-V DDMNSYPICfDCP, Prevalence of autism spectrum disorders—Autism and Developmental Disabilities Monitoring Network, United States, 2006. Morb Mortal Wkly Rep Recomm Rep. 2009;58(10):1–20. - PubMed
    1. Developmental Disabilities Monitoring Network Surveillance Year Principal I, Centers for Disease C, Prevention. Prevalence of autism spectrum disorder among children aged 8 years - autism and developmental disabilities monitoring network, 11 sites, United States, 2010. Morbidity and mortality weekly report Surveillance summaries. 2014;63(2):1–21. - PubMed
    1. Grabrucker AM. Environmental factors in autism. Front Psych. 2012;3:118. doi: 10.3389/fpsyt.2012.00118. - DOI - PMC - PubMed
    1. Modabbernia A, Velthorst E, Reichenberg A. Environmental risk factors for autism: an evidence-based review of systematic reviews and meta-analyses. Mol Autism. 2017;8:13. doi: 10.1186/s13229-017-0121-4. - DOI - PMC - PubMed
    1. Zoghbi HY, Bear MF. Synaptic dysfunction in neurodevelopmental disorders associated with autism and intellectual disabilities. Cold Spring Harbor Perspect Biol. 2012 doi: 10.1101/cshperspect.a009886. - DOI - PMC - PubMed

Supplementary concepts