. 2022 Jun;3(6):710-722.
doi: 10.1038/s43018-022-00399-6. Epub 2022 Jun 20.

Analysis of lorlatinib analogs reveals a roadmap for targeting diverse compound resistance mutations in ALK-positive lung cancer

Affiliations

Analysis of lorlatinib analogs reveals a roadmap for targeting diverse compound resistance mutations in ALK-positive lung cancer

Aya Shiba-Ishii et al. Nat Cancer. 2022 Jun.

Abstract

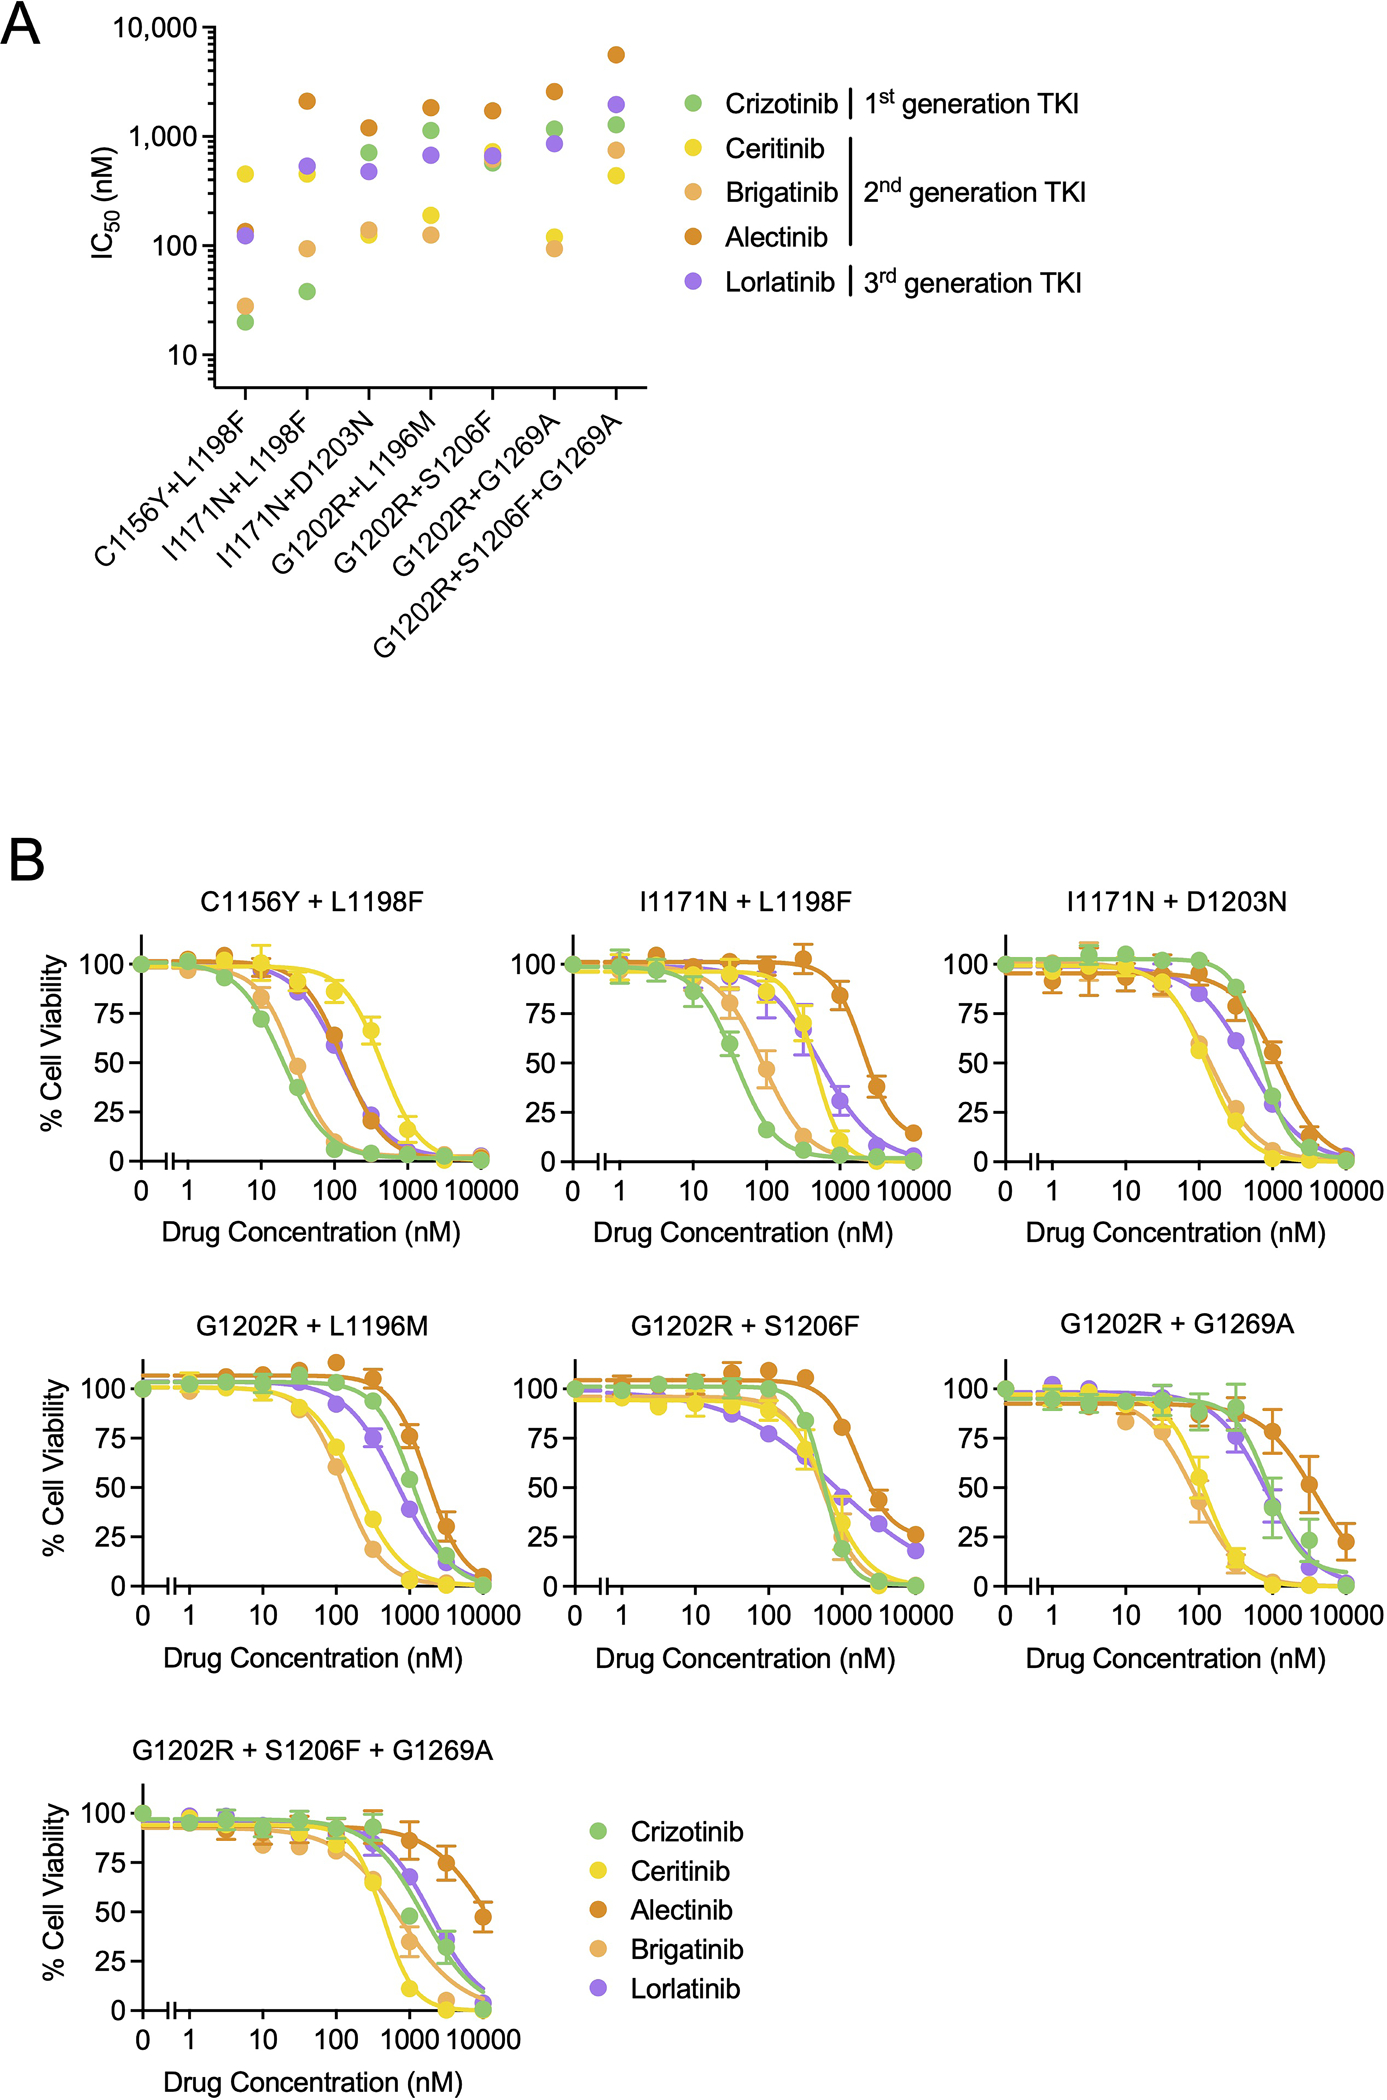
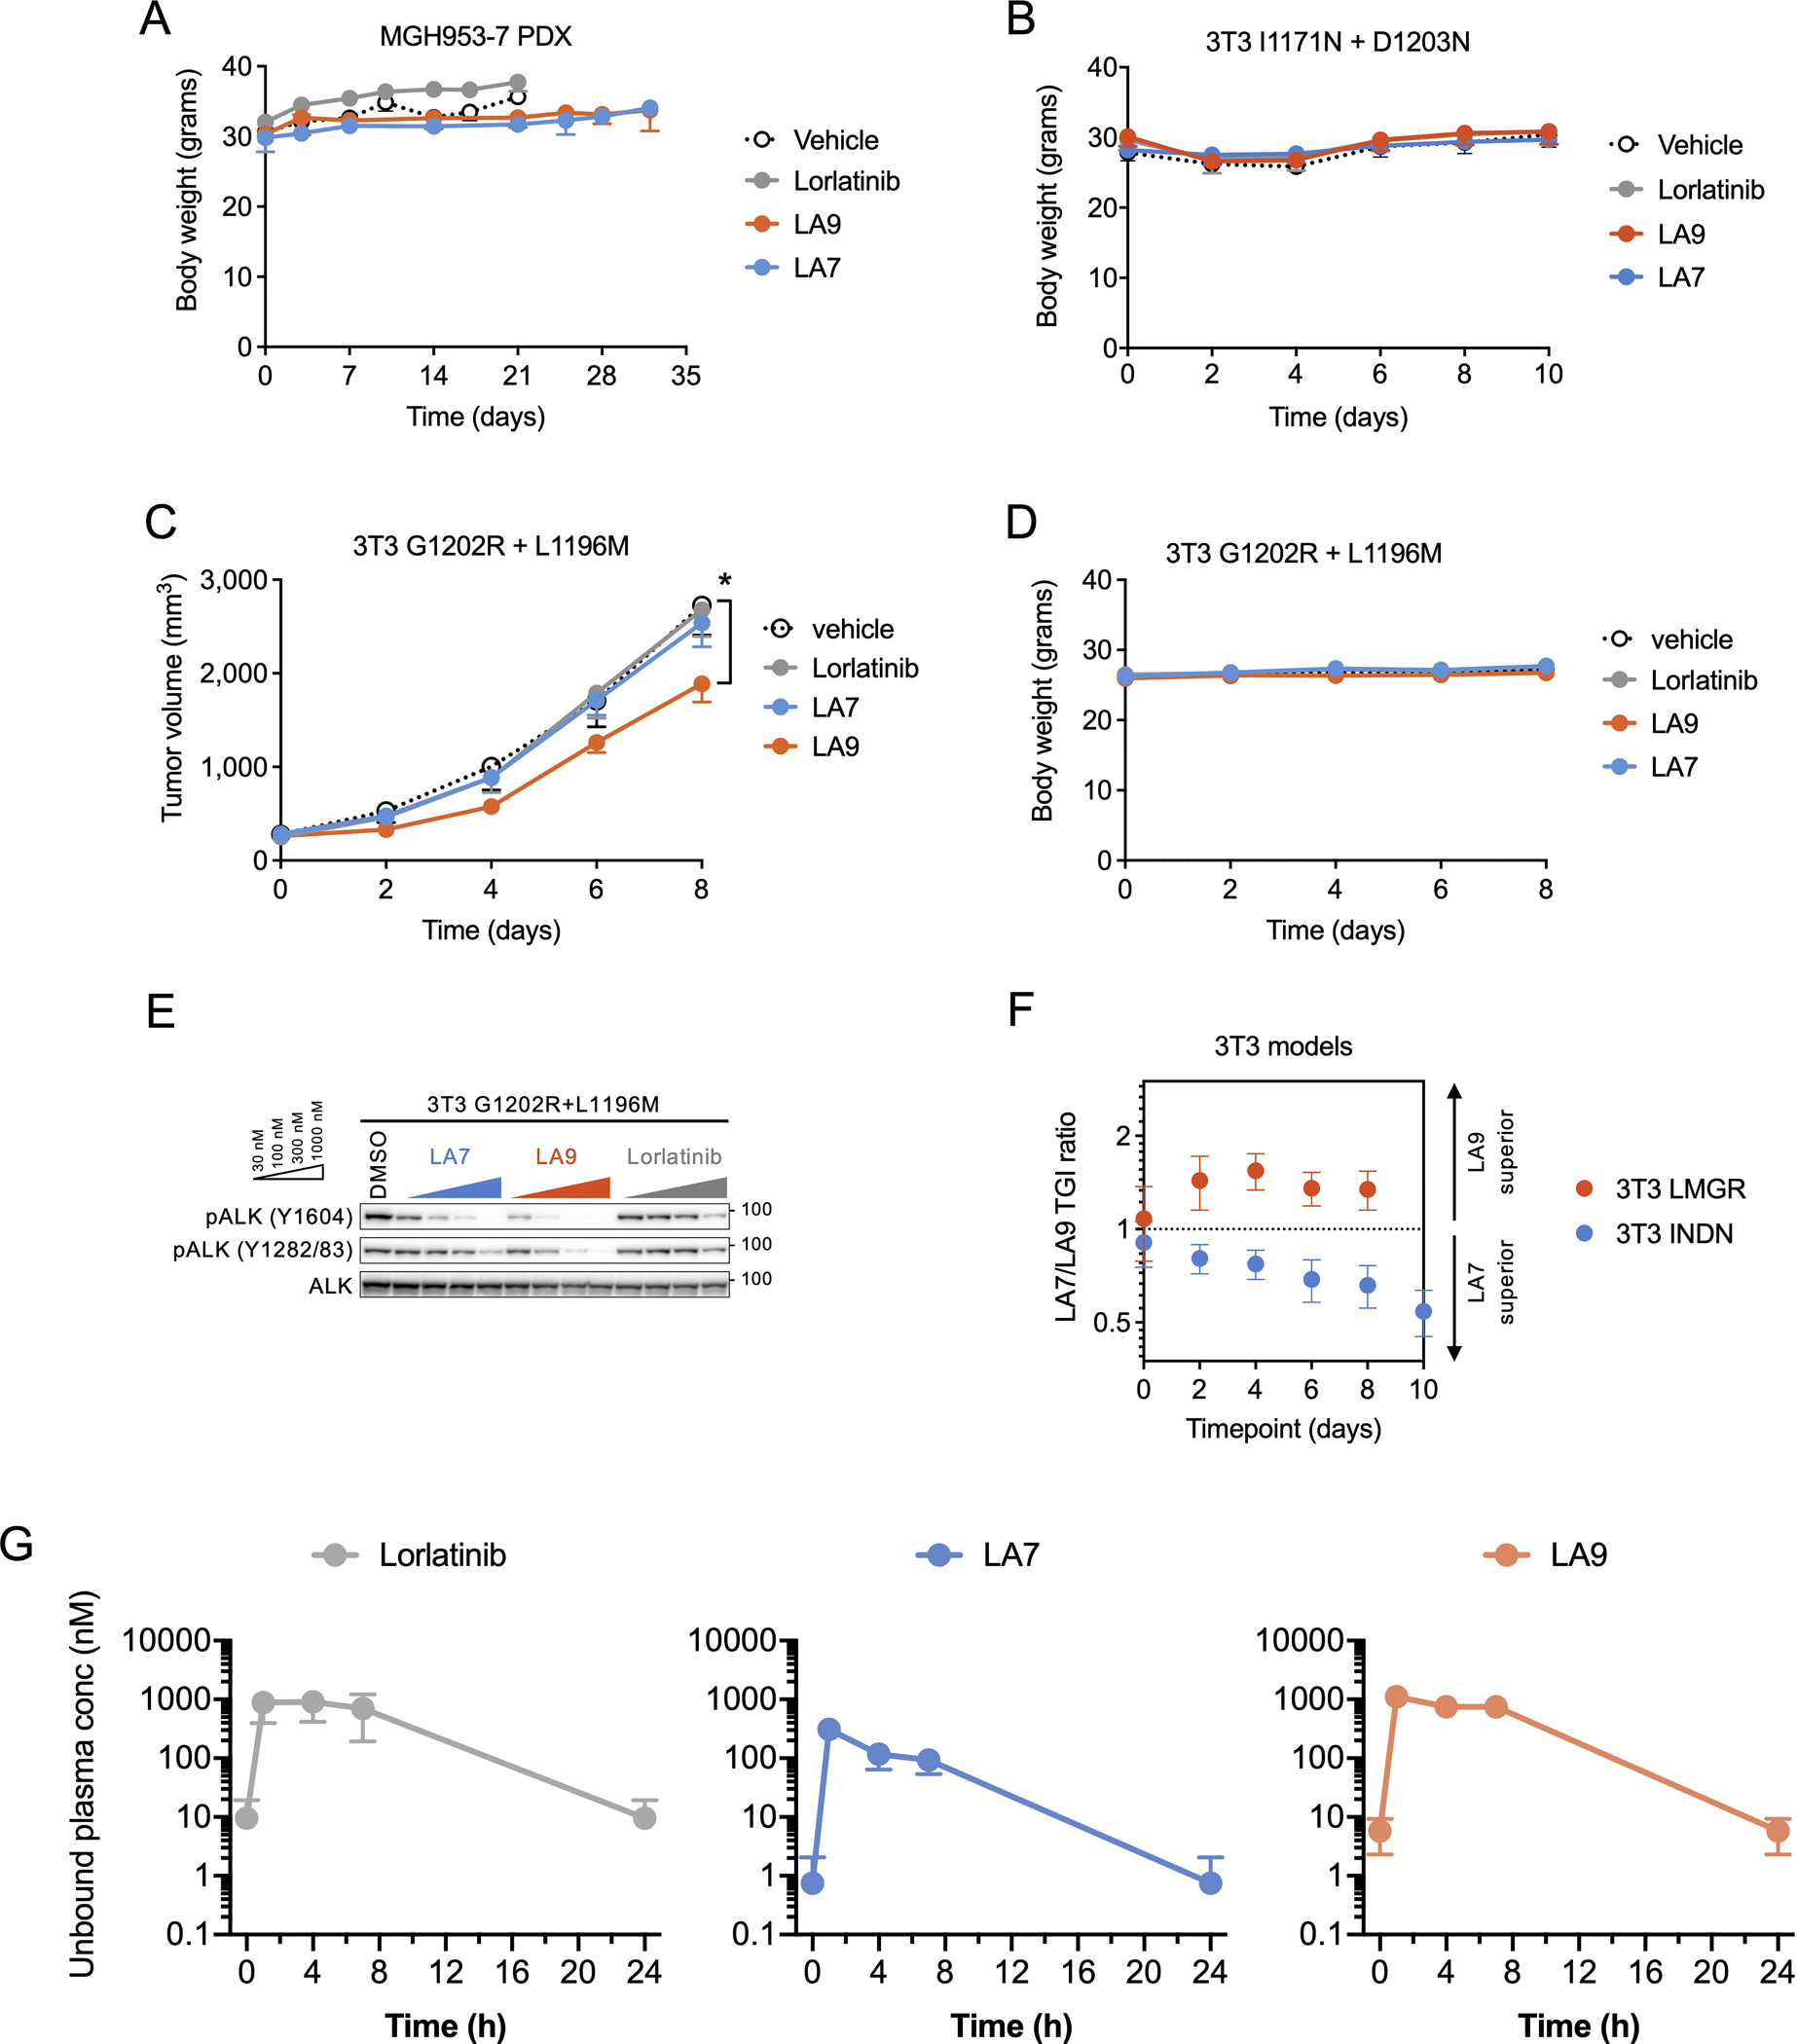
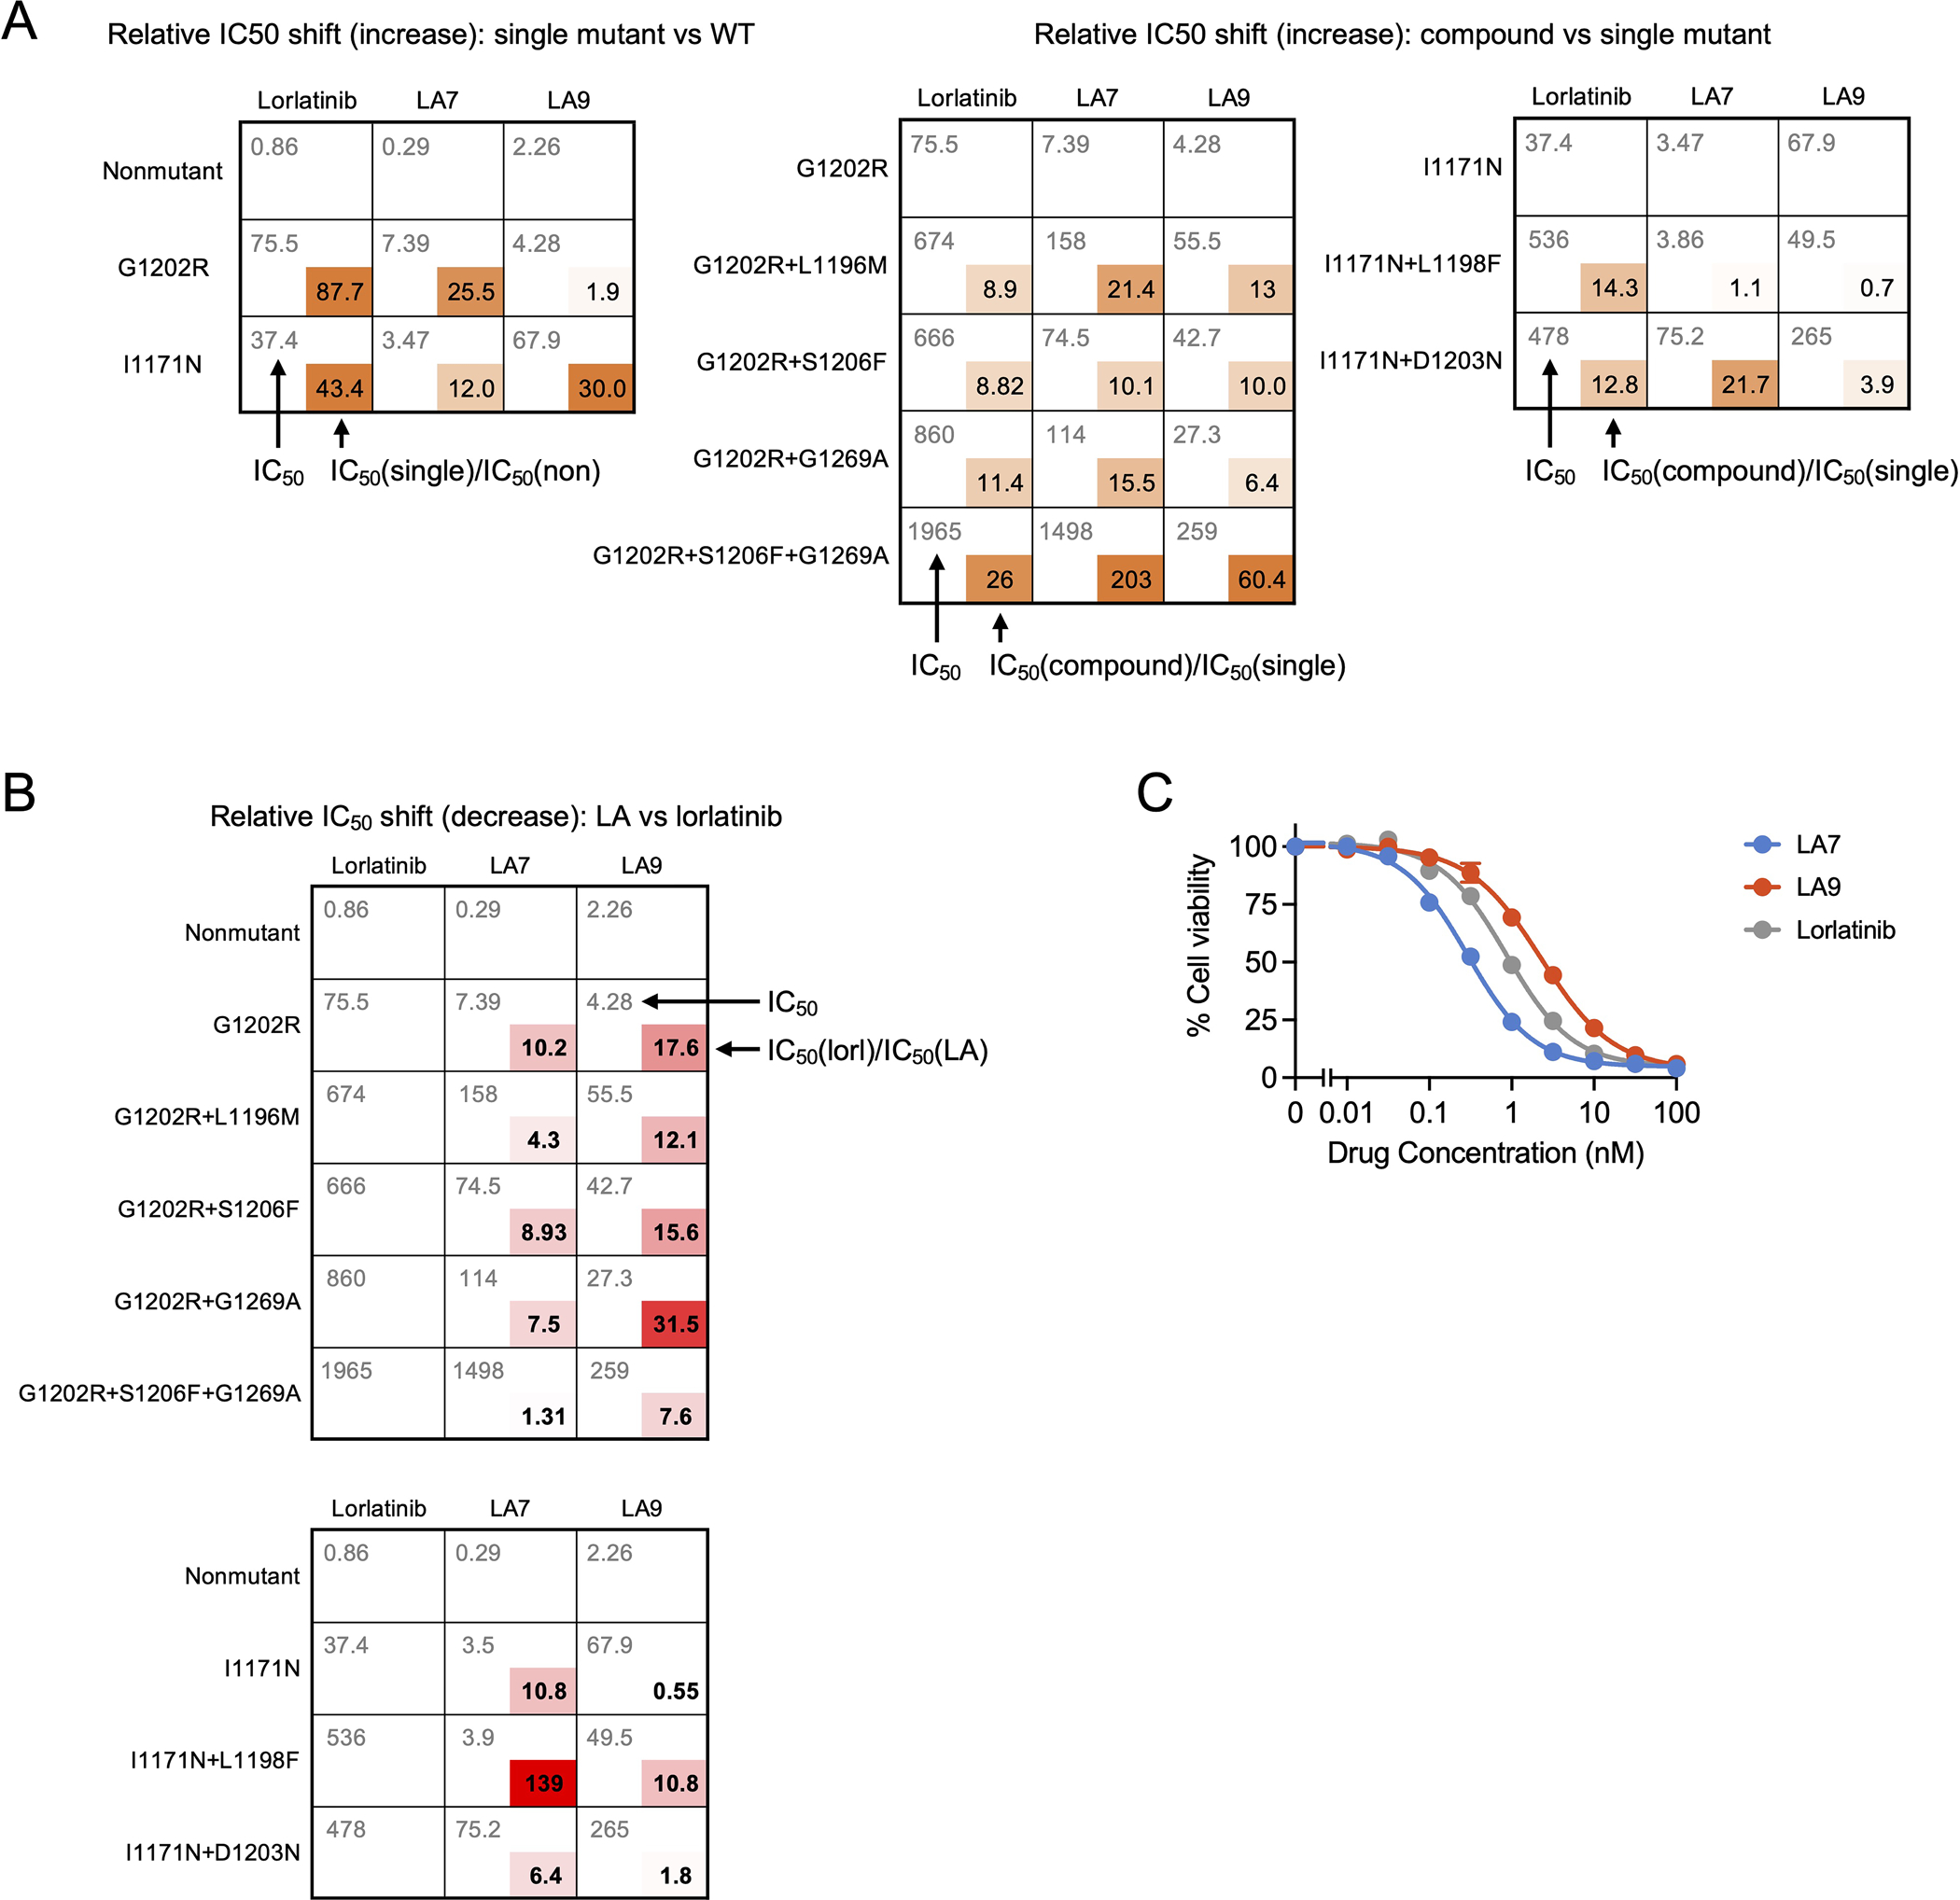
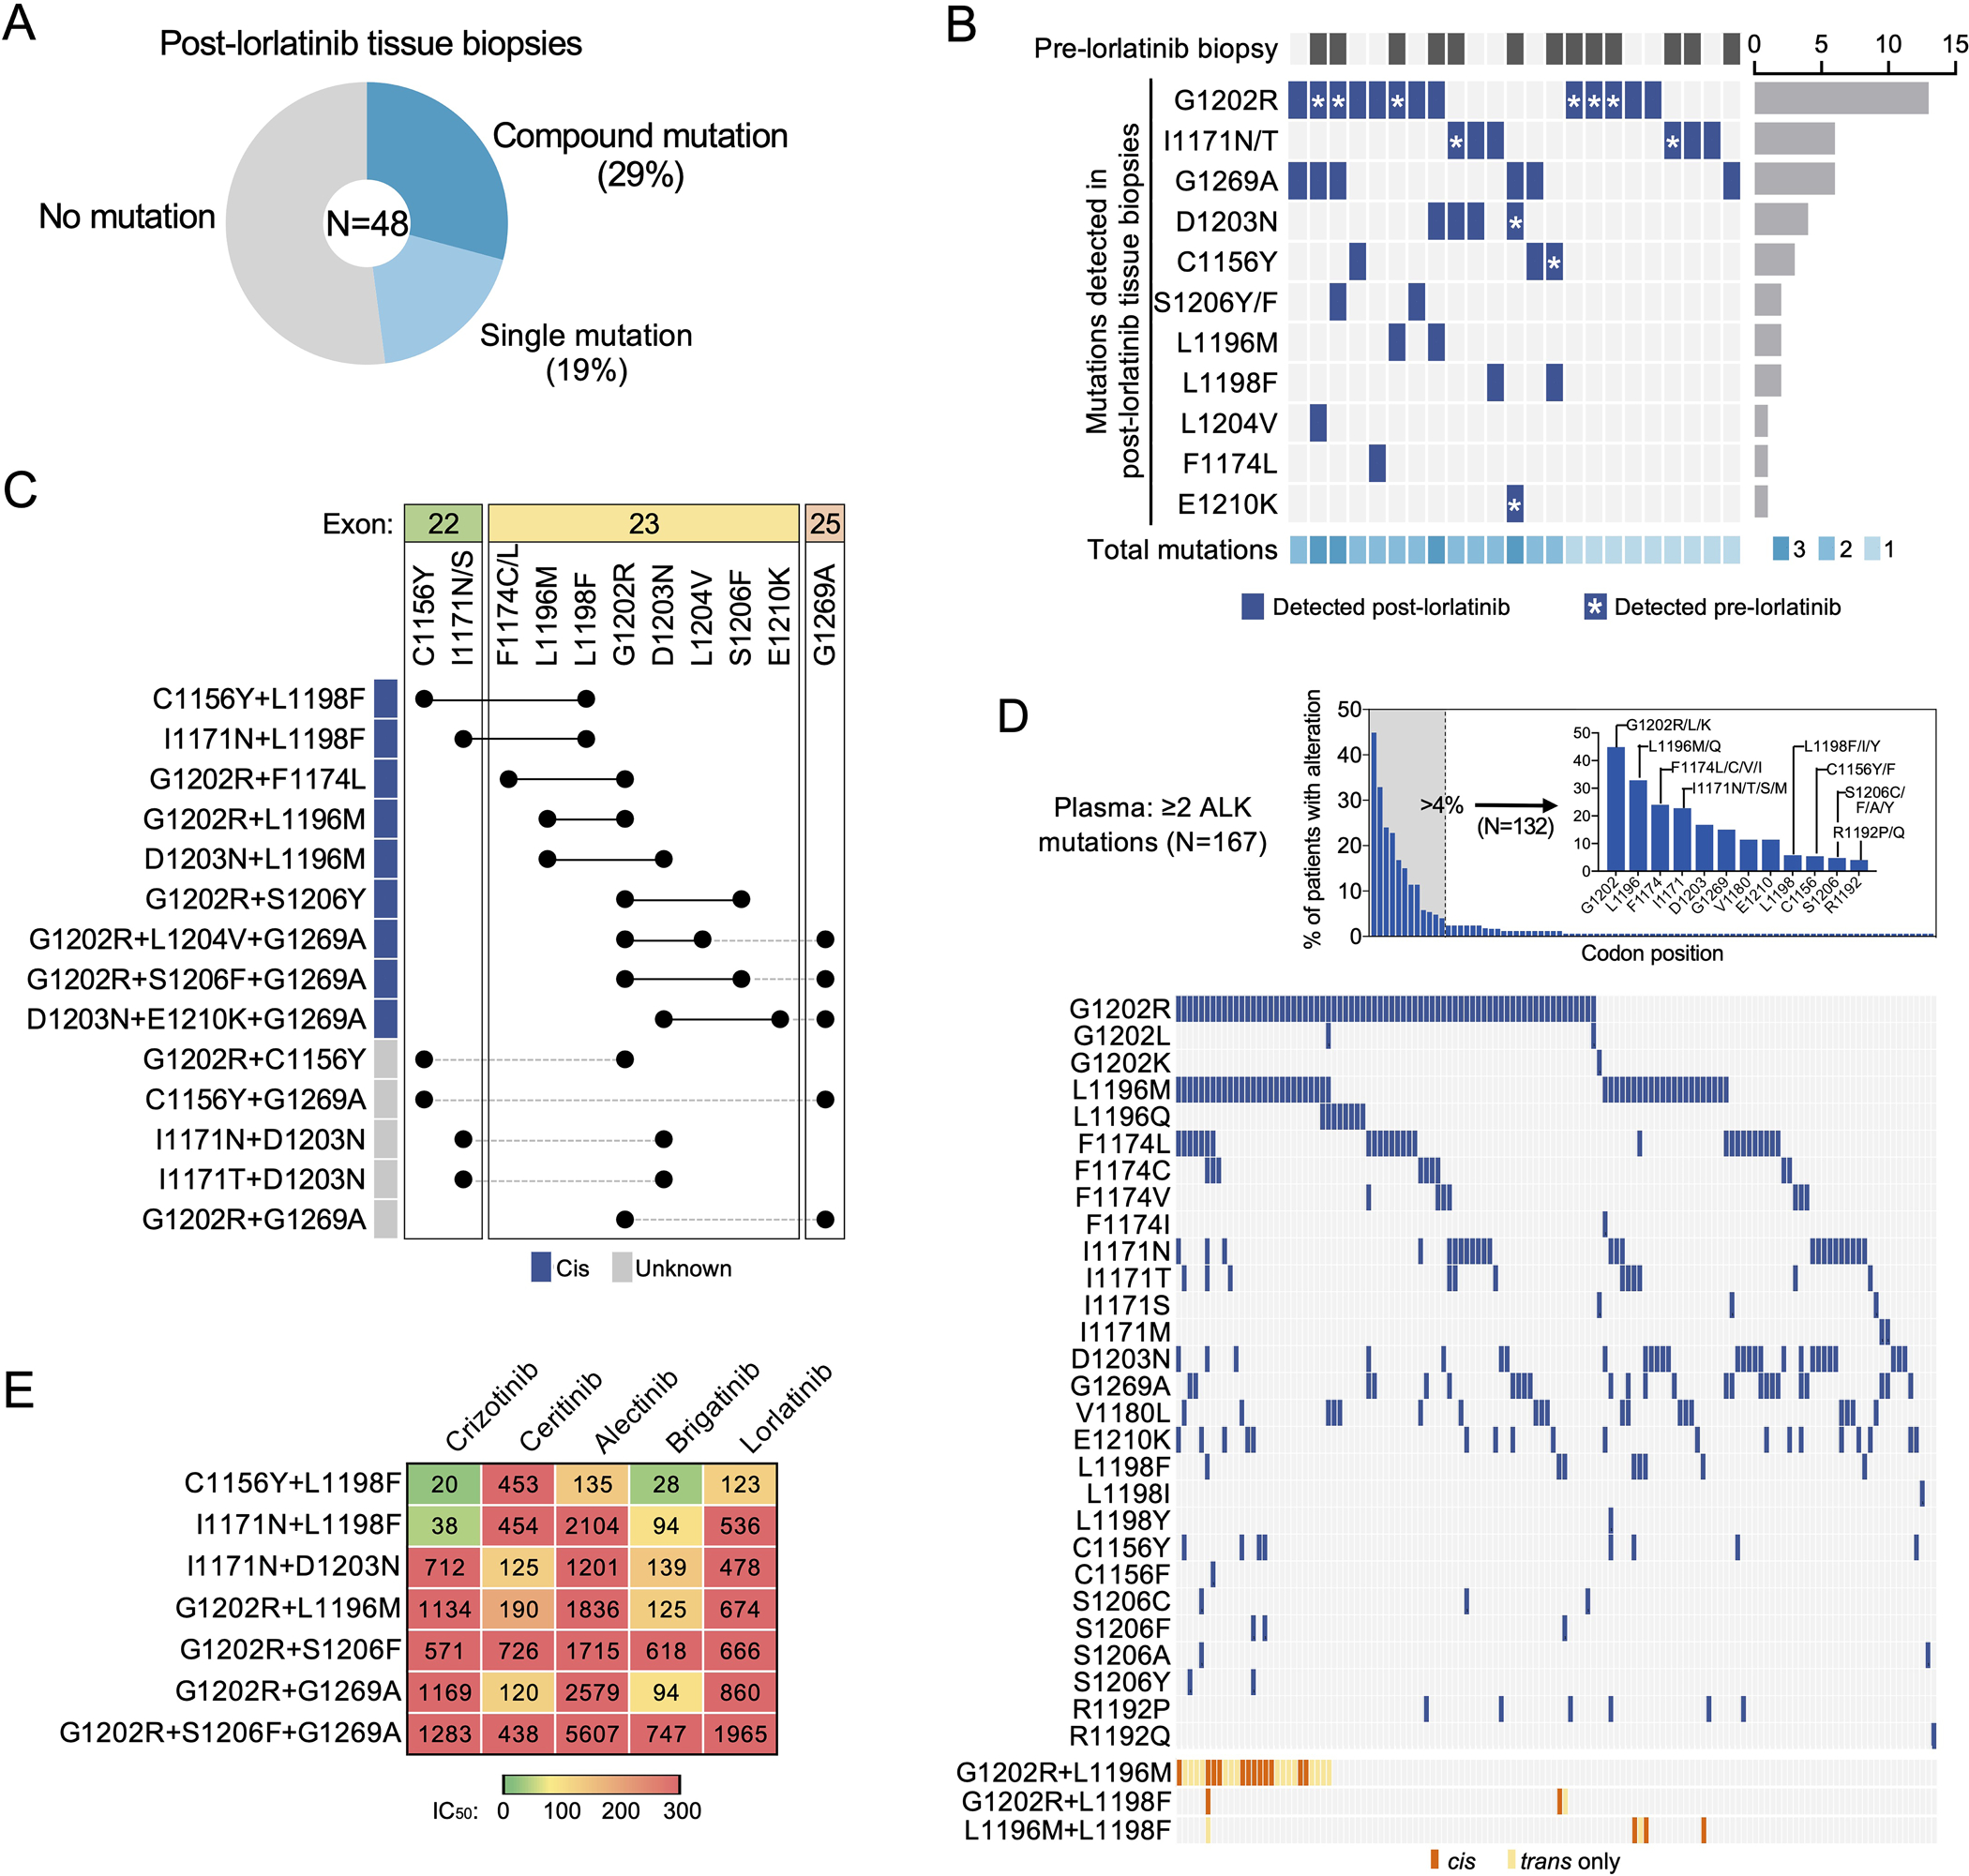
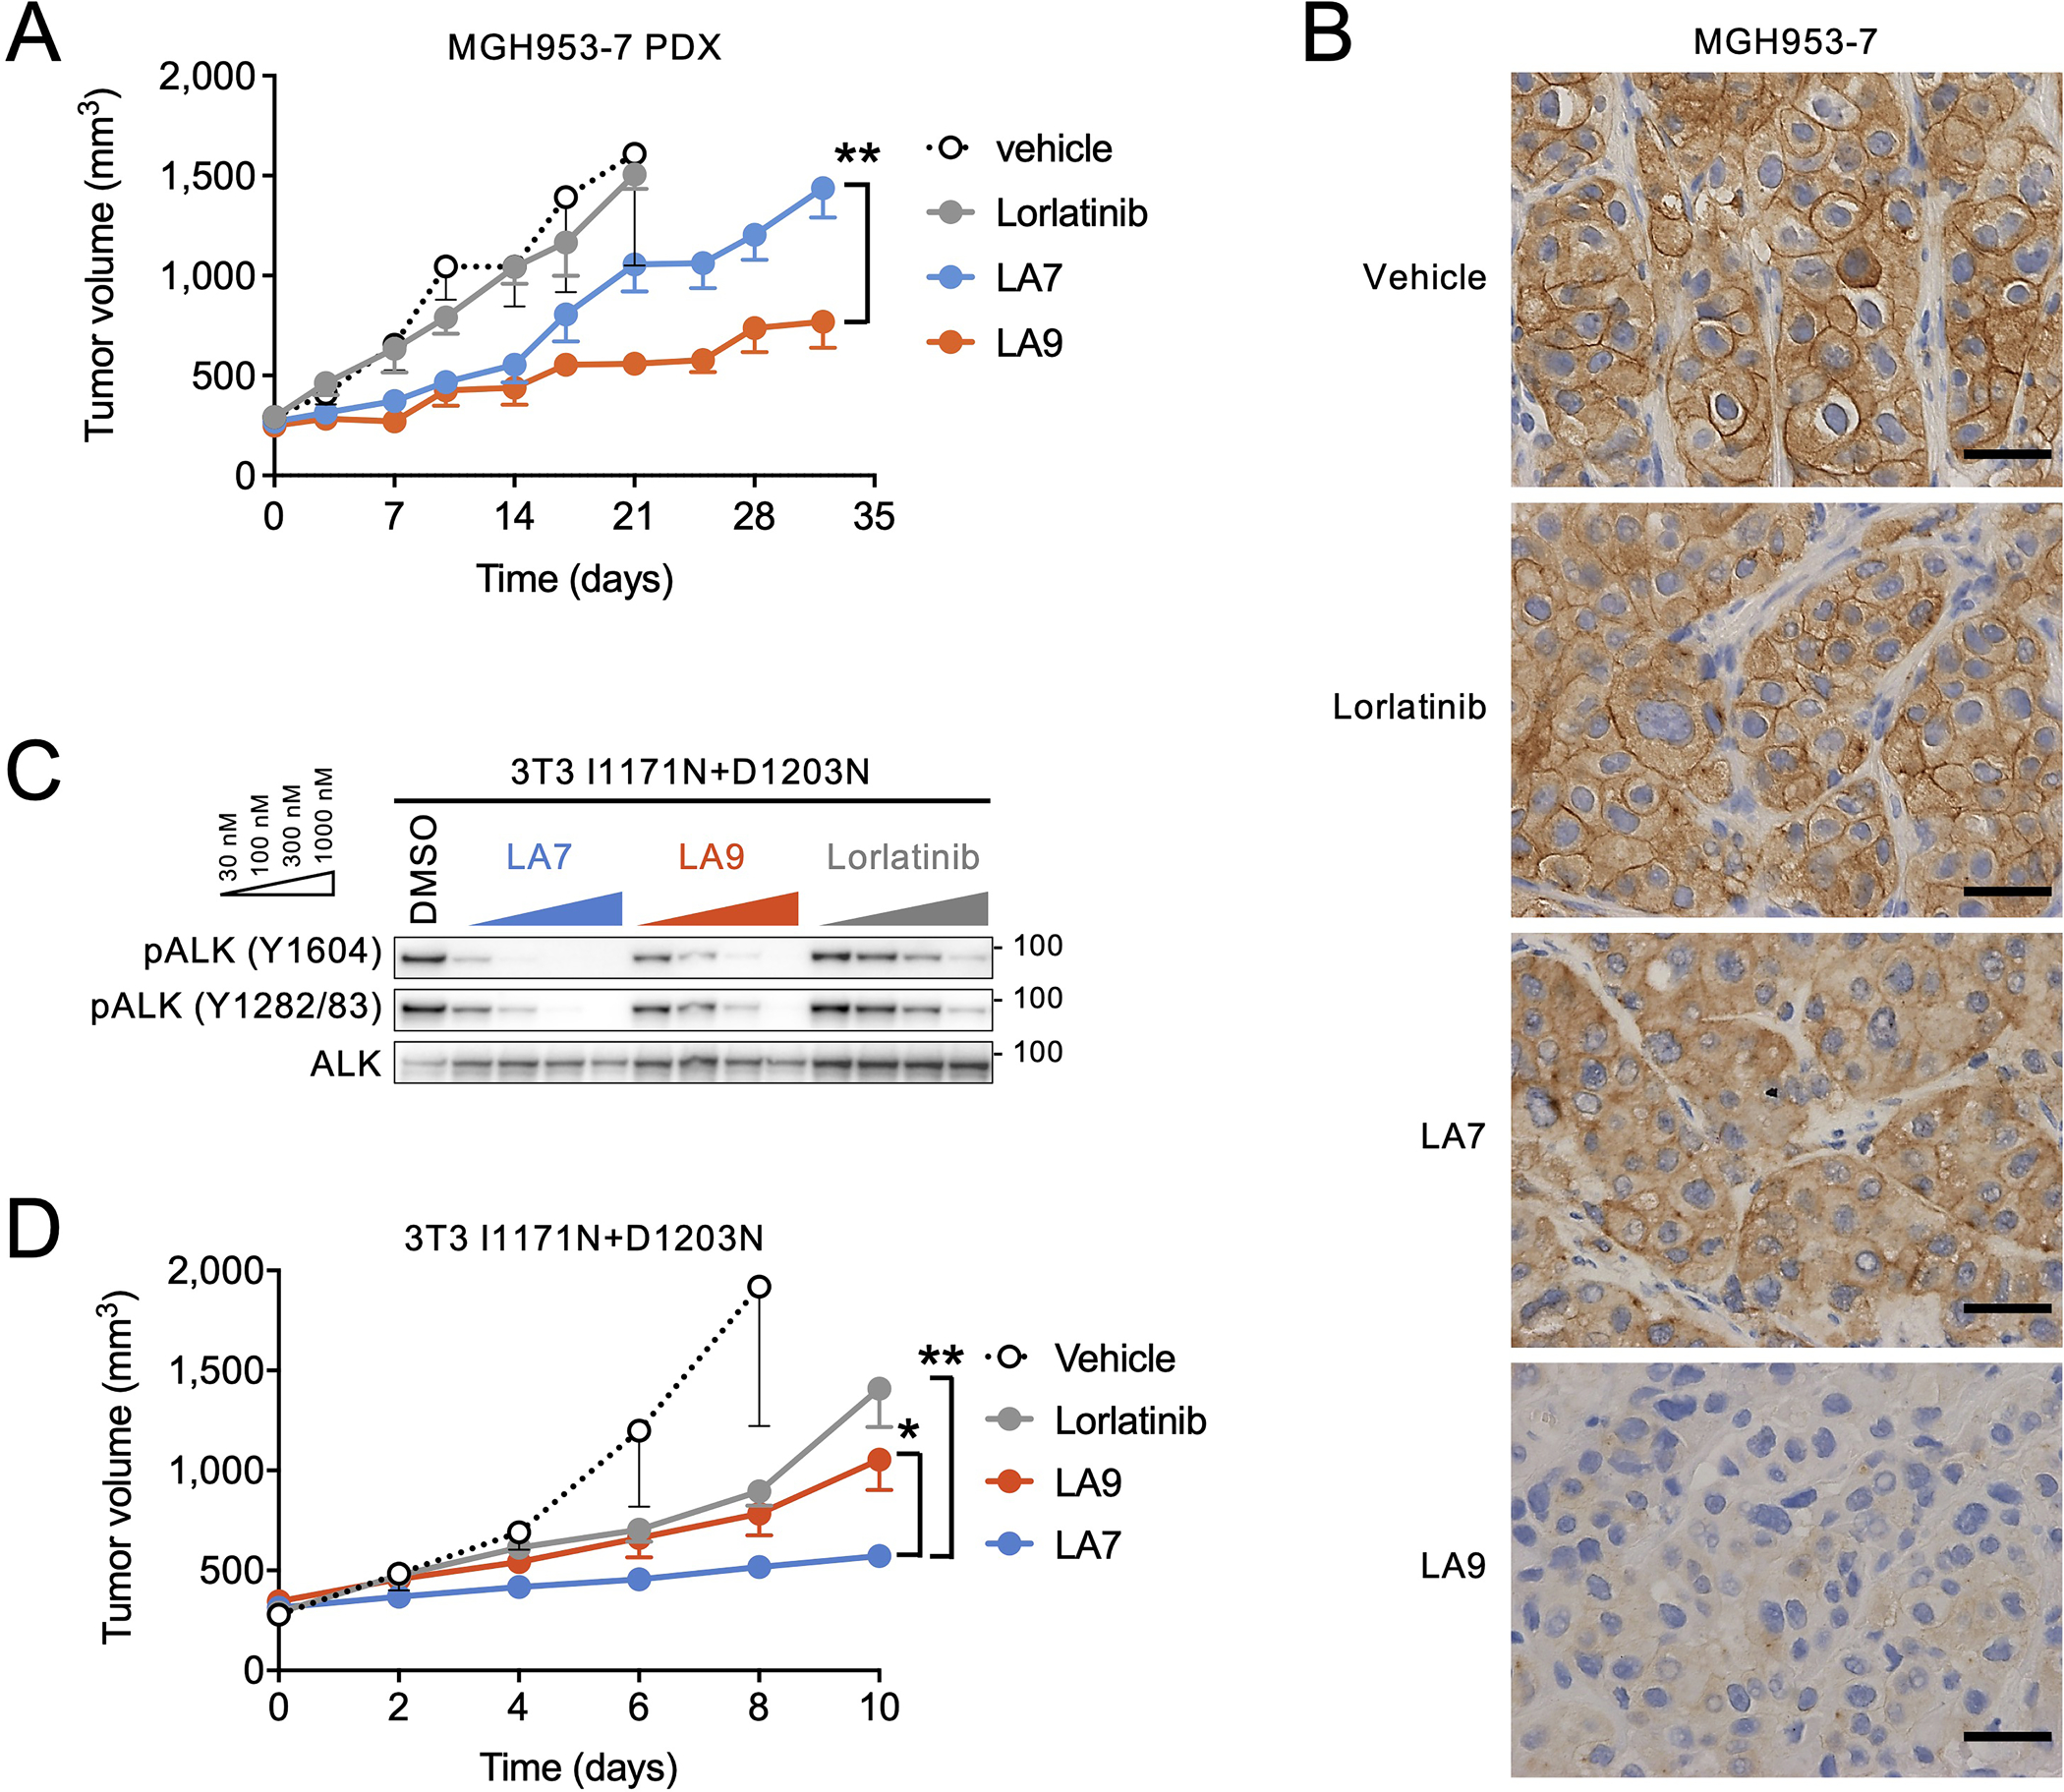
Lorlatinib is currently the most advanced, potent and selective anaplastic lymphoma kinase (ALK) tyrosine kinase inhibitor for the treatment of ALK-positive non-small cell lung cancer in the clinic; however, diverse compound ALK mutations driving therapy resistance emerge. Here, we determine the spectrum of lorlatinib-resistant compound ALK mutations in patients, following treatment with lorlatinib, the majority of which involve ALK G1202R or I1171N/S/T. We further identify structurally diverse lorlatinib analogs that harbor differential selective profiles against G1202R versus I1171N/S/T compound ALK mutations. Structural analysis revealed increased potency against compound mutations through improved inhibition of either G1202R or I1171N/S/T mutant kinases. Overall, we propose a classification of heterogenous ALK compound mutations enabling the development of distinct therapeutic strategies for precision targeting following sequential tyrosine kinase inhibitors.


Conflict of interest statement

COMPETING INTERESTS STATEMENT

TWJ, TRJ, PW, SLW and MAM are employees of Pfizer, Inc. IDJ has received honoraria from Foundation Medicine, Creative Education Concepts, and American Lung Association, consulting fees from Guidepost, AstraZeneca, Boehringer Ingelheim, BostonGene, Catalyst, Novocure, Pfizer, Syros, and Xcovery, research support from Array, Genentech, Novartis, Pfizer, and Guardant Health, and travel support from Array and Pfizer. LAK is an employee and shareholder of Guardant Health. JFG has served as a compensated consultant or received honoraria from Bristol-Myers Squibb, Genentech, Ariad/Takeda, Loxo, Pfizer, Incyte, Novartis, Merck, Agios, Amgen, Jounce, Karyopharm, GlydeBio, Regeneron, Oncorus, Helsinn, Jounce, Array, and Clovis Oncology, has an immediate family member who is an employee with equity in Ironwood Pharmaceuticals, has received research funding from Novartis, Genentech/Roche, and Ariad/Takeda, and institutional research support from Tesaro, Moderna, Blueprint, BMS, Jounce, Array, Adaptimmune, Novartis, Genentech/Roche, Alexo and Merck. JJL has served as a compensated consultant for Genentech, C4 Therapeutics, Blueprint Medicines, Nuvalent, Turning Point Therapeutics, Mirati Therapeutics, Bayer, and Elevation Oncology; received honorarium and travel support from Pfizer; received institutional research funds from Hengrui Therapeutics, Turning Point Therapeutics, Neon Therapeutics, Relay Therapeutics, Bayer, Elevation Oncology, Roche/Genentech, Pfizer, Nuvalent, Linnaeus Therapeutics, and Novartis; received CME funding from OncLive, MedStar Health, and Northwell Health. SY is an employee of Tango Therapeutics and has received a consulting fee from Pfizer Japan and Nuvalent. ANH has received research support from Pfizer, Nuvalent Inc., Roche/Genentech, Amgen, Blueprint Medicines, Eli Lilly, Scorpion Therapeutics, Bristol-Myers Squibb, BridgeBio and Relay Therapeutics; has served as a compensated consultant for Nuvalent, Tolremo Therapeutics, Engine Biosciences and TigaTx. The remaining authors declare no competing interests.

Figures

Extended Data Fig. 1
Extended Data Fig. 1. Clinical outcomes on lorlatinib.
(A) Time to progression on lorlatinib according to presence (N = 13 patients) or absence (N = 8 patients) of a baseline ALK mutation. (B) Time to treatment discontinuation from lorlatinib according to the presence (N = 13 patients) or absence (N = 8 patients) of a baseline ALK mutation. Only those patients with available pre-lorlatinib tissue biopsy and known status of baseline ALK mutations are included in these analyses. Both time to progression and time to treatment discontinuation curves were estimated using the Kaplan-Meier method.
Extended Data Fig. 2
Extended Data Fig. 2. Sensitivity of compound ALK mutations to currently FDA-approved ALK tyrosine kinase inhibitors.
Cellular IC50 values (A) and dose response curves (B) of Ba/F3 cells expressing clinical ALK compound mutations to crizotinib, ceritinib, brigatinib, alectinib, and lorlatinib. Data correspond to the heatmap shown in Fig. 1E. Data are mean and SEM of three independent experiments.
Extended Data Fig. 3
Extended Data Fig. 3. Molecular structures of lorlatinib analogs (LAs) 1–20.
Extended Data Fig. 4
Extended Data Fig. 4. Drug screening with lorlatinib analogs using Ba/F3 ALK mutation models.
(A) Cellular IC50 values of each LA against single ALK mutations (top) and Ba/F3 parental and PC9 cells (bottom). This data corresponds to the heatmap in Fig. 2B (N = 1). When the calculated IC50 exceeded the highest concentration used in the experiment (10μM), the value was plotted as >10000. (B) Cellular IC50 values of 12 selected LAs against clinical ALK compound mutations. This data corresponds to the heatmap in Fig. 2C (N = 1). (C) Cellular IC50 values of 6 selected LAs against an expanded set of clinical and putative compound ALK mutations. This data corresponds to the heatmap in Fig. 2D (N = 1).
Extended Data Fig. 5
Extended Data Fig. 5. Drug dose response curves of lorlatinib analogs against Ba/F3 ALK mutation models.
Cell viability assays performed with Ba/ F3 cells expressing EML4-ALK with the indicated compound mutations treated with 6 LAs or lorlatinib for 48 hours. The viabilities were measured with CellTiter-Glo assay. These data correspond to the heatmap in Fig. 2D and dot plots in Extended Data Fig. 4C. The experiments were performed once.
Extended Data Fig. 6
Extended Data Fig. 6. Distinct activity of LA7 and LA9 in Ba/F3 models and the patient-derived models.
A) Western blot analysis performed on compound mutation Ba/F3 models. Ba/F3 cells expressing nonmutant EML4-ALK, EML4-ALK G1202R + G1269A, G1202R + S1206F + G1269A or I1171N + L1198F were treated with DMSO, LA7, LA9, or lorlatinib for 6 hours, and total cell lysates were analyzed by western blotting. The images are representative of at least two repeats with similar results. (B) Comparison of LA7 and LA9 with currently approved ALK inhibitors. Cellular IC50 values of LA7, LA9 and currently approved ALK inhibitors including lorlatinib against clinical ALK compound mutations. IC50 values for approved ALK inhibitors are replotted from Extended Data Fig. 2A for comparison purposes. Data are mean of three independent experiments. (C) MGH953-4 (G1202R) cells were treated with the indicated drugs for 5 days and cell viability assessed with CellTiter-Glo assay. Data are mean and SEM of three independent experiments. (D) Cellular IC50 values of LA7 and LA9 compared to approved ALK inhibitors in MGH953-4, MGH953-7 (G1202R + L1196M), and MGH990-2 (I1171N + D1203N) cells. Data are mean of three independent experiments. (E) The ratio of cell viability with LA7 or LA9 in MGH953-7 (G1202R + L1196M) at 300 nM or MGH990-2 (I1171N + D1203N) at 100 nM, corresponding to Fig. 4D. Data are mean and SEM of three independent experiments.
Extended Data Fig. 7
Extended Data Fig. 7. In vivo activity of LA7 and LA9.
(A) Body weight of mice bearing MGH953-7 during the course of treatment (N = 6 mice per group). (B) Body weight of mice bearing NIH3T3 EML4-ALK I1171N + D1203N xenograft tumors during the course of treatment (N = 6 per group). (C) Change in tumor volume of NIH3T3 G1202R + L1196M xenograft tumors. Mice were treated with lorlatinib 6 mpk QD, LA7 20 mpk QD, or LA9 40 mpk QD (N = 6 mice per group). Tumors treated with LA9 were significantly smaller on day 8 compared to those with vehicle (p = 0.048, two-tailed t-test). (D) Body weight of mice bearing NIH3T3 EML4-ALK I1171N + D1203N xenograft tumors during the course of treatment (N = 6 mice per group). (E) Western blot analysis of NIH3T3 cells expressing ALK G1202R + L1196M and treated with the indicated drugs for 1 hour. (F) The ratio of tumor growth inhibition (TGI) with LA7 and LA9 in NIH3T3 EML4-ALK I1171N + D1203N or G1202R + L1196M xenograft tumors, corresponding to Fig. 5D and Extended Data Fig. 7C. Error bars indicate SEM for 6 mice per group. (G) Unbound systemic concentrations of lorlatinib, LA7 and LA9 were calculated based on the total drug concentrations in whole blood measured in vivo and the unbound fraction in blood (fu,b; calculated as fu,p / BPR). Data are mean and SEM of three mice.
Extended Data Fig. 8
Extended Data Fig. 8. Phospho-ALK immunohistochemistry of MGH953-7 PDX tumors and control specimens.
(A) MGH953-7 PDX tumors treated with lorlatinib, LA7 or LA9 were harvested after 3-day treatment and FFPE sections were stained with anti-phospho-ALK antibody. Scale bar in low magnification images: 300μm. Scale bar in high magnification images: 50μm. (B) Patient-derived xenografts (PDXs) of two EGFR-mutated NSCLC were used as negative controls and PDXs of two ALK-positive NSCLC were used as positive controls. FFPE sections were stained with anti-phospho-ALK antibody. Phospho-ALK is localized in the cytoplasm and exhibits a diffuse staining pattern in tumor cells. Scale bar in low magnification images: 300μm. Scale bar in high magnification images: 20μm.
Extended Data Fig. 9
Extended Data Fig. 9. Relative changes in IC50 values for lorlatinib, LA7 and LA9 against single and compound ALK mutations.
(A) Lorlatinib, LA7 and LA9 cellular IC50 values (upper left) and IC50 ratios (lower right) of single mutant vs nonmutant ALK (left panel) or compound mutant vs single mutant ALK (middle and right panels). IC50 values correspond to data shown in the Source Data. (B) Fold improvement of LA7 or LA9 compared to lorlatinib against single and compound mutations (calculated by dividing the lorlatinib IC50 by the LA IC50). (C) Cell viability assays performed with Ba/F3 cells expressing nonmutant EML4-ALK with 0.01–100 nM lorlatinib, LA7 or LA9 for 48 hours. The viabilities were measured with CellTiter-Glo assay. Data are mean and SEM of three independent experiments.
Extended Data Fig. 10
Extended Data Fig. 10. Structural basis for selectivity of lorlatinib analogs against ALK compound mutations and the L1198F mutation.
(A) Energy-minimized model of LA9 bound to G1202R/L1196M. Solvent front G1202R and D1203 residues are bolded for emphasis. Productive interactions shown by dotted lines are similar to G1202R single mutant (see Fig. 7B). (B) Co-crystal structure of LA7 bound to wild-type ALK (upper) and energy minimized models of LA7 bound to I1171N (middle) and I1171N/D1203N (bottom) superimposed with energy-minimized model of I1171N (ligand and protein colored pink) showing that the network of hydrogen bonds between thiazole ring hydroxyl groups and solvent front residues are largely preserved. (C) Energy minimized model of LA7 bound to G1202R/L1196M showing disruption of solvent front hydrogen bond network, similar to G1202R single mutant (see Fig. 7D). (D)-(G) The L1198F mutation was modeled onto co-crystal structures of lorlatinib (D), LA7 (E), LA9 (F) or LA4 (G) bound to WT ALK. The L1198F substitution results in steric clash with the selectivity nitrile of lorlatinib. LA7 and LA9 lack the selectivity nitrile and can easily accommodate the L1198F substitution, whereas the nitrile of LA4 is positioned toward L1198F but exhibits reduced steric clash compared to lorlatinib due to the more flexible ligand structure. (H) Relative fold potency decrease of LA4 compared with LA7 (calculated by dividing the cellular IC50 values of LA4 by the that of LA7) against Ba/F3 models harboring compound ALK mutants. IC50 values correspond to data shown in the Source Data. (I) Superimposition of LA7 onto the LA4/L1198F model shown in Panel G comparing the position of the corresponding thiazole methyl or nitrile groups near L1198F.
Figure 1.
Figure 1.. Spectrum of compound ALK mutations identified in lorlatinib-resistant biopsies.
(A) The frequencies of compound, single, vs no ALK mutation detected in lorlatinib-resistant tissue biopsies (N = 48 biopsies). (B) Heatmap demonstrating the distribution of ALK mutations (dark blue) detected in post-lorlatinib tissue biopsies with at least one ALK mutation. Those cases with paired pre-lorlatinib biopsy available are indicated by dark gray (top row). The total number of ALK mutations identified are shown by shades of cyan (bottom row). Asterisk indicates the ALK mutation was present at baseline (i.e., detected in pre-lorlatinib biopsy). (C) Configuration (cis vs trans) of ALK mutations in tissue biopsies harboring ≥2 ALK mutations. (D) ALK mutations in an independent cohort of de-identified ALK TKI-resistant plasma samples harboring ≥2 ALK mutations (N = 194 plasma specimens). Top panel shows frequency of alterations per codon position. Bottom panel shows co-occurrence of individual mutations at positions altered in greater than 4% of patients. Co-occurring mutations involving closely spaced L1196, L1198 and G1202 positions could be assessed for cis (orange) versus trans (yellow) configuration. (E) Cellular IC50 values of FDA-approved ALK TKIs against clinical compound ALK mutations. Data are mean of three independent experiments.
Figure 2.
Figure 2.. Drug screening of Ba/F3 ALK mutation models identifies lorlatinib analogs with increased potency against compound ALK mutations.
(A) The schema summarizes the 3-step functional screening of 20 lorlatinib analogs (LAs). (B) Heatmap of cellular IC50 values of each LA against single ALK mutations (top) and parental Ba/F3 and PC9 cells (bottom). Asterisks indicate the 12 LAs selected for further assessment. (C) Potency of 12 LAs against clinical ALK compound mutations. Asterisks indicate the 6 LAs selected for additional validation. (D) Potency of 6 LAs against an expanded set of clinical and putative compound ALK mutations. Relative mutation positions within the ALK kinase domain are shown. Red, ALK G1202R; blue, ALK I1171N/S.
Figure 3.
Figure 3.. Selectivity of LA7 and LA9 against I1171N and G1202R single and compound mutants, respectively.
(A) Relative selectivity of LA7 and LA9 for single ALK mutants, calculated by the ratio IC50(LA7)/IC50(LA9). (B)-(C) Comparison of relative fold increase in potency of LA7 vs LA9 (over lorlatinib) against single and compound ALK mutants. LA9 has a greater increase in potency relative to lorlatinib against G1202R single and compound mutations compared to LA7 (B). Conversely, LA7 has greater increase in potency relative to lorlatinib against I1171N single and compound mutations compared to LA9 (C). (D) Selectivity of LA7 and LA9 against Ba/F3 models harboring G1202R (G1202R+L1198F, G1202R+L1196M, G1202R+S1206F, G1202R+G1269A, G1202R+S1206F+G1269A), I1171N/S (I1171S+L1198F, I1171N+L1198F, I1171N+D1203N, I1171N+C1156Y, I1171S+C1156Y), or other compound ALK mutations (F1174C+D1203N, D1203N+E1210K, C1156Y+L1198F, F1174C+L1198F, L1196M+L1198F, L1198F+G1269A) calculated by the ratio IC50(LA7)/IC50(LA9). Circles indicate clinical mutations, and diamonds indicate putative mutations. (E) Western blot analysis performed in Ba/F3 cells expressing ALK G1202R+L1196M or ALK I1171N+D1203N after treatment with DMSO, LA7, LA9, or lorlatinib for 6 hours. The images shown are representative of at least two repeats with similar results.
Figure 4.
Figure 4.. Differential selectivity of LA7 and LA9 in patient-derived ALK-positive NSCLC cell lines.
(A) MGH953-7 (G1202R+L1196M) and MGH990-2 (I1171N+D1203N) patient-derived cell lines treated with the indicated drugs for 5 days, with viability measured using CellTiter-Glo assay. Data are mean and SEM of three independent experiments. The treatment histories of the MGH953 and MGH990 patients are summarized (top left), and cellular IC50 values in MGH953-7, MGH990-2, and MGH953-4 (G1202R) are shown (top right). (B) Selectivity of LA7 and LA9 against patient-derived and Ba/F3 models harboring I1171N vs G1202R mutations, respectively. (C) Western blot analysis performed in MGH990-2 and MGH953-7 cells after treatment with indicated drugs for 6 hours. The images shown are representative of at least two repeats with similar results. (D) Cell growth of MGH953-7 and MGH990-2 cells treated with the indicated drugs for 14 days. 300 nM of each drug was used for MGH953-7 and 100 nM of each drug was used for MGH990-2. Data are mean and SEM of three independent experiments.
Figure 5.
Figure 5.. LA7 and LA9 inhibit tumor growth in xenograft tumors bearing ALK compound mutations.
(A) Change in tumor volume of MGH953-7 (G1202R+L1196M) PDX tumors. Mice were treated with vehicle (N = 6 mice), lorlatinib 6 mpk QD (N = 5 mice), LA7 20 mpk QD (N = 6 mice), or LA9 40 mpk QD (N = 6 mice), 5 days per week. Tumor sizes on day 32 were significantly different between LA7 and LA9 (p=0.0076, two-tailed t test). Error bars indicate SEM. (B) Immunohistochemistry for pALK performed on MGH953-7 xenograft tumors harvested after 3-day treatment with the indicated drugs. The experiments were performed once after antibody validation. The images are representative of three tumors in each treatment group shown in Extended Data Fig. 8A. (C) Western blot analysis of NIH3T3 cells expressing ALK I1171N+D1203N and treated with the indicated drugs for 1 hour. The images shown are representative of at least two repeats with similar results. (D) Change in tumor volume of NIH3T3 I1171N+D1203N xenograft tumors. Mice were treated with lorlatinib 6 mpk QD, LA7 20 mpk QD, or LA9 40 mpk QD (N = 6 mice per group). Tumors treated with LA7 were significantly smaller on day 10 compared to those treated with LA9 (p=0.0133) or lorlatinib (p=0.0018, two-tailed t test). Error bars indicate SEM.
Fig. 6.
Fig. 6.. Cellular IC50 changes with single and compound ALK mutations.
(A)-(B) Comparison of absolute and fold shift in cellular IC50 values for nonmutant, single and compound ALK mutants (corresponding to data shown in Extended Data Fig. 9A). G1202R (A) and I1171N (B) single point mutations result in large shift in IC50 for lorlatinib; however, this remains within range of clinical exposure (<200nM, indicated by dashed line). Compound mutations result in comparable fold shift in IC50 values of lorlatinib, LA7 and LA9 relative to single mutations; however, the improved potency of LA7 and LA9 against single mutations results in substantial improvement in IC50 against compound mutations. (C)-(D) Fold improvement of LA7 (C) or LA9 (D) compared to lorlatinib against single and compound mutations (calculated by dividing the lorlatinib IC50 by the LA IC50, corresponding to data shown in Extended Data Fig. 9B).
Figure 7.
Figure 7.. Structural basis for selectivity of LA7 and LA9 against ALK compound mutations.
(A) Co-crystal structures of lorlatinib (4CLI, 2.05 Å), LA7 (7R7R, 1.93 Å) and LA9 (7R7K, 1.83 Å) in the wild-type (WT) ALK kinase domain. Left panels highlight residues mutated in resistant patients. Right panels show structure of the ligand binding pocket. (B) Co-crystal structure of LA9 bound to WT ALK (ligand and protein colored gray) superimposed with energy-minimized model of G1202R (ligand and protein colored blue). Solvent front G1202/G1202R and D1203 residues are bolded for emphasis. Productive interactions between both LA9/WT and LA9/G1202R are shown by dotted lines, including a novel interaction between G1202R side chain –NH2 and the lactam carbonyl of LA9 (distances are reported in Angstroms; red spheres represent structural water molecules). Note the minimal movement of both ligand (LA9) and protein (G1202R) relative to LA9/WT co-crystal structure. (C) Co-crystal structure of LA7 bound to WT ALK (ligand and protein colored gray) superimposed with energy-minimized model of I1171N (ligand and protein colored pink), highlighting nearly identical productive interactions, including a novel network of hydrogen bonds between thiazole ring hydroxyl groups and solvent front residues (1201–1203, bolded). Distances are I1171N (bold) and WT (in parentheses). (D) Co-crystal structure of LA7 in WT ALK (ligand and protein colored gray) superimposed with energy-minimized model of G1202R (ligand and protein colored blue) showing significant movement of both ligand and protein relative to LA7/WT co-crystal structure. This movement disrupts key protein ligand interactions, including the two hydroxyl groups with G1201 and G1203 shown in panel D. Distances of LA7/G1202R interactions are shown. (E) Overlap of binding modes of lorlatinib, LA7 and LA9 (in WT ALK) revealing orientation of key structural features conferring mutant selectivity.

Comment in

References

    1. Soda M et al. , Identification of the transforming EML4-ALK fusion gene in non-small-cell lung cancer. Nature 448, 561–566 (2007). - PubMed
    1. Shaw AT et al. , Clinical features and outcome of patients with non-small-cell lung cancer who harbor EML4-ALK. Journal of clinical oncology : official journal of the American Society of Clinical Oncology 27, 4247–4253 (2009). - PMC - PubMed
    1. Jordan EJ et al. , Prospective Comprehensive Molecular Characterization of Lung Adenocarcinomas for Efficient Patient Matching to Approved and Emerging Therapies. Cancer discovery 7, 596–609 (2017). - PMC - PubMed
    1. Kwak EL et al. , Anaplastic lymphoma kinase inhibition in non-small-cell lung cancer. The New England journal of medicine 363, 1693–1703 (2010). - PMC - PubMed
    1. Solomon BJM, T.; Kim D; Wu Y; Nakagawa K; Mekhail T; Felip E; Cappuzzo F; Paolini J; Usari T; Iyer S; Reisman A; Wilner KD; Tursi J; Blackhall F, First-Line Crizotinib versus Chemotherapy in ALK-Positive Lung Cancer. N Engl J Med 373, 1582 (2015). - PubMed

Publication types