. 2022 Jul;54(7):985-995.
doi: 10.1038/s41588-022-01088-x. Epub 2022 Jun 20.

Single-cell analyses define a continuum of cell state and composition changes in the malignant transformation of polyps to colorectal cancer

Affiliations

Single-cell analyses define a continuum of cell state and composition changes in the malignant transformation of polyps to colorectal cancer

Winston R Becker et al. Nat Genet. 2022 Jul.

Abstract

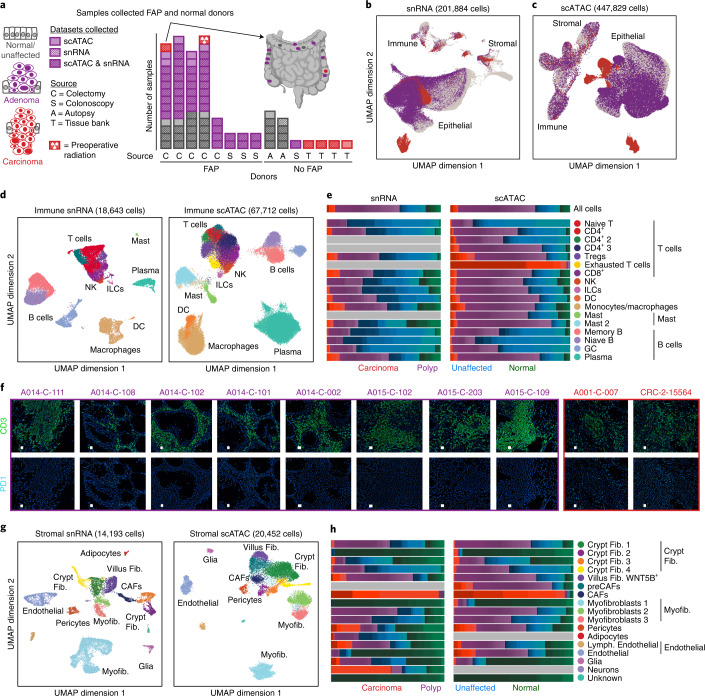
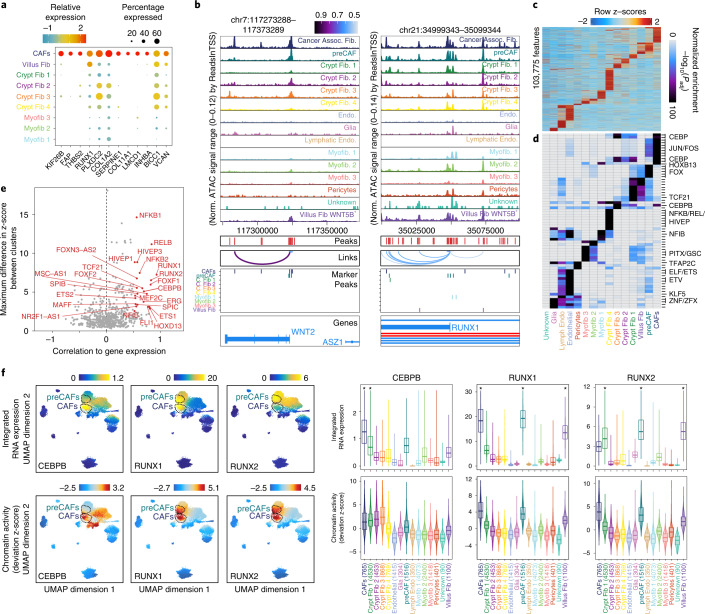
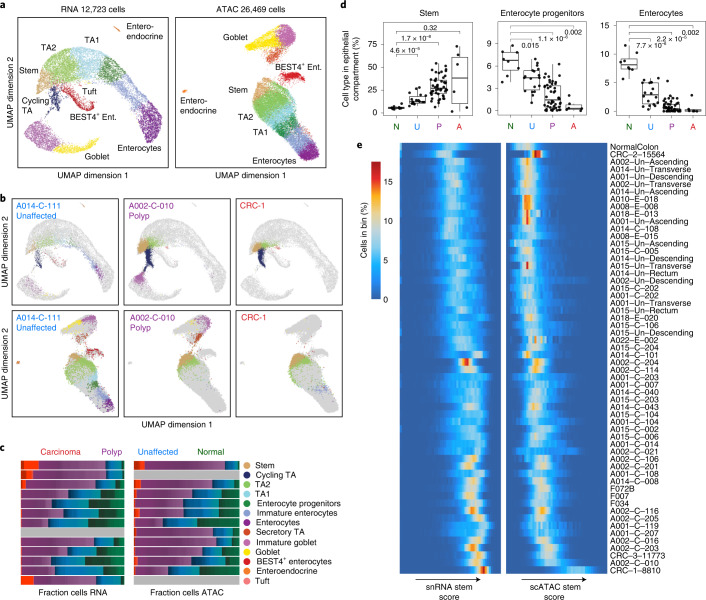
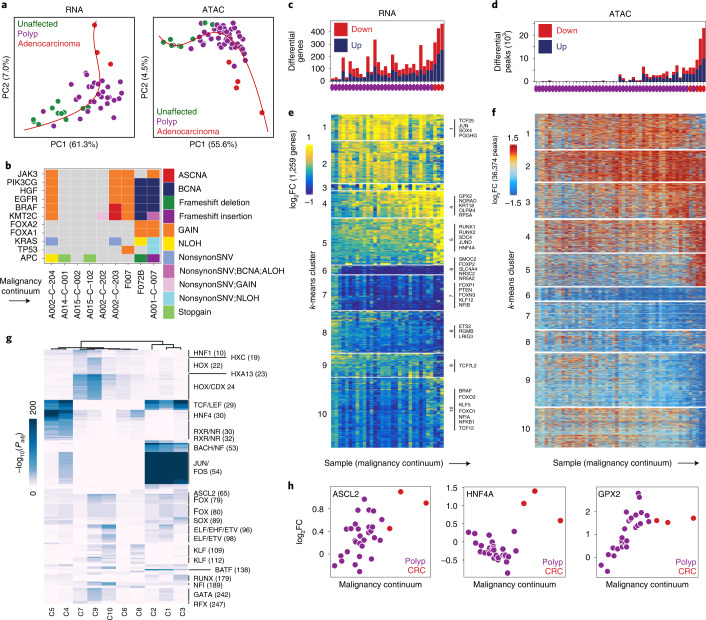
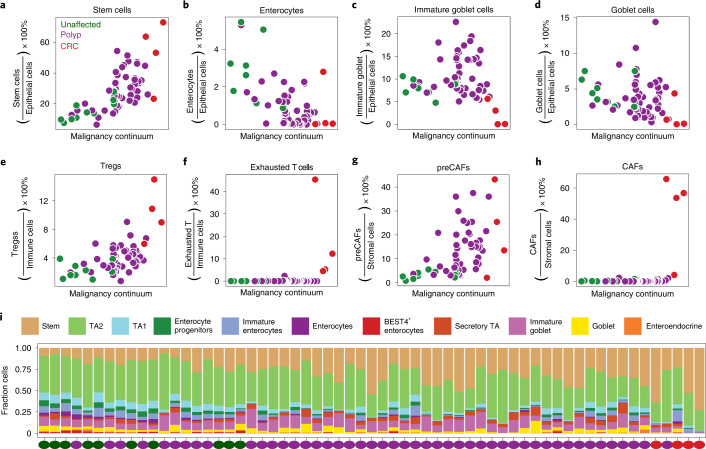
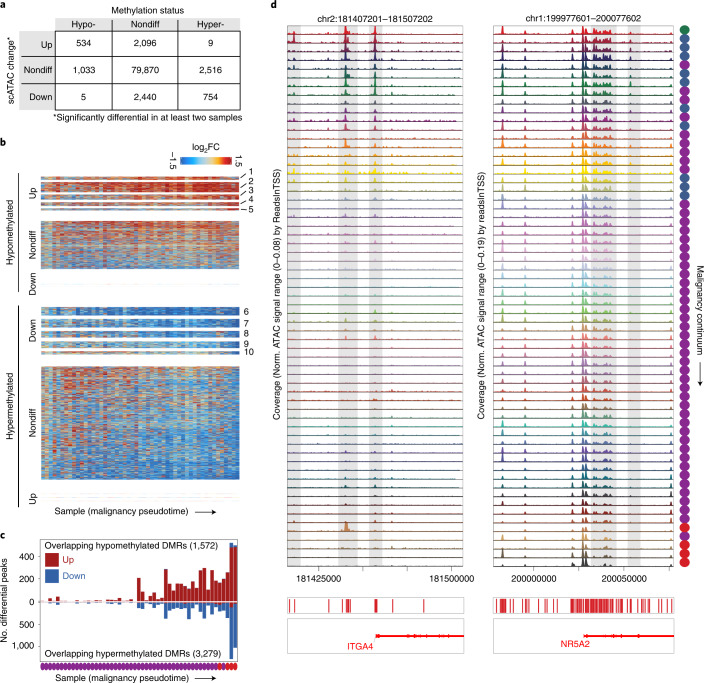
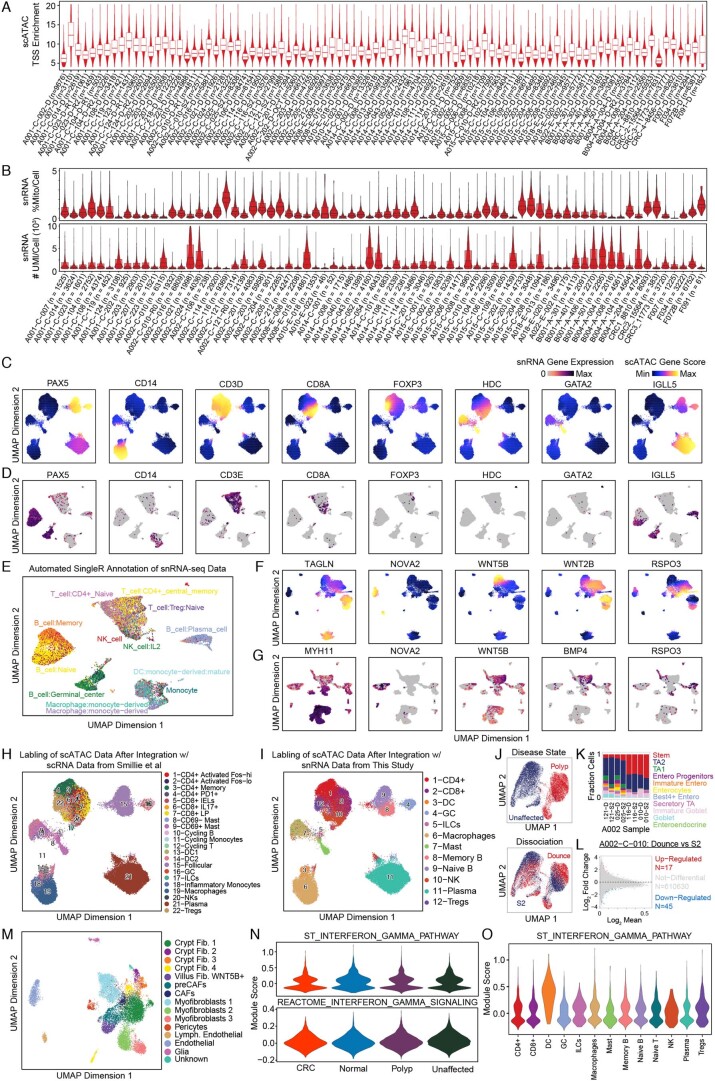
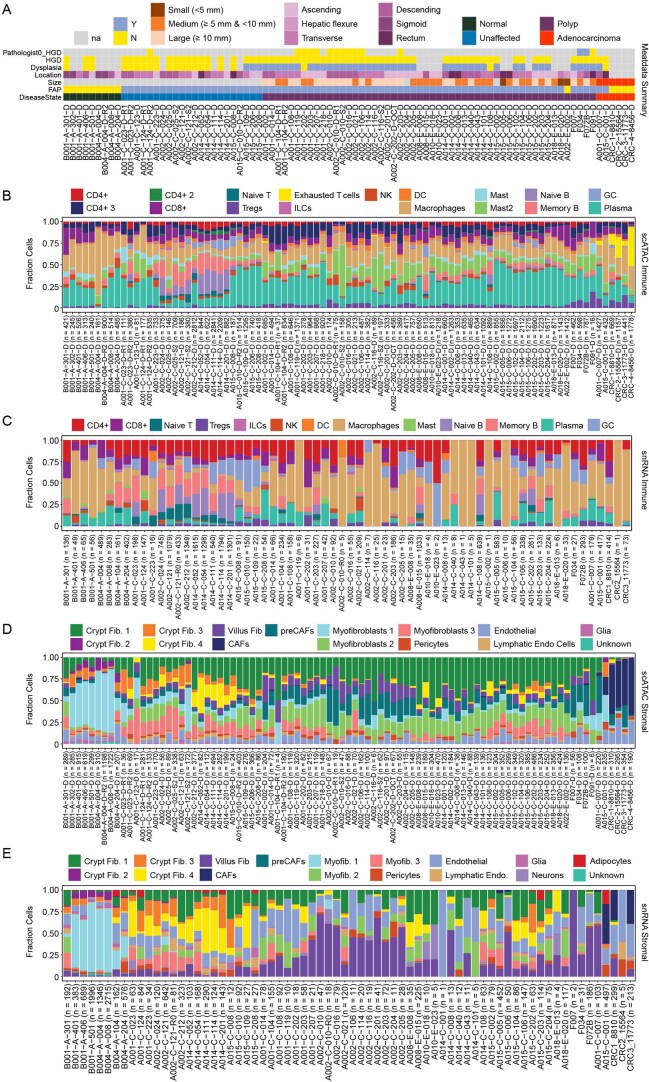
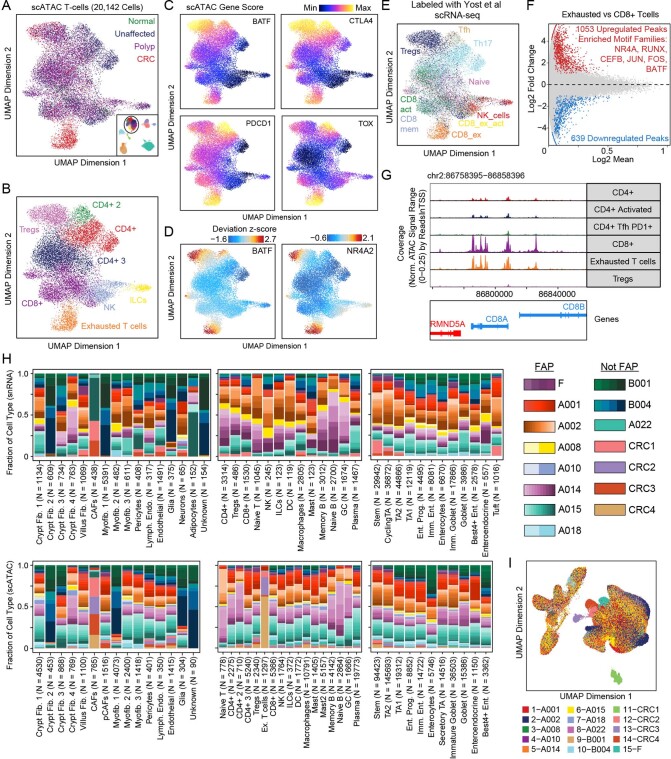
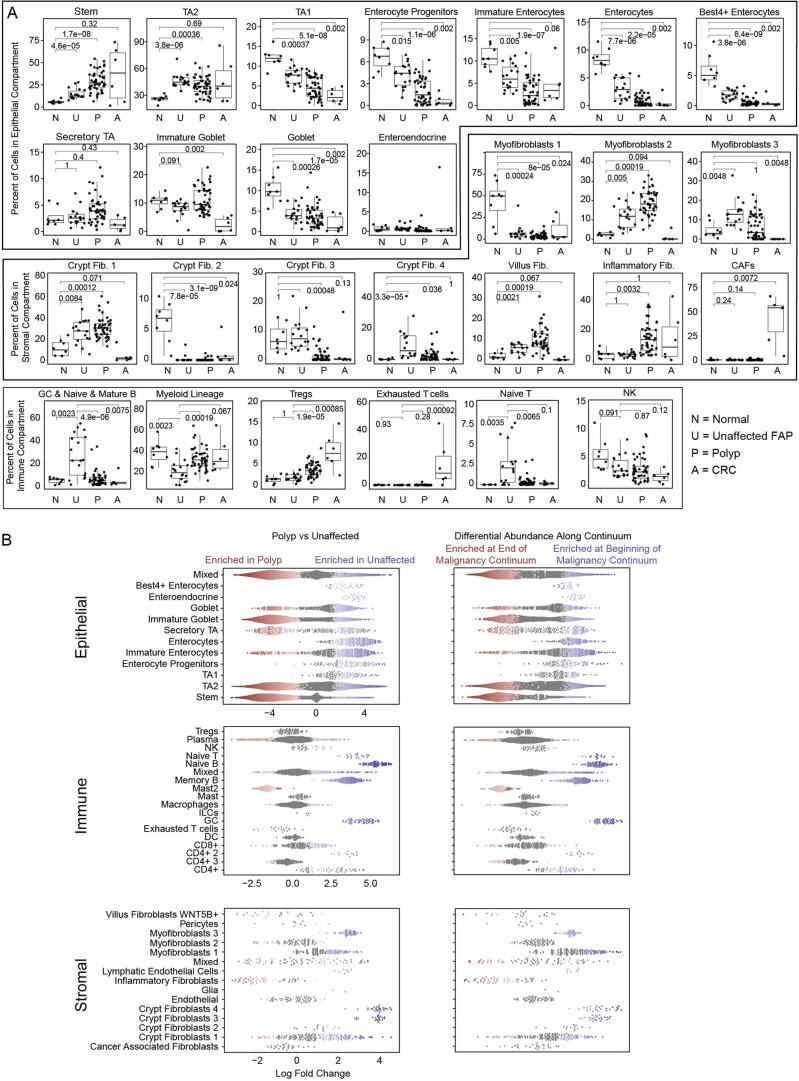
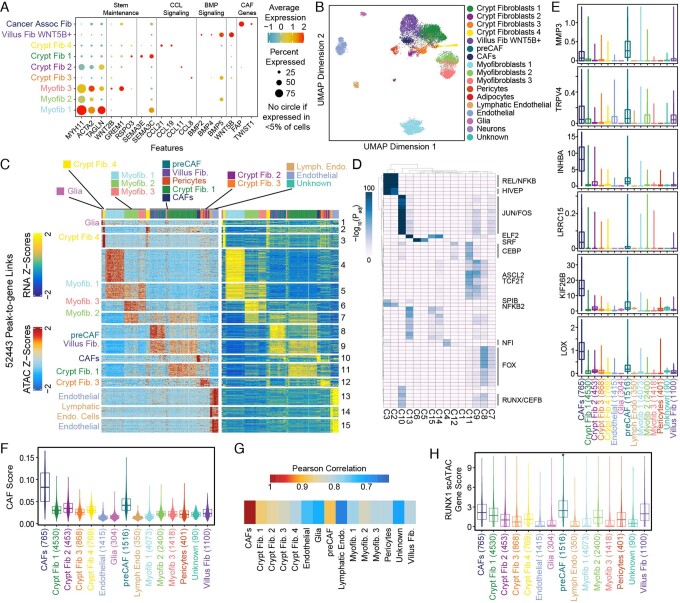
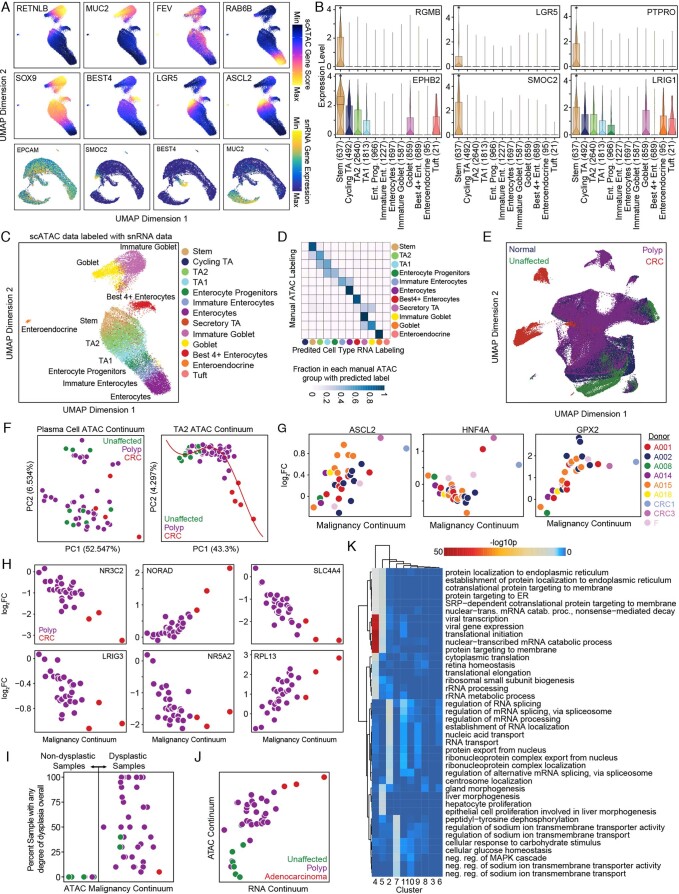
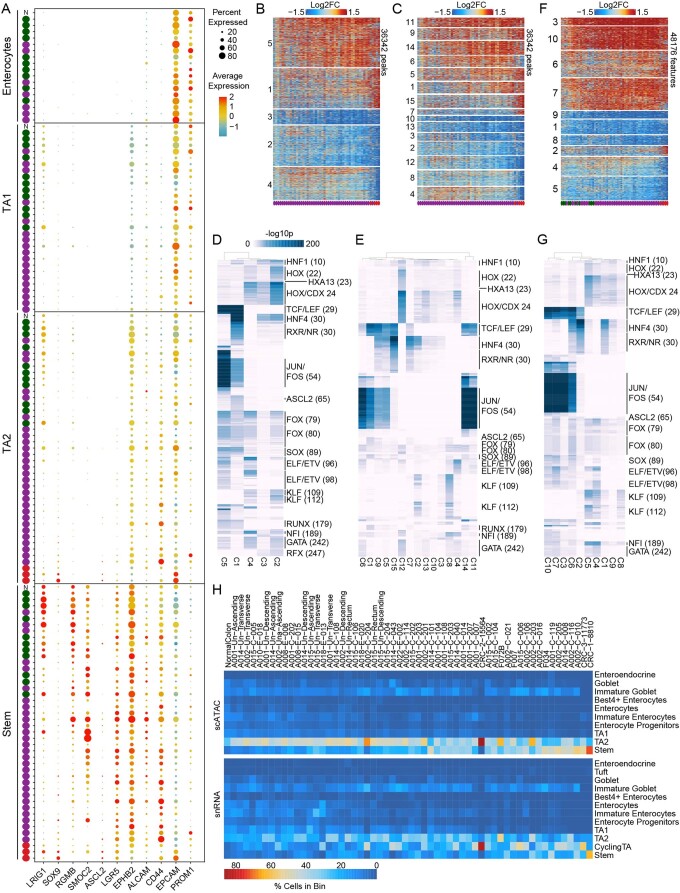
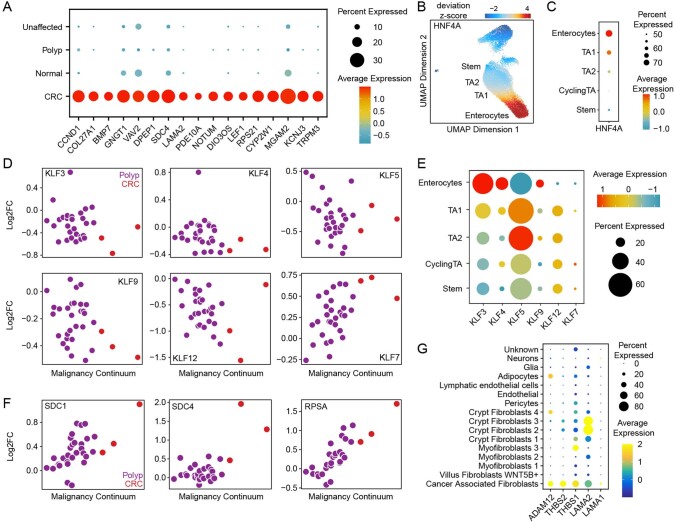
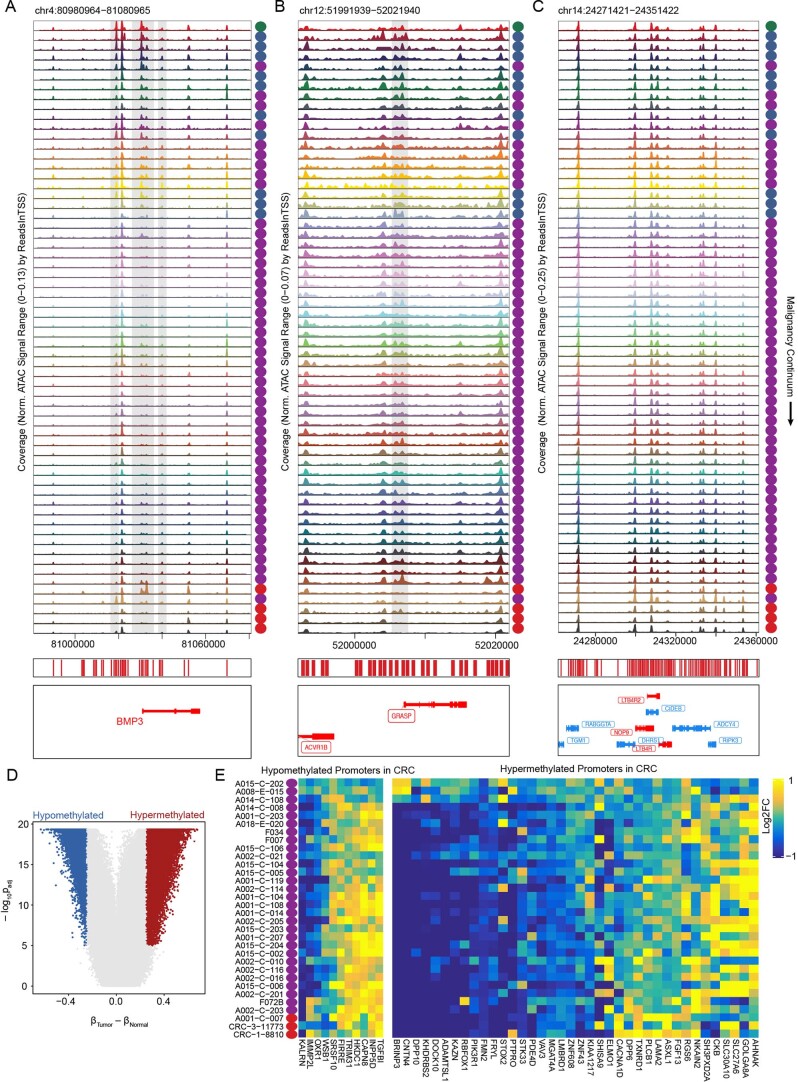
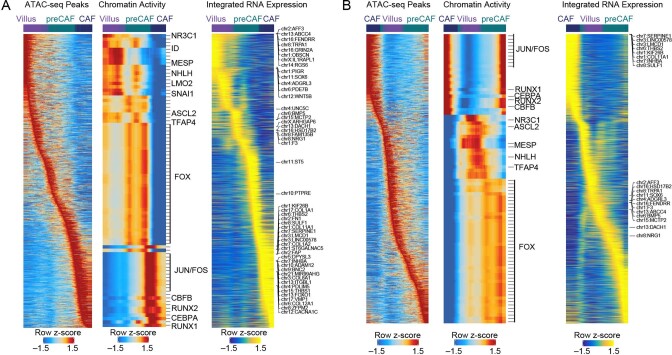
To chart cell composition and cell state changes that occur during the transformation of healthy colon to precancerous adenomas to colorectal cancer (CRC), we generated single-cell chromatin accessibility profiles and single-cell transcriptomes from 1,000 to 10,000 cells per sample for 48 polyps, 27 normal tissues and 6 CRCs collected from patients with or without germline APC mutations. A large fraction of polyp and CRC cells exhibit a stem-like phenotype, and we define a continuum of epigenetic and transcriptional changes occurring in these stem-like cells as they progress from homeostasis to CRC. Advanced polyps contain increasing numbers of stem-like cells, regulatory T cells and a subtype of pre-cancer-associated fibroblasts. In the cancerous state, we observe T cell exhaustion, RUNX1-regulated cancer-associated fibroblasts and increasing accessibility associated with HNF4A motifs in epithelia. DNA methylation changes in sporadic CRC are strongly anti-correlated with accessibility changes along this continuum, further identifying regulatory markers for molecular staging of polyps.


Conflict of interest statement

W.J.G. is a consultant and equity holder for 10x Genomics, Guardant Health, Quantapore and Ultima Genomics, and cofounder of Protillion Biosciences, and is named on patents describing ATAC-seq. M.P.S. is a cofounder and scientific advisor for Personalis, Qbio, January.ai, Filtricine, Mirvie and Protos, and an advisor for Genapsys. A.K. is a consultant with Illumina, Inc. The remaining authors declare no competing interests.

Figures

Fig. 1
Fig. 1. Single-cell atlas of expression and chromatin accessibility in CRC development.
a, Summary of the samples in this study. The bar chart shows the number of normal/unaffected colon tissues (gray), adenomas (purple) and CRCs (red) assayed for each patient. Locations of samples assayed from a single patient are indicated on the colon on the upper right. These data include deep profiling of four patients with FAP from whom we assayed 8–11 polyps, 0–1 carcinomas and 4–5 matched normal (unaffected) tissues. From non-FAP donors, we collected data on normal colon (9 samples from 2 donors), polyps (1 sample from 1 donor) and CRC tissues (4 samples from 4 patients). b,c, UMAP representations of all snRNA-seq (b) and scATAC-seq (c) cells colored by whether the cells were isolated from normal/unaffected colon tissues, adenomas or CRCs. d,g, UMAP representations and annotations of immune (d) and stromal (g) cells. e,h, Fraction of each immune (e) and stromal (h) cell type isolated from normal (green), unaffected (blue), polyp (purple) and CRC (red) samples. The color gradations within each color represent the contributions of each single sample (for example, each shade of red is a single CRC). f, CODEX images of eight polyps and two CRCs where cells are labeled with dark blue, CD3 is labeled in green and PD1 is labeled in light blue. All samples tested are shown in f. CODEX imaging of individual specimens was not reproduced. Representative sections of images of the entire specimen are shown in the figure. DC, dendritic cell; Fib., fibroblast; GC, germinal center; ILC, innate lymphoid cell; Myofib., myofibroblast/smooth muscle; NK, natural killer.
Fig. 2
Fig. 2. Epigenetic regulators of preCAFs and CAFs.
a, Dot plot representation of significant (MAST test) marker genes for CAFs. b, Genomic tracks for accessibility around WNT2 and RUNX1 for different stromal cell types. Peaks called in the scATAC data and peaks-to-gene links are indicated below the tracks. For example, a regulatory element ~50 kb away from the WNT2 TSS that is most accessible in CAFs whose accessibility is highly correlated to gene expression of WNT2 is indicated below the tracks. Marker peaks (Wilcoxon FDR ≤ 0.1 and log2FC ≥ 1.0) for each fibroblast subtype are indicated below the tracks. c, Marker peaks (Wilcoxon FDR ≤ 0.1 and log2FC ≥ 0.5) for each stromal cell type. Significance is determined by comparing each cell type with a background of all other cell types. d, Hypergeometric enrichment of TF motifs in stromal cell marker peaks. e, Plot of maximum difference between chromVAR deviation z-score, depicting TF motif activity, against correlation of chromVAR deviation and corresponding TF expression. TFs with maximum differences in chromVAR deviation z-score in the top quartile of all TFs and a correlation of greater than 0.5 are indicated in red. f, RNA expression (top) and chromVAR deviation z-scores (bottom) for selected TFs. The RNA expression plotted is the expression in the nearest RNA cell following integration of the snRNA-seq and scATAC-seq data. Corresponding violin plots and boxplots quantifying integrated gene expression and chromVar deviation z-scores for cells in each cell type are shown at the right. Boxplots represent the median, 25th percentile and 75th percentile of the data, and whiskers represent the highest and lowest values within 1.5 times the interquartile range of the boxplot. Cell types with significantly higher (Wilcoxon test, FDR ≤ 0.01 and log2FC ≥ 1) integrated RNA expression when compared with all other cell types are indicated with an asterisk. Assoc., associated; C. Fib, crypt fibroblast; Endo., endothelial; Norm., normalized.
Fig. 3
Fig. 3. Stem-like features observed in epithelial cells.
a, UMAP projection of snRNA-seq (left) and scATAC-seq (right) epithelial cells isolated from normal colon with cells colored by cell type. Colors for the cell types are defined in c. b, Projection of epithelial snRNA-seq (top) and scATAC-seq (bottom) cells from unaffected (left), polyp (center) and CRC (right) samples into the manifold of normal colon epithelial cells. Projected cells are colored by nearest normal cells in the projection and normal epithelial cells are colored gray. c, Fraction of each epithelial cell type isolated from normal (green), unaffected (blue), polyp (purple) and CRC (red) samples. Cell types are defined based on the identity of the nearest cell types when projecting epithelial cells into normal colon subspace. d, Boxplots depicting the fraction of cells within the epithelial compartment that are stem-like cells, enterocyte progenitors or enterocytes, divided by disease state. Abundances of each cell type in unaffected, polyp and CRC tissues are compared with their abundances in normal tissues with two-sided Wilcoxon testing and Bonferroni correction for multiple comparisons, and the resulting adjusted P values are listed in the plots. The boxplots are constructed with data from 8 normal samples, 18 unaffected samples, 48 polyp samples and 6 CRC samples. Boxplots represent the median, 25th percentile and 75th percentile of the data; whiskers represent the highest and lowest values within 1.5 times the interquartile range of the boxplot; and all points are plotted. e, Distribution of snRNA-seq and scATAC-seq stem scores in all epithelial cells in each sample. The rows represent individual samples and the columns represent 50 bins of stem scores from low to high for RNA (left) and ATAC (right). The heatmap is colored by the percentage of epithelial cells in each sample that are in a given bin of stem scores. A, adenocarcinoma; Ent., enterocyte; N, normal; P, polyp; TA, transit amplifying; U, unaffected FAP.
Fig. 4
Fig. 4. The regulatory trajectory of malignant transformation.
a, Malignancy continuum for snRNA-seq (left) and scATAC-seq (right). Principal components were computed on the log2FC values between stem-like cells from each sample and normal colon stem cells for the set of peaks and genes that were significantly differential (Wilcoxon FDR ≤ 0.05 and |log2FC | ≥ 1.5 for peaks; MAST test for genes) in at least two samples. A spline was fit to the first two principal components (red) and samples were ordered based on their position along the spline. b, Genomic alterations in common driver genes ordered by the malignancy continuum. c,d, Number of significantly differential genes (MAST test) (c) and peaks (Wilcoxon test) (d) for each sample relative to all unaffected samples. e,f, Heatmap of all genes (e) and peaks (f) that were significantly differentially expressed (MAST test, Padj ≤ 0.05 and |log2FC | ≥ 0.75) or accessible (Wilcoxon test, Padj ≤ 0.05 and |log2FC | ≥ 1.5) in ≥2 samples. Samples are ordered along the x axis by the malignancy continuum defined in d. Genes and peaks are k-means clustered into ten groups. g, Hypergeometric enrichment of TF motifs in k-means clusters of peaks defined in e. h, log2FC in expression of ASCL2, HNF4A and GPX2 in stem-like cells from each sample relative to stem-like cells in unaffected samples plotted against the malignancy continuum defined in d. Samples are colored based on if they are derived from polyps or CRCs.
Fig. 5
Fig. 5. Dynamics of cell-type representation in malignant transformation.
ah, Fraction of cell type in each scATAC sample plotted against position of the sample in the malignancy continuum defined in Fig. 4d for stem-like cells (a), enterocytes (b), immature goblet cells (c), goblet cells (d), Tregs (e), exhausted T cells (f), preCAFs (g) and CAFs (h). Samples are colored based on if they are derived from unaffected tissues, polyps or CRCs. Fractions are computed by dividing the number of cells of a given cell type by the total number of cells in the compartment (epithelial versus immune versus stromal). i, Stacked boxplot representation of the fraction of epithelial cells of each cell type for each scATAC sample along the malignancy continuum.
Fig. 6
Fig. 6. Integration of single-cell colon data with CRC methylation data reveals CRC DMRs with early changes in chromatin accessibility.
a, Table relating the change in accessibility for peaks to the methylation status of Illumina 450K methylation probes they overlap. In total, ~89,000 peaks overlapped 180,000 450K probes. Peaks classified as up were members of clusters 1–5 in Fig. 4f and peaks classified as down were members of clusters 6–10 in Fig. 4f. b, Heatmaps of peaks overlapping hypomethylated (top) and hypermethylated (bottom) 450K probes in CRC. The heatmaps are split into peaks from more accessible and less accessible groups defined in Fig. 4h and peaks not included in Fig. 4h. For nondifferential (nondiff) peaks overlapping hypermethylated probes, Plog2FC¯<0=0.81 and sign test P < 10−50. For nondifferential peaks overlapping hypomethylated peaks, Plog2FC¯>0=0.73 and sign test P < 10−50. c, Number of significantly differential peaks overlapping hypomethylated or hypermethylated 450K probes for each sample. The total number of peaks overlapping hypermethylated and hypomethylated probes is listed in each plot. d, Accessibility tracks around ITGA4 and NR5A2, which are hypermethylated in CRC. Tracks are ordered by position of the corresponding sample in the malignancy continuum defined in Fig. 4. DMR, differentially methylated region.
Extended Data Fig. 1
Extended Data Fig. 1. Quality control and annotation of single-cell datasets.
(a) Violin plots of TSS-enrichments for all scATAC cells from each sample. Samples are labeled by patient (for example A001, A002, etc), source (C = Colectomy, E = Colonoscopy, A = Autopsy, T = Tissue Bank), dissociation (D = dounce, S2 = S2 singulator). Replicates performed on additional sections of the same polyp are indicated with a R. (b) Violin plots of the percent of RNA that is mitochondrial RNA per sample and the number of UMIs sequenced for cells from each sample. Samples are labeled the same as in S1A, except all tissues were dounced so the dissociation method is not included. Boxplots represent the median, 25th percentile, and 75th percentile of the data and whiskers represent the highest and lowest values within 1.5 times the interquartile range of the boxplot in A and B. (c) UMAP projection of scATAC immune cells colored by gene activity scores reflecting accessibility within and around immune marker genes. (d) UMAP projection of snRNA-seq immune cells colored by expression of immune marker genes in each cell. (e) UMAP projection of snRNA-seq immune cells colored by automated labeling of snRNA-seq immune cells with SingleR. (f) UMAP projection of scATAC stromal cells colored by gene activity scores of stromal marker genes. (g) UMAP projection of snRNA-seq stromal cells colored by expression of marker genes. (H, I) UMAP projection of scATAC immune cells where cells are labeled by the nearest snRNA-seq cell from (h) Smillie et al or (i) this study after integrating the respective datasets with CCA. (j) UMAP projections of four scATAC samples with nuclei isolated with both douncing and the S2 Singulator, colored by disease state (top) and dissociation method (bottom). (k) Fraction of epithelial cells of each cell type for the 4 samples where nuclei were isolated with douncing and the S2 singulator. (l) Differential peaks between scATAC stem cells isolated from two sections of the same polyp that were processed with either the S2 singulator or douncing. (m) UMAP representation of stromal cells following Harmony batch correction on LSI dimensions. (n) Violin plots of gene module scores for interferon gamma gene sets for immune cells from different disease states. (o) Violin plot of gene module scores for an interferon gamma gene set for different immune cell types.
Extended Data Fig. 2
Extended Data Fig. 2. Cellular composition of samples in this study.
(a) Metadata collected for different samples in this study. (b, c) Stacked bar plot representation of the fraction of all immune cells in each sample composed of each cell type for the scATAC (B) and snRNA-seq (c) datasets. Each column represents a single sample, with each color representing a different cell type present in the sample. (d, e) Stacked bar plot representation of the fraction of all stromal cells in each sample composed of each cell type for the scATAC (d) and snRNA-seq (e) datasets. Each column represents a single sample, with each color representing a different cell type present in the sample.
Extended Data Fig. 3
Extended Data Fig. 3. T-cell annotation and donor contributions to clusters of cells.
(a, b) UMAP projection of all T-cells identified in the scATAC data. Points on the UMAP represent single-cells and are colored by tissue of origin (c) and cell type annotations (d). (c) UMAP projection of scATAC T-cells with cells colored by gene activity scores depicting chromatin accessibility surrounding BATF, CTLA4, PDCD1, and TOX. (d) ChromVAR deviation z-scores depicting TF motif activity of BATF and NR4A2 plotted on scATAC T-cell UMAP. (e) UMAP projection of scATAC T-cells colored by labeling of scATAC-seq T-cells with nearest snRNA-seq T-cells in BCC after integrating the datasets with CCA. (F) MA plot showing differential peaks (Wilcoxon test) between exhausted T-cells and CD8 + T-cells. Motifs with hypergeometric enrichment in peaks more accessible in exhausted T-cells are listed in the plot. (g) Genomic tracks depicting accessibility around CD8 locus in T-cell subtypes. Genes on the + strand are indicated in red and genes on the - strand are indicated in blue. (h) Stacked bar graph representation of the fraction of each cell type derived from each patient in the study. Cells from each patient have a different color and different shades of the same color represent individual samples from a given patient. (i) UAMP representation of all scATAC cells colored by patient of origin.
Extended Data Fig. 4
Extended Data Fig. 4. Differential cell type abundance.
(a) Boxplots depicting the fraction of cells in a given compartment (immune, stromal, or epithelial) that are composed of a given cell type. Each box represents data for a single disease state (N: Normal, U: Unaffected, P: Polyp, A: CRC) in this study. Wilcoxon p-values are listed above the plot and were corrected with Bonferroni correction for multiple hypothesis testing within each cell type. Wilcoxon comparisons were made to normal colon for stromal and epithelial cell types and unaffected FAP colon for immune cell types. The boxplots and statistics are derived from 8 normal samples, 18 unaffected samples, 48 polyp samples, and 6 CRC samples in the epithelial compartment, 8 normal samples, 18 unaffected samples, 47 polyp samples, and 6 CRC samples in the immune compartment, and 8 normal samples, 16 unaffected samples, 46 polyp samples, and 6 CRC samples in the stromal compartment. Boxplots represent the median, 25th percentile, and 75th percentile of the data, whiskers represent the highest and lowest values within 1.5 times the interquartile range of the boxplot, and all points are plotted. (b) Milo analysis of differential abundance changes between polyp and unaffected samples. The left plots show comparisons of polyp and unaffected samples, which were selected since they have the greatest number of samples. Neighborhoods that are significantly differentially abundant in polyps are colored in red and neighborhoods that are differentially abundant in unaffected samples are colored in blue. The plots on the right show comparisons along the malignancy continuum, with neighborhoods that are significantly differentially abundant early in the continuum shown in blue and neighborhoods that are significantly differentially abundant late in the continuum shown in red. All comparisons in A and B use the scATAC data, as we had a greater number of scATAC cells.
Extended Data Fig. 5
Extended Data Fig. 5. Cell type specific expression and RNA-ATAC integration of stromal cells.
(a) Dotplot representation of RNA expression of myofibroblast, stem maintenance, SEMA, CCL, BMP, and CAF genes by cells in different fibroblast subtypes. (b) Labeling of scATAC cells by aligning scATAC and snRNA-seq data with CCA and labeling scATAC cells based on nearest snRNA-seq cells. (c) Peak-to-gene linkages between scATAC and snRNA-seq stromal cells (correlation≥0.45). Rows in the left heatmap represent peaks and are colored by accessibility while rows in the right heatmap represent genes and are colored by expression. (d) Hypergeometric enrichment of motifs in clusters of peaks from S5C. (E) Integrated gene expression of CAF marker genes for different stromal cell types. (f) CAF scores for different stromal cell types depicted as violin plots with overlying boxplots. CAF scores are a measure of global accessibility at CAF marker peaks, and were defined by first identifying CAF marker peaks relative to all other cell types and then computing the number of Tn5 insertions in those marker peaks for each stromal cell and normalizing by the number of fragments in each cell. (g) Pearson correlation between accessibility at all peaks between CAFs and all other stromal cell types. (h) Violin plots showing the distribution of RUNX1 scATAC gene scores for cells of each stromal cell type. Boxplots in (e), (f), and (h) represent the median, 25th percentile, and 75th percentile of the data, and whiskers represent the highest and lowest values within 1.5 times the interquartile range of the boxplot.
Extended Data Fig. 6
Extended Data Fig. 6. Characterization of normal colon epithelium and identification of changes along the malignancy continuum.
(a) Upper 8 panels: UMAP projection of normal colon epithelial cells colored by scATAC gene activity scores of the epithelial marker genes RETNLB (immature goblet), MUC2 (goblet), FEV (enteroendocrine), RAB6B (enterocyte), SOX9 (stem), BEST4 (Best4+ enterocyte), LGR5 (stem), and ASCL2 (stem). Lower 4 panels: UMAP projection of normal colon epithelial cells colored by expression of marker genes EPCAM (general epithelial), SMOC2 (stem), BEST4, and MUC2. (b) Violin and boxplot representation of gene expression of stem marker genes by epithelial cell type. Asterisks indicate that gene expression is significantly upregulated when compared to all other cell types. Boxplots represent the median, 25th percentile, and 75th percentile of the data and whiskers represent the highest and lowest values within 1.5 times the interquartile range of the boxplots. (c) Labeling of scATAC-seq epithelial cells by nearest snRNA-seq cells following integration of the datasets with CCA. (d) Confusion matrix comparing annotation of scATAC cells using marker genes and labeling of scATAC cells with the nearest snRNA-seq cell following integration of scATAC and snRNA-seq datasets. (e) UMAP representation of snRNA-seq epithelial cells colored by disease state. (f) Results of computing the continuum on plasma cells and TA2 cells using the same method performed for stem cells. (g) Log2FC in expression of ASCL2, HNF4A, and GPX2 in stem-like cells from each sample relative to stem-like cells in unaffected samples plotted against the malignancy continuum defined in 4D. Samples are colored based on the patient the sample was collected from. (H) Log2FC in expression of NR3C2, NORAD, SLC4A4, LRIG3, NR5A2, and RPL13 as a function of malignancy continuum. Samples are colored based on if they are derived from polyps or CRCs. (i) Relationship between the malignancy continuum and percent of sample with any degree of dysplasia as determined by microscopic pathology. Samples are colored based on gross classification as a polyp (purple) or unaffected (green) tissue. Note that some samples classified as unaffected had dysplasia while some samples classified as polyps did not have dysplasia. (i) Relationship between the malignancy continuums defined from the scATAC and snRNA-seq datasets. Samples are colored based on gross classification as unaffected, polyp, or CRC. (k) Enrichment of gene ontology terms in clusters of differential RNA genes in Fig. 4.
Extended Data Fig. 7
Extended Data Fig. 7. Motif enrichment in differential peaks with different numbers of k-means clusters.
(a) Expression of intestinal stem cell and colon cancer stem cell marker genes in stem cells, TA2 cells, TA1 cells, and Enterocytes by sample. Samples are ordered by the malignancy continuum defined in Fig. 4. (B, c) Heatmaps of all peaks that were significantly differentially accessible (Wilcoxon test, padj≤0.05 & |log2FC | ≥1.5) in ≥2 samples. Samples are ordered along the x-axis by the malignancy continuum defined in Fig. 4. Peaks are k-means clustered into 5 (b) or 15 (c) clusters. (d, e) Hypergeometric enrichment of TF motifs in k-means clusters of peaks defined in B (d) and C (e). (f) Heatmap of all peaks that were significantly differentially accessible in ≥2 samples between stem cells from a given sample and normal colon stem cells. Samples are ordered along the x-axis by the malignancy continuum defined in Fig. 4. Peaks are k-means clustered into 10 groups. (g) Hypergeometric enrichment of TF motifs in k-means clusters of peaks defined in F. (h) Heatmap representation of cell types in each epithelial sample as determined by the nearest normal cell after projecting the cells into the normal LSI subspace.
Extended Data Fig. 8
Extended Data Fig. 8. Epigenetic and transcriptomic changes along the malignancy continuum.
(A) Dot plot representation of genes differentially expressed in CRC relative to polyps. (b) UMAP projection of normal colon epithelial cells colored by motif activity of HNF4A. (c) Dot plot representation of HNF4A expression in different normal colon epithelial subtypes. (d) Log2FC in expression of KLF TFs relative to unaffected colon as a function of position along the malignancy continuum. Samples are colored based on if they are from polyps (purple) or CRC (red). (e) Dotplot representation of the expression of KLF TFs in normal colon epithelial cells. (f) Log2FC in expression of SDC1, SDC4, and RPSA along the malignancy continuum. Samples are colored based on if they are from polyps (purple) or CRC (red). (g) Dotplot representation of the expression of selected ligands by different stromal cell types.
Extended Data Fig. 9
Extended Data Fig. 9. Accessibility changes in regions hypermethylated in CRC.
(a–c) Accessibility tracks around BMP3 (a), GRASP (b), and CIDEB (c), which are hypermethylated in CRC. (d) Adjusted p-value and mean difference in β-value cutoffs used to determine differentially methylated probes. P values were determined using the two-sided Wilcoxon test and were adjusted with the Benjamini-Hochberg method for multiple hypothesis testing. (e) Genes that were significantly differential along the malignancy continuum that also have differentially methylated probes within 500 bp of their TSS in TCGA 450 K methylation data. Genes are grouped into a heatmap of those with hypermethylated probes in their promoters and a heatmap of those with hypomethylated probes in their promoters.
Extended Data Fig. 10
Extended Data Fig. 10. Trajectory analysis of preCAFs and CAFs.
(a) Changes in most variable peaks, TF motif activity scores, and gene expression along the trajectory from villus fibroblasts to preCAFs to CAFs. (b) Changes in most variable peaks, TF motif activity scores, and gene expression along a control trajectory from CAFs to villus fibroblasts to preCAFs.

Comment in

References

    1. Weinstein JN, et al. The Cancer Genome Atlas Pan-Cancer analysis project. Nat. Genet. 2013;45:1113–1120. - PMC - PubMed
    1. International Cancer Genome Consortium et al. International network of cancer genome projects. Nature. 2010;464:993–998. - PMC - PubMed
    1. The ICGC/TCGA Pan-Cancer Analysis of Whole Genomes Consortium. Pan-cancer analysis of whole genomes. Nature578, 82–93 (2020). - PubMed
    1. Fodde R, Smits R, Clevers H. APC, signal transduction and genetic instability in colorectal cancer. Nat. Rev. Cancer. 2001;1:55–67. - PubMed
    1. Aoki K, Taketo MM. Adenomatous polyposis coli (APC): a multi-functional tumor suppressor gene. J. Cell Sci. 2007;120:3327–3335. - PubMed

Publication types