

Spatial transcriptomics identifies enriched gene expression and cell types in human liver fibrosis
- PMID: 35726350
- PMCID: PMC9426406
- DOI: 10.1002/hep4.2001
Spatial transcriptomics identifies enriched gene expression and cell types in human liver fibrosis
Abstract
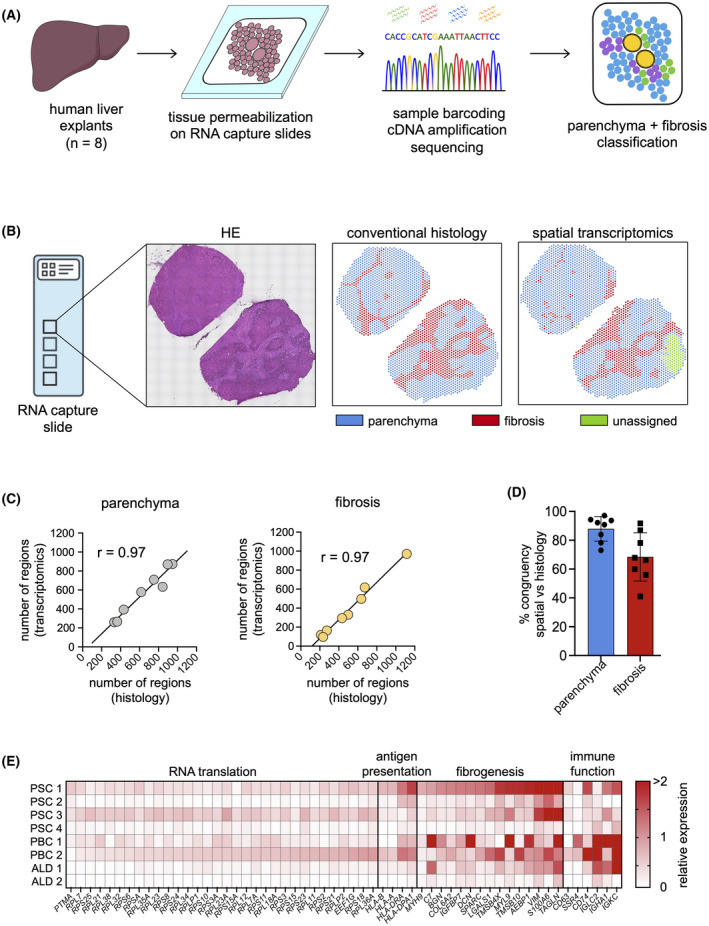
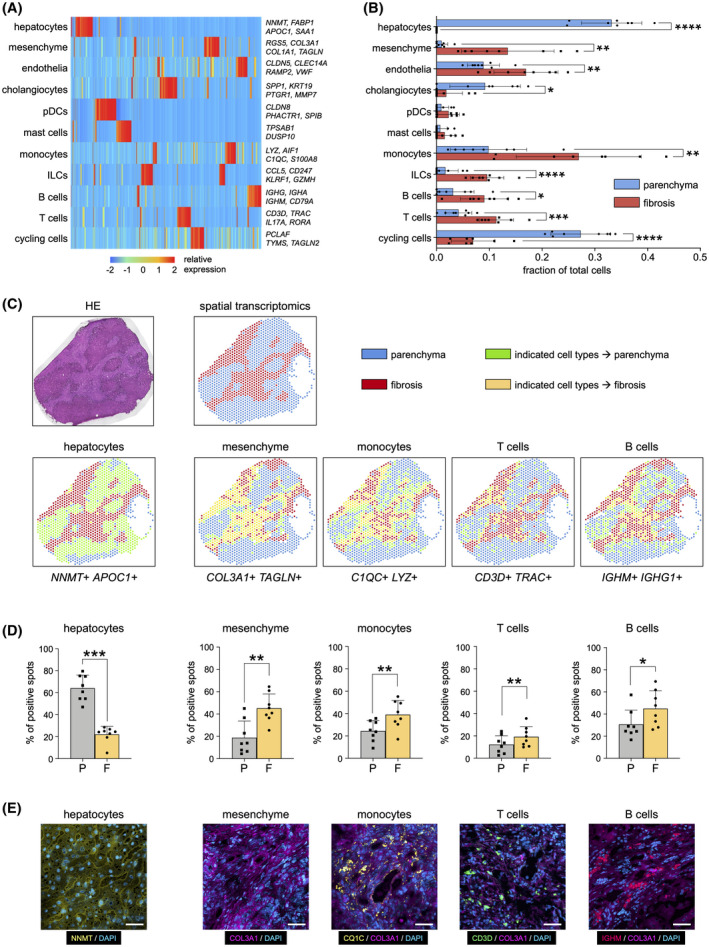
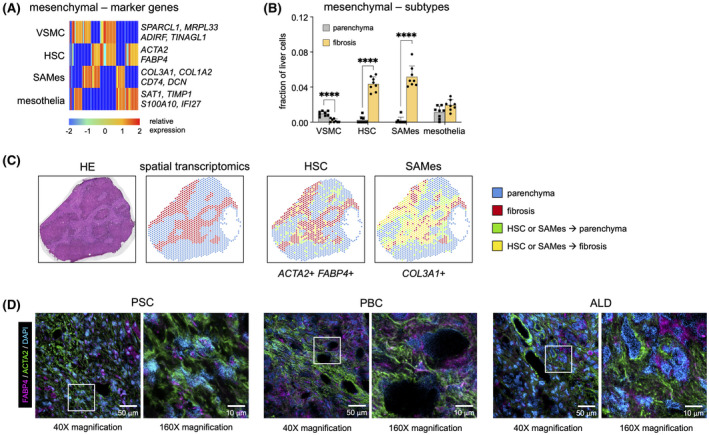
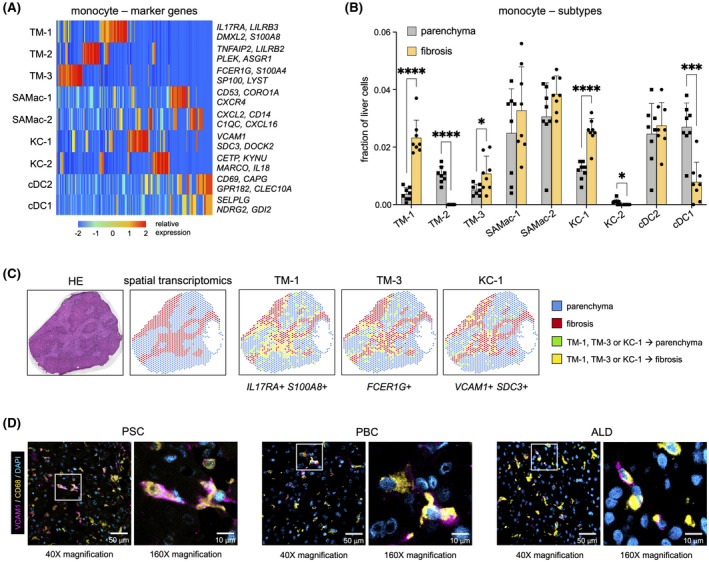
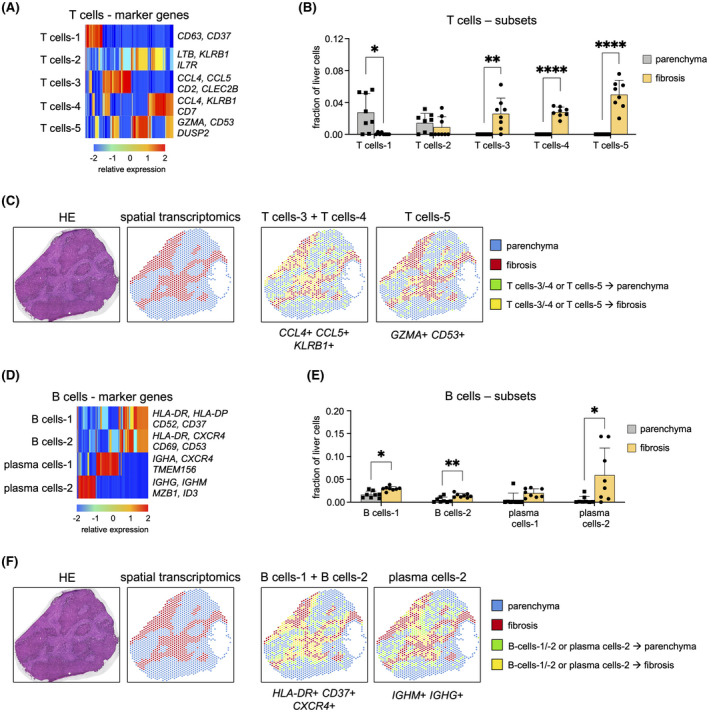
Liver fibrosis and cirrhosis have limited therapeutic options and represent a serious unmet patient need. Recent use of single-cell RNA sequencing (scRNAseq) has identified enriched cell types infiltrating cirrhotic livers but without defining the microanatomical location of these lineages thoroughly. To assess whether fibrotic liver regions specifically harbor enriched cell types, we explored whether whole-tissue spatial transcriptomics combined with scRNAseq and gene deconvolution analysis could be used to localize cell types in cirrhotic explants of patients with end-stage liver disease (total n = 8; primary sclerosing cholangitis, n = 4; primary biliary cholangitis, n = 2, alcohol-related liver disease, n = 2). Spatial transcriptomics clearly identified tissue areas of distinct gene expression that strongly correlated with the total area (Spearman r = 0.97, p = 0.0004) and precise location (parenchyma, 87.9% mean congruency; range, 73.1%-97.1%; fibrosis, 68.5% mean congruency; range, 41.0%-91.7%) of liver regions classified as parenchymal or fibrotic by conventional histology. Deconvolution and enumeration of parenchymal and fibrotic gene content as measured by spatial transcriptomics into distinct cell states revealed significantly higher frequencies of ACTA2+ FABP4+ and COL3A1+ mesenchymal cells, IL17RA+ S100A8+ and FCER1G+ tissue monocytes, VCAM1+ SDC3+ Kupffer cells, CCL4+ CCL5+ KLRB1+ and GZMA+ IL17RA+ T cells and HLA-DR+, CD37+ CXCR4+ and IGHM+ IGHG+ B cells in fibrotic liver regions compared with parenchymal areas of cirrhotic explants. Conclusion: Our findings indicate that spatial transcriptomes of parenchymal and fibrotic liver regions express unique gene content within cirrhotic liver and demonstrate proof of concept that spatial transcriptomes combined with additional RNA sequencing methodologies can refine the localization of gene content and cell lineages in the search for antifibrotic targets.
© 2022 The Authors. Hepatology Communications published by Wiley Periodicals LLC on behalf of American Association for the Study of Liver Diseases.
Conflict of interest statement
TH.K consults for Intercept, Engitix and Albireo, is on the speakers' bureau of Gilead, and owns stock in Ultimovacs.
Figures
Similar articles
-
Single-cell and spatial transcriptomics reveal the fibrosis-related immune landscape of biliary atresia.Clin Transl Med. 2022 Nov;12(11):e1070. doi: 10.1002/ctm2.1070. Clin Transl Med. 2022. PMID: 36333281 Free PMC article.
-
Spatial gene regulatory networks driving cell state transitions during human liver disease.EMBO Mol Med. 2025 Jun;17(6):1452-1474. doi: 10.1038/s44321-025-00230-6. Epub 2025 Apr 25. EMBO Mol Med. 2025. PMID: 40281306 Free PMC article.
-
Technical optimization of spatially resolved single-cell transcriptomic datasets to study clinical liver disease.Sci Rep. 2024 Feb 13;14(1):3612. doi: 10.1038/s41598-024-53993-2. Sci Rep. 2024. PMID: 38351241 Free PMC article.
-
Pathogenesis of biliary fibrosis.Biochim Biophys Acta Mol Basis Dis. 2018 Apr;1864(4 Pt B):1279-1283. doi: 10.1016/j.bbadis.2017.07.026. Epub 2017 Jul 25. Biochim Biophys Acta Mol Basis Dis. 2018. PMID: 28754450 Review.
-
Cooperation of liver cells in health and disease.Adv Anat Embryol Cell Biol. 2001;161:III-XIII, 1-151. doi: 10.1007/978-3-642-56553-3. Adv Anat Embryol Cell Biol. 2001. PMID: 11729749 Review.
Cited by
-
Spatial genomics: mapping human steatotic liver disease.Nat Rev Gastroenterol Hepatol. 2024 Sep;21(9):646-660. doi: 10.1038/s41575-024-00915-2. Epub 2024 Apr 23. Nat Rev Gastroenterol Hepatol. 2024. PMID: 38654090 Review.
-
Spatial‒temporal heterogeneities of liver cancer and the discovery of the invasive zone.Clin Transl Med. 2025 Feb;15(2):e70224. doi: 10.1002/ctm2.70224. Clin Transl Med. 2025. PMID: 39924620 Free PMC article. Review.
-
Spatial dimension of macrophage heterogeneity in liver diseases.eGastroenterology. 2023 Jun 20;1(1):e000003. doi: 10.1136/egastro-2023-000003. eCollection 2023 Jun. eGastroenterology. 2023. PMID: 39944246 Free PMC article. Review.
-
Friend or foe? The elusive role of hepatic stellate cells in liver cancer.Nat Rev Gastroenterol Hepatol. 2023 Oct;20(10):647-661. doi: 10.1038/s41575-023-00821-z. Epub 2023 Aug 7. Nat Rev Gastroenterol Hepatol. 2023. PMID: 37550577 Free PMC article. Review.
-
Mosaic loss of Y chromosome and mortality after coronary angiography.Eur Heart J. 2025 May 2;46(17):1603-1616. doi: 10.1093/eurheartj/ehaf035. Eur Heart J. 2025. PMID: 39935193 Free PMC article.
References
-
- European Association for the Study of the Liver , Angeli P, Bernardi M, Villanueva C, Francoz C, Mookerjee RP, et al. EASL clinical practice guidelines for the management of patients with decompensated cirrhosis. J Hepatol. 2018;69:406–60. - PubMed
-
- Ramachandran P, Henderson NC. Antifibrotics in chronic liver disease: tractable targets and translational challenges. Lancet Gastroenterology Hepatol. 2016;1:328–40. - PubMed
Publication types
MeSH terms
LinkOut - more resources
Full Text Sources
Medical
Research Materials
Miscellaneous
