. 2022 Aug;13(4):2102-2117.
doi: 10.1002/jcsm.13023. Epub 2022 Jun 20.

Decoding the transcriptome of denervated muscle at single-nucleus resolution

Affiliations

Decoding the transcriptome of denervated muscle at single-nucleus resolution

Hongchun Lin et al. J Cachexia Sarcopenia Muscle. 2022 Aug.

Abstract

Background: Skeletal muscle exhibits remarkable plasticity under both physiological and pathological conditions. One major manifestation of this plasticity is muscle atrophy that is an adaptive response to catabolic stimuli. Because the heterogeneous transcriptome responses to catabolism in different types of muscle cells are not fully characterized, we applied single-nucleus RNA sequencing (snRNA-seq) to unveil muscle atrophy related transcriptional changes at single nucleus resolution.

Methods: Using a sciatic denervation mouse model of muscle atrophy, snRNA-seq was performed to generate single-nucleus transcriptional profiles of the gastrocnemius muscle from normal and denervated mice. Various bioinformatics analyses, including unsupervised clustering, functional enrichment analysis, trajectory analysis, regulon inference, metabolic signature characterization and cell-cell communication prediction, were applied to illustrate the transcriptome changes of the individual cell types.

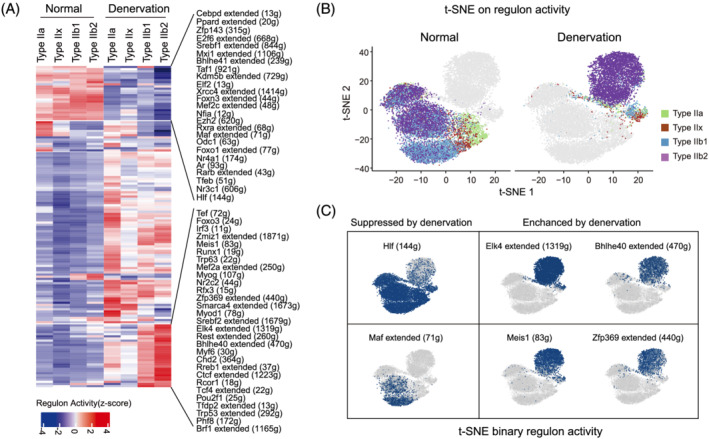
Results: A total of 29 539 muscle nuclei (normal vs. denervation: 15 739 vs. 13 800) were classified into 13 nuclear types according to the known cell markers. Among these, the type IIb myonuclei were further divided into two subgroups, which we designated as type IIb1 and type IIb2 myonuclei. In response to denervation, the proportion of type IIb2 myonuclei increased sharply (78.12% vs. 38.45%, P < 0.05). Concomitantly, trajectory analysis revealed that denervated type IIb2 myonuclei clearly deviated away from the normal type IIb2 myonuclei, indicating that this subgroup underwent robust transcriptional reprogramming upon denervation. Signature genes in denervated type IIb2 myonuclei included Runx1, Gadd45a, Igfn1, Robo2, Dlg2, and Sh3d19 (P < 0.001). The gene regulatory network analysis captured a group of atrophy-related regulons (Foxo3, Runx1, Elk4, and Bhlhe40) whose activities were enhanced (P < 0.01), especially in the type IIb2 myonuclei. The metabolic landscape in the myonuclei showed that most of the metabolic pathways were down-regulated by denervation (P < 0.001), while some of the metabolic signalling, such as glutathione metabolism, was specifically activated in the denervated type IIb2 myonulei. We also investigated the transcriptomic alterations in the type I myofibres, muscle stem cells, fibro-adipogenic progenitors, macrophages, endothelial cells and pericytes and characterized their signature responses to denervation. By predicting the cell-cell interactions, we observed that the communications between myofibres and muscle resident cells were diminished by denervation.

Conclusions: Our results define the myonuclear transition, metabolic remodelling, and gene regulation networks reprogramming associated with denervation-induced muscle atrophy and illustrate the molecular basis of the heterogeneity and plasticity of muscle cells in response to catabolism. These results provide a useful resource for exploring the molecular mechanism of muscle atrophy.

Keywords: Denervation; Muscle atrophy; Muscle metabolism; Skeletal muscle; snRNA-seq.


Conflict of interest statement

All authors declare no conflicting financial interests. The authors of this manuscript certify that they comply with the ethical guidelines for authorship and publishing in the Journal of Cachexia, Sarcopenia and Muscle.

Figures

Figure 1
Figure 1
Classification of nucleus/cell types in normal and denervated gastrocnemius (gas) muscles. (A) Immunofluorescent staining: Type I fibres are labelled with anti‐Myh7 antibody (red) and co‐stained with laminin (green). Images were taken at ×20 magnification. (B) Comparison of cross‐sectional area (CSA) between normal and denervated conditions. The data are presented as mean ± SEM (n = 6). (C) Fibre size distribution of normal and denervated gas muscles. The size of 300–400 fibres in muscles of each animal was assessed (n = 6). (D) Uniform manifold approximation and projection (UMAP) visualized nuclear clusters, which are coloured and labelled according to cell identities, in normal (left panel) and denervated (right panel) gas muscles. Type I, type I myonuclei; type IIa, type IIa myonuclei; type IIx, type IIx myonuclei; type IIb, type IIb myonuclei; MTJ, myotendinous junction nuclei; NMJ, neuromuscular junction nuclei; MuSCs, muscle satellite cells nuclei; FAPs, fibro‐adipogenic progenitors nuclei; macrophage, macrophages nuclei; ECs, endothelial cells nuclei; Pericytes, pericytes nuclei; adipocyte, adipocyte nuclei. (E) UMAP plot displaying the cell identity of each nuclear cluster. (F) Proportion of nuclear types in normal and denervated muscles. Each nucleus/cell type is colour‐coded. (G) UMAP plots with pseudotime trajectories of all nuclei obtained from normal and denervated muscles. The black lines on the UMAP plots represent branched trajectories. Each point denotes a single nucleus. Left panel: Nuclei are colour‐coded according to their cluster assignments in (D). Right panel: Nuclei are coloured by conditions (blue, normal; pink, denervation).
Figure 2
Figure 2
Trajectory illustrated transcriptional heterogeneity in type II myonuclei. (A) UMAP showing trajectory of type II myonuclei from normal (left panel, n = 10 561) and denervated muscles (right panel, n = 6631). The myonuclei are coloured according to conditions (left panel: blue, normal; pink, denervation) or their identified subtypes (middle and right panel). Type IIa, type IIa myonuclei; type IIx, type IIx myonuclei; type IIb1, type IIb1 myonuclei; type IIb2, Type IIb2 myonuclei. (B) Proportion of different type II myonuclei subtypes in normal and denervated conditions. (C) Heatmap showing the differential expressed genes (DEGs) of type II myonuclei subtypes. The colour scale represents the relative expression level of gene in each nucleus. (D) Enriched KEGG pathways (P < 0.01) in denervated type IIb2 myonuclei. The colour scale indicates the significance level of enrichment (adjust p value). Dot size represents counts of genes enriched in the pathway. KEGG, Kyoto encyclopedia of genes and genomes. (E) GSEA plots showing enrichment score (ES) of the significant enriched hallmark gene sets in type IIb2 myonuclei. A positive value of ES indicates enriched in denervation condition, and a negative value indicates enriched in normal condition but down‐regulated in denervation. GSEA, gene set enrichment analysis; NES, normalized enrichment score; FDR, false discovery rate.
Figure 3
Figure 3
Gene regulatory network (GRN) of type IIb2 myonuclei in normal and denervation. (A) Heatmap showing regulons with significant changes between normal and denervated type IIb2 myonuclei. The colour scale represents the activities of regulons. The top changed regulons and the counts of downstream target genes in the regulons are provided on the left. (B) t‐distributed stochastic neighbour embedding (t‐SNE) on binary regulon activity matrix of normal (left panel) and denervated (right panel) type II myonuclei. Each nucleus is coloured according to corresponding subtype. (C) t‐SNE on the binary regulon activity matrix showing denervation suppresses (left panel) or enhances (right panel) the activities of select regulons in myonuclei.
Figure 4
Figure 4
Transcriptional responses of type I myonuclei to denervation. (A) UMAP showing the pseudotime trajectory of type I myonuclei from normal (blue, n = 88) and denervated (pink, n = 44) muscles. (B) Violin plot showing the expression of select differentially expressed genes (DEGs) between normal (blue) and denervated (pink) type I myonuclei. N, normal; D, denervation. Wilcoxon rank sum test: Min.Pct = 0.25, logfc.Threshold = 0.25. Significance level: ***P < 0.001. (C) Enriched KEGG pathways (P < 0.01) of DEGs in denervated type I myonuclei. The colour scale indicates the significance level of enrichment (adjust p value). Dot size represents counts of genes enriched in the pathway. (D) GSEA plots showing enrichment score (ES) of the significant enriched hallmark gene sets in type I myonuclei. NES, normalized enrichment score; FDR, false discovery rate. (E) Heatmap showing top changed regulons between normal and denervated type I myonuclei. The colour scale represents the activities of regulons. The number in parentheses represents the count of target genes in corresponding regulons.
Figure 5
Figure 5
Metabolic landscape of myonuclei from normal and denervated muscles. (A) Clustering on metabolic gene expression profiles of myonuclei enables identification of normal and denervation cell states. The dots are coloured according to different conditions (normal, blue; denervation, pink). (B) UMAP of metabolic profiles of different myonuclei subtypes in normal (right panel) and denervation (left panel). The dots are coloured according to corresponding subtypes. (C) Boxplot showing the metabolic activities of different myonuclei subtypes between normal and denervation. Each dot represents the activity score of an individual metabolic pathway. Comparisons between conditions are performed using Wilcoxon rank‐sum test. N, normal; D, denervation. (D) The activity score of top metabolic pathways detected in myonuclei subtypes. The blank indicates that the score of pathway activity is not significant in relevant subtype (random permutation test, P > 0.01). The metabolic pathways are arranged according to categories.
Figure 6
Figure 6
Transcriptional responses to denervation in FAPs. (A) UMAP showing a branching trajectory of FAPs from normal muscles (upper panel, n = 2825) and denervated muscles (lower panel, n = 3634). The nuclei mapped on the path are coloured and labelled according to their identified subtypes as C1, C2, and C3. These subclusters are annotated as apoptotic branch, fibrotic branch and adipogenic branch according to GSEA analysis. (B) Heatmap displaying the relative expression level of the top 10 DEGs between normal and denervation condition in 3 identified FAPs subtypes. Left panel: DEGs of C1 subtype. Middle panel: DEGs of C2 subtype. Right panel: DEGs of C3 subtype. The colour scale represents the normalized expression values. (C) Heatmap showing GSEA enrichment scores of the 3 FAPs subtypes in denervated muscle compared with corresponding normal subtypes. The category annotations of hallmark gene sets are based on information from GSEA database. A positive enrichment score (ES) indicates the gene set is significantly enriched in denervated FAPs, and a negative ES indicates that gene set is significantly enriched in normal FAPs. The blank indicates there is no significant enrichment of the gene set (P > 0.05, FDR > 25%). (D) The most active regulons in 3 subtypes of FAPs from normal and denervated muscles. The colour scale represents the normalized scores of regulon activity: Red denotes high level of activity while blue indicates low level of activity. The number in parentheses represents the count of downstream target genes in corresponding regulons.
Figure 7
Figure 7
Transcriptional responses to denervation in macrophages. (A) UMAP showing 2 subclusters of macrophages coloured with identified phenotypes. Resident: Skeletal muscle resident macrophages (orange); monocyte‐derived: Monocyte‐derived macrophages (blue). (B) Visualization of the expression and distribution of established macrophage identities in 2 subtypes of macrophage. (C) Left panel: Visualization of the 2 macrophages subtypes on UMAP split by conditions (normal and denervation). The number in brackets denotes the total numbers of macrophage from normal and denervated muscles. Right panel: Changes in proportions of macrophages subtypes in normal and denervated muscles. Different colours represent the corresponding subtypes. (D) Trajectory of resident macrophages from normal and denervated muscles. Each dot represents a nucleus and is coloured according to conditions (blue, normal; pink, denervation). (E) The expression levels of top 10 DEGs in resident macrophages between normal and denervation. (F) Significant enriched GO gene sets in resident macrophages from denervated muscles. GO, gene ontology; NES, normalized enrichment score; FDR, false discovery rate. (G) The activity scores of top 10 regulons detected in normal and denervated resident macrophages.
Figure 8
Figure 8
Ligand‐receptor interactions between myofibres and other resident cells in response to denervation. (A) Chrod plot displaying intercellular ligand‐receptor (L‐R) interactions in normal (left panel) and denervated (right panel) muscles. Ligands differentially expressed by myofibres are listed below the dash line, and receptors differentially expressed by receiver cells (including myofibres and other types of resident cells) are listed above the dash line. The communications from myofibres (L) to other resident cells (R) are highlighted (green and yellow). Other interactions are presented in grey.(B) Heatmap showing changes in the normalized scores of L‐R interactions between type II myofibres and other cells in normal and denervated condition. The interaction score is determined by the expression level of ligands (Vegfa or Fgf13) in myofibres and expression level of receptors in receiver cells. The columns represent the receiver cell types and the rows represent predicted L‐R pairs. The colour scale represents the score of interaction; a higher score indicates greater interaction between cells. (C) Heatmap of ligand‐receptor interaction scores. Results show that the interactions between Fgf1 in type I myofibres and their receptors in other resident cells. (D) Chrod plot displaying intercellular L‐R interactions in normal (left panel) and denervated (right panel) muscles. Ligands differentially expressed by receiver cells are listed below the dash line, and receptors differentially expressed by myofibres are listed above the dash line. The communications from resident cells (L) to myofibres (R) are highlighted. Other interactions are presented in grey. (E) Heatmap of ligand‐receptor interaction scores. Results show that the interactions between ligands in resident cells and their receptors in type I myofibres. (F) Heatmap of ligand‐receptor interaction scores. Results show that the interactions between ligands in resident cells and their receptors in type II myofibres.

References

    1. Baskin KK, Winders BR, Olson EN. Muscle as a "mediator" of systemic metabolism. Cell Metab 2015;21:237–248. - PMC - PubMed
    1. Schiaffino S, Reggiani C. Fiber types in mammalian skeletal muscles. Physiol Rev 2011;91:1447–1531. - PubMed
    1. De Micheli AJ, Laurilliard EJ, Heinke CL, Ravichandran H, Fraczek P, Soueid‐Baumgarten S, et al. Single‐Cell Analysis of the Muscle Stem Cell Hierarchy Identifies Heterotypic Communication Signals Involved in Skeletal Muscle Regeneration. Cell Rep 2020;30:3583–3595, e5. - PMC - PubMed
    1. Rubenstein AB, Smith GR, Raue U, Begue G, Minchev K, Ruf‐Zamojski F, et al. Single‐cell transcriptional profiles in human skeletal muscle. Sci Rep 2020;10:229. - PMC - PubMed
    1. Nicoletti C, Wei X, Etxaniz U, Proietti D, Madaro L, Puri PL. scRNA‐seq‐based analysis of skeletal muscle response to denervation reveals selective activation of muscle‐resident glial cells and fibroblasts. bioRxiv. 2020; 2020.12.29.424762.

Publication types

Substances