. 2022 Aug;16(16):2899-2919.
doi: 10.1002/1878-0261.13276. Epub 2022 Jul 19.

Clonal heterogeneity and rates of specific chromosome gains are risk predictors in childhood high-hyperdiploid B-cell acute lymphoblastic leukemia

Affiliations

Clonal heterogeneity and rates of specific chromosome gains are risk predictors in childhood high-hyperdiploid B-cell acute lymphoblastic leukemia

Mireia Ramos-Muntada et al. Mol Oncol. 2022 Aug.

Abstract

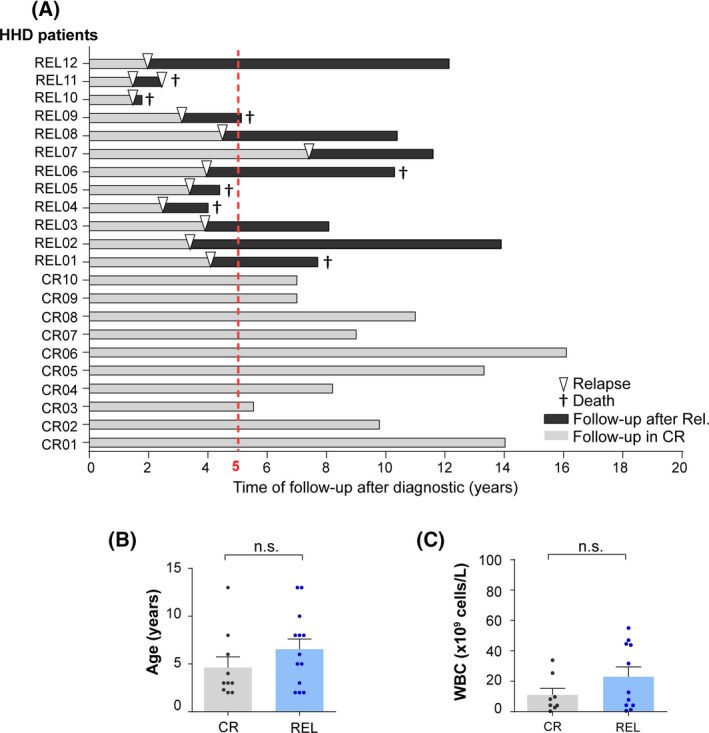
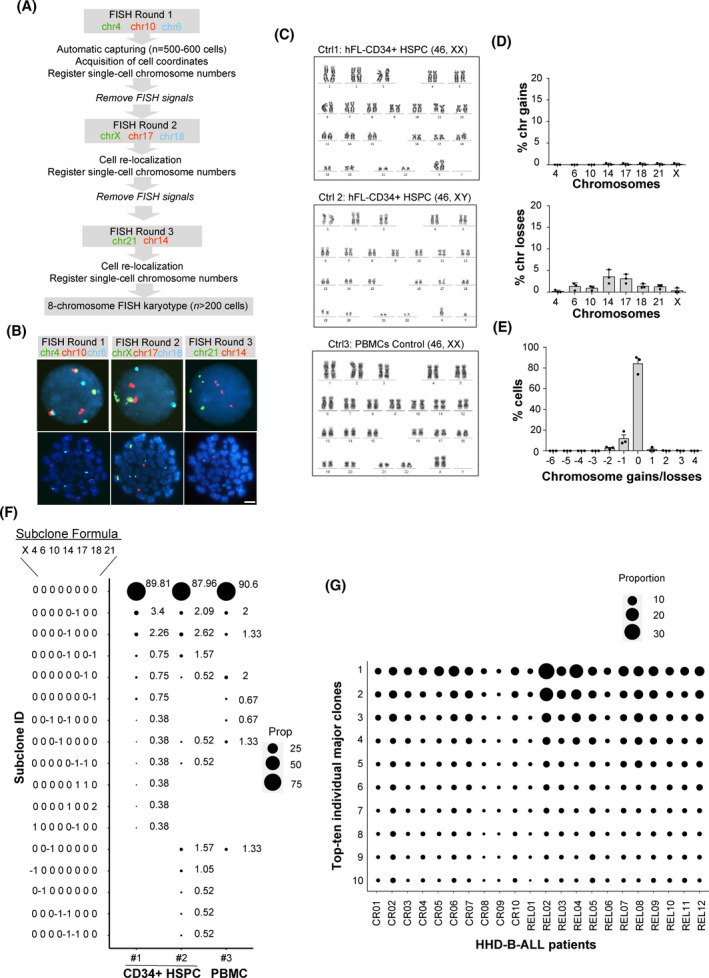
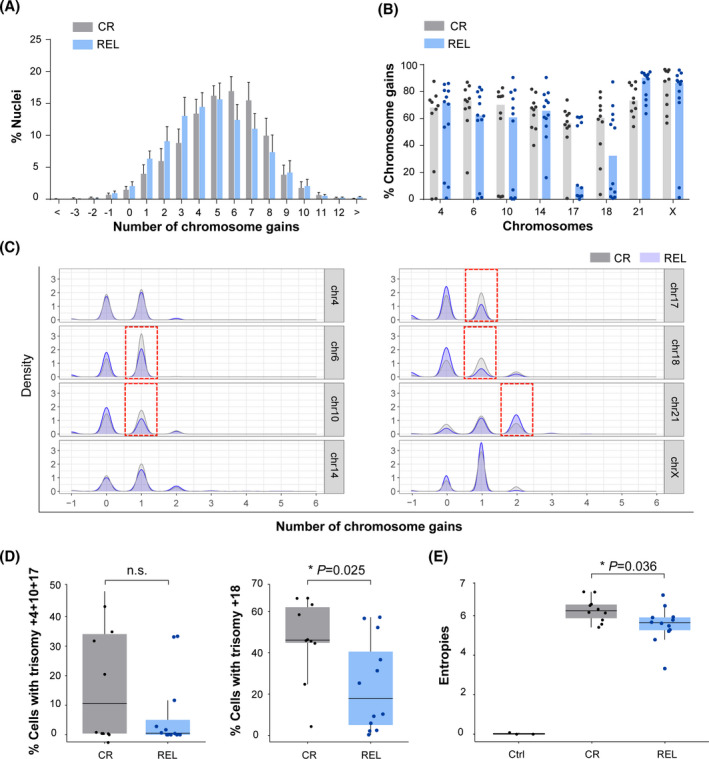
B-cell acute lymphoblastic leukemia (B-ALL) is the commonest childhood cancer. High hyperdiploidy (HHD) identifies the most frequent cytogenetic subgroup in childhood B-ALL. Although hyperdiploidy represents an important prognostic factor in childhood B-ALL, the specific chromosome gains with prognostic value in HHD-B-ALL remain controversial, and the current knowledge about the hierarchy of chromosome gains, clonal heterogeneity and chromosomal instability in HHD-B-ALL remains very limited. We applied automated sequential-iFISH coupled with single-cell computational modeling to identify the specific chromosomal gains of the eight typically gained chromosomes in a large cohort of 72 primary diagnostic (DX, n = 62) and matched relapse (REL, n = 10) samples from HHD-B-ALL patients with either favorable or unfavorable clinical outcome in order to characterize the clonal heterogeneity, specific chromosome gains and clonal evolution. Our data show a high degree of clonal heterogeneity and a hierarchical order of chromosome gains in DX samples of HHD-B-ALL. The rates of specific chromosome gains and clonal heterogeneity found in DX samples differ between HHD-B-ALL patients with favorable or unfavorable clinical outcome. In fact, our comprehensive analyses at DX using a computationally defined risk predictor revealed low levels of trisomies +18+10 and low levels of clonal heterogeneity as robust relapse risk factors in minimal residual disease (MRD)-negative childhood HHD-B-ALL patients: relapse-free survival beyond 5 years: 22.1% versus 87.9%, P < 0.0001 and 33.3% versus 80%, P < 0.0001, respectively. Moreover, longitudinal analysis of matched DX-REL HHD-B-ALL samples revealed distinct patterns of clonal evolution at relapse. Our study offers a reliable prognostic sub-stratification of pediatric MRD-negative HHD-B-ALL patients.

Keywords: chromosomal gains; clonal heterogeneity; computational modeling; high-hyperdiploid B-ALL; risk predictors; sequential iFISH.


Conflict of interest statement

The authors declare no conflict of interest.

Figures

Fig. 1
Fig. 1
Clinical outcome and biological features of the high‐hyperdiploid B‐cell acute lymphoblastic leukemia (HHD‐B‐ALL) patients analyzed by seq‐iFISH. (A) Time of follow‐up after diagnosis (DX) of the HHD‐B‐ALL patients analyzed by seq‐iFISH. Complete remission (CR) denotes those patients who remained disease‐free after a minimum of 5 years of follow‐up after treatment denoted as a dashed red line (n = 10). Relapse (REL) denotes those patients who relapsed within this timeframe (except one patient who relapsed after 7 years; n = 12). Light and dark gray bars represent follow‐up in CR and after relapse, respectively. Arrow heads depict the time of relapse. † denotes patient's death. (B,C) age (B) and WBC (C) of CR and REL patients. Bars represent the mean values of each group and the error bars represent the standard error of the mean (SEM). Each dot represents an individual patient. Two‐sided unpaired t‐test. [Colour figure can be viewed at wileyonlinelibrary.com]
Fig. 2
Fig. 2
Reliability of the seq‐iFISH analyses employed for detection of clonal heterogeneity in high‐hyperdiploid B‐cell acute lymphoblastic leukemia (HHD‐B‐ALL). (A) Scheme depicting the seq‐iFISH stepwise analysis. (B) Representative images of consecutive FISH rounds using the indicated chromosomes in the same cell. Top and bottom panels show interphase and metaphase cells, respectively. Scale bar = 10 μm. (C) Karyotypes of the indicated control (ctrl) samples; n = 20 metaphases per sample. (D) Frequency of chromosomal gains (top) and losses (bottom) observed for each chromosome by seq‐iFISH analysis in control samples. (E) Modal number (MN) of chromosomal gains/losses in control samples. Graphs represent the mean value of three independent experiments and error bars represent the SEM; n = 200 nuclei were analyzed per experiment. (F) Single‐cell analysis showing the size of diploid and ‘false aneuploid’ clones observed in the control samples. Subclone formulas/codes on the left indicate the number of gains (1 or 2) or losses (−1) for the chromosomes X, 4, 6, 10, 14, 17, 18, and 21, respectively; n = 150 nuclei, 265 nuclei and 191 nuclei for controls 1, 2, and 3, respectively. (G) Single‐cell analysis showing the 10 major clones observed at diagnosis (DX) in all HHD‐B‐ALL patients; n = a minimum of 200 nuclei per sample. The size of the black circles in (F and G) represents the proportion of cells with the indicated subclone in each sample. [Colour figure can be viewed at wileyonlinelibrary.com]
Fig. 3
Fig. 3
Differential rates of specific chromosome gains and clonal heterogeneity in diagnostic (DX) samples from complete remission (CR) and relapsed (REL) high‐hyperdiploid B‐cell acute lymphoblastic leukemia (HHD‐B‐ALL patients). (A) Number of total chromosomal gains in DX samples from CR and REL HHD‐B‐ALL patients. Graphs represent the mean value and error bars represent the SEM. (B) Frequency of chromosomal gains for the indicated chromosomes in DX samples from CR and REL HHD‐B‐ALL patients. Graphs represent the median values of total gains for each chromosome and dots represent the values obtained for individual patients. (C) Chromosomal gains as observed by density values in single‐cell computational analysis for the indicated chromosomes distinguishing the contribution of trisomies and tetrasomies. Red boxes indicate the differences observed in DX samples from CR and REL HHD‐B‐ALL patients. (D) Box plots comparing the frequency of cells harboring triple trisomies 4, 10, and 17 (left) and single trisomy 18 (right) between DX samples from CR and REL HHD‐B‐ALL patients. (E) Box plots comparing the clonal heterogeneity as observed by Shannon entropy values of data between controls (ctrl) and DX samples from CR and REL HHD‐B‐ALL patients. Boxes represent the quartiles 25–75 and horizontal lines represent the mean value. Error bars represent the standard deviation (SD); n = 3 ctrl, n = 10 CR, and n = 12 REL HHD B‐ALL patients; two‐sided unpaired t‐test. *P‐value < 0.05. [Colour figure can be viewed at wileyonlinelibrary.com]
Fig. 4
Fig. 4
High‐hyperdiploid B‐cell acute lymphoblastic leukemia (HHD‐B‐ALL) shows hierarchical chromosome gains without specific clones associated with relapse. (A) Heatmaps depicting the acquisition of chromosomal gains in all the cells analyzed in diagnostic (DX) samples from complete remission (CR; left; n = 2983 cells) and relapse (REL; right; n = 3142 cells) HHD‐B‐ALL patients who had achieved minimal residual disease (MRD)‐negativity post‐induction therapy. Lines represent individual clones and columns represent individual chromosomes. The number (value) of chromosomal gains per clone is represented as different red color intensities. (B) Summarized dendrograms using data from (A). Euclidean distances are shown for each cluster identified. (C) Heatmap depicting the unique subclones in control (Ctrl), CR and REL HHD‐B‐ALL samples. The color code represents the row Z‐score for individual clones. [Colour figure can be viewed at wileyonlinelibrary.com]
Fig. 5
Fig. 5
Trisomies 18 and 10 and clonal heterogeneity are robust relapse risk predictors in high‐hyperdiploid B‐cell acute lymphoblastic leukemia (HHD‐B‐ALL) who had achieved minimal residual disease (MRD)‐negativity post‐induction therapy. (A) Contribution of the indicated trisomies at predicting clinical outcome; complete remission (CR) versus relapse (REL). Dots represent individual patient Gini importance values. Boxes represent the quartiles 25–75 and horizontal lines represent the mean value. Error bars represent the SD; n = 10 CR and 12 REL patient samples. (B) Stress tests on the indicated predictors for risk classification at diagnosis (DX) of HHD‐B‐ALL patients (n = 22). Blue bars represent the number of patients properly classified according to disease outcome (CR versus REL) and red bars the number of patients erroneously classified. (C) Classification based on DX samples of HHD‐B‐ALL patients according to risk predictor 3 as either CR (favorable, % trisomies 18 and 10 > 40%) or REL (unfavorable, % trisomies 18 and 10 < 40%) risk groups. Number and percentage of properly classified patients are indicated in the right. (D) Frequency of the indicated chromosome gains in an independent and blind validation cohort of DX samples of favorable (CR, n = 33) and unfavorable (REL, n = 17) HHD‐B‐ALL patients by iFISH analysis of chromosomes 18 and 10. Graphs represent the median values and dots represent the values obtained for individual patients; n = 200 nuclei per sample. (E) Classification of HHD‐B‐ALL patients as CR or REL using the chr18‐chr10 risk predictor (predictor 3) after blind FISH analyses. The DX samples from the validation cohort were initially blind‐grouped as favorable or unfavorable risk based on chr18–chr10 risk predictor results, and then correlated with relapse information (No versus Yes) available from the clinic. 96% (48/50) of patients had achieved MRD negativity after induction therapy. The total number of patients for each group is indicated outside the quadrant. Note that 84% of the 50 HHD‐B‐ALL patients used in this blind and independent validation cohort were properly classified using predictor 3. (F,G) Kaplan–Meier curves for relapse‐free survival (RFS) of HHD‐B‐ALL patients grouped according to the chr18–chr10 risk predictor (F) and clonal heterogeneity defined by the percentage of major clone (PMC) (G) after blind FISH analyses; n = 50 HHD‐B‐ALL samples collected at diagnosis (DX). Analyses for panels (F and G) were performed with the hazard ratios obtained with cox multivariate analyses. [Colour figure can be viewed at wileyonlinelibrary.com]
Fig. 6
Fig. 6
Longitudinal analysis of matched diagnostic‐relapse high‐hyperdiploid B‐cell acute lymphoblastic leukemia (HHD‐B‐ALL) samples reveals distinct patterns of clonal evolution at REL. (A) Number of total chromosomal gains in matched diagnostic (DX) and relapse (REL) HHD‐B‐ALL samples. Graphs represent the mean value and error bars represent the SEM; n = 20 samples (10 DX and 10 REL). (B) Frequency of chromosomal gains for the indicated chromosomes in matched DX and REL HHD‐B‐ALL samples. Graphs represent the median values and dots represent the values obtained for each single sample. (C) Number of chromosomal gains in matched DX and REL HHD‐B‐ALL samples as observed by density values in single‐cell computational analysis for the indicated chromosomes. (D) Box plot comparing the clonal heterogeneity as observed by Shannon entropy values between matched DX and REL HHD‐B‐ALL samples. Boxes represent the quartiles 25—75 and horizontal lines represent the mean value. Error bars represent the SD; two‐sided paired t‐test. (E) Heatmap depicting the unique subclones in matched DX and REL HHD‐B‐ALL samples. The color code represents the row Z‐score for individual clones. On the top, dendrogram with hierarchical cluster analyses of samples regarding clonal composition similarity. (F) Single‐cell analysis of the major clones observed in matched DX and REL HHD‐B‐ALL samples. Representative analyses of the two different patterns of chromosomal clonal evolution observed, with the major leukemic clones being either shared (top) or distinct (bottom) in matched DX and REL samples. The subclone formulas on the left indicate the number of gains for chromosomes X, 4, 6, 10, 14, 17, 18, and 21, respectively. The size of the black circles represents the proportion of cells showing that indicated subclone in each sample. [Colour figure can be viewed at wileyonlinelibrary.com]

References

    1. Pui CH, Mullighan CG, Evans WE, Relling MV. Pediatric acute lymphoblastic leukemia: where are we going and how do we get there? Blood. 2012;120:1165–74. - PMC - PubMed
    1. Schmiegelow K, Forestier E, Hellebostad M, Heyman M, Kristinsson J, Soderhall S, et al. Long‐term results of NOPHO ALL‐92 and ALL‐2000 studies of childhood acute lymphoblastic leukemia. Leukemia. 2010;24:345–54. - PubMed
    1. Maloney KW, Devidas M, Wang C, Mattano LA, Friedmann AM, Buckley P, et al. Outcome in children with standard‐risk B‐cell acute lymphoblastic leukemia: results of Children's oncology group trial AALL0331. J Clin Oncol. 2020;38:602–12. - PMC - PubMed
    1. Pui CH, Yang JJ, Hunger SP, Pieters R, Schrappe M, Biondi A, et al. Childhood acute lymphoblastic leukemia: progress through collaboration. J Clin Oncol. 2015;33:2938–48. - PMC - PubMed
    1. Smith MA, Altekruse SF, Adamson PC, Reaman GH, Seibel NL. Declining childhood and adolescent cancer mortality. Cancer. 2014;120:2497–506. - PMC - PubMed

Publication types