

Projected resurgence of COVID-19 in the United States in July-December 2021 resulting from the increased transmissibility of the Delta variant and faltering vaccination
- PMID: 35726851
- PMCID: PMC9232215
- DOI: 10.7554/eLife.73584
Projected resurgence of COVID-19 in the United States in July-December 2021 resulting from the increased transmissibility of the Delta variant and faltering vaccination
Abstract
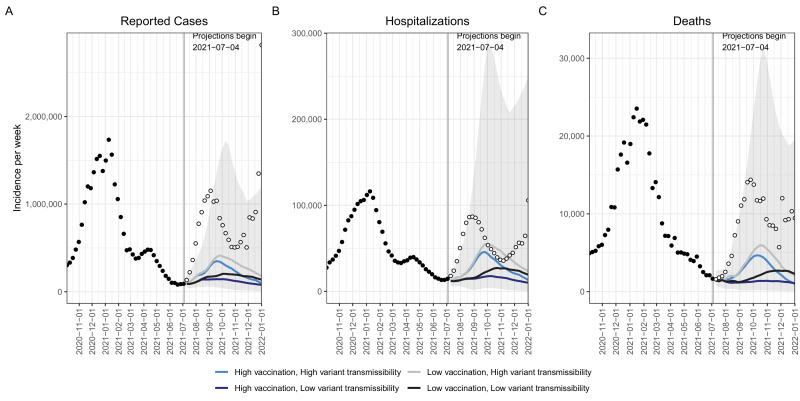
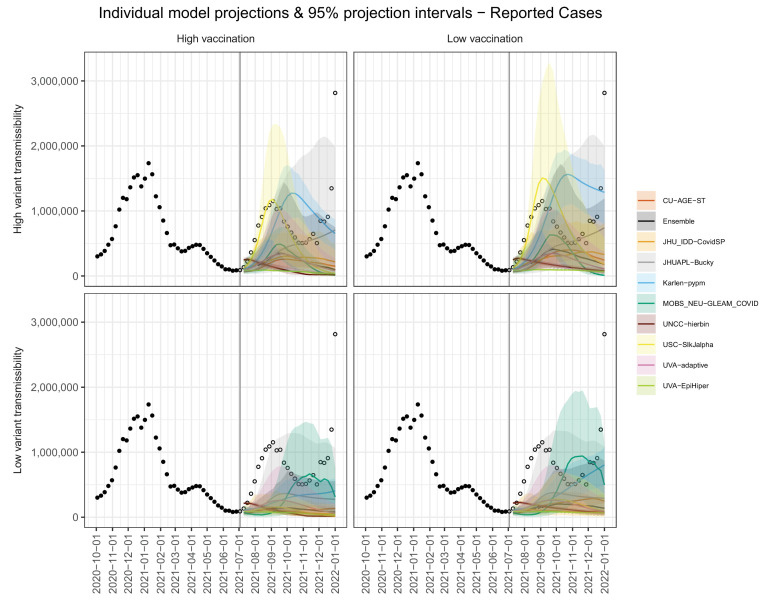
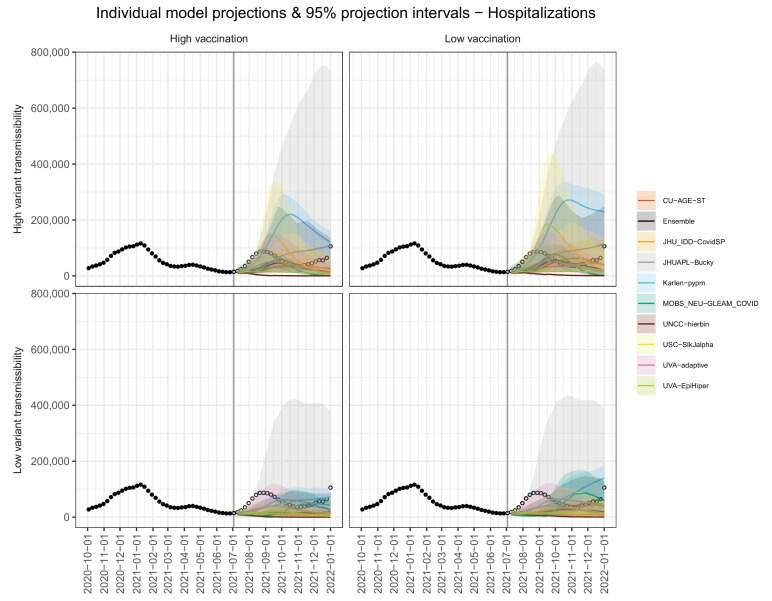
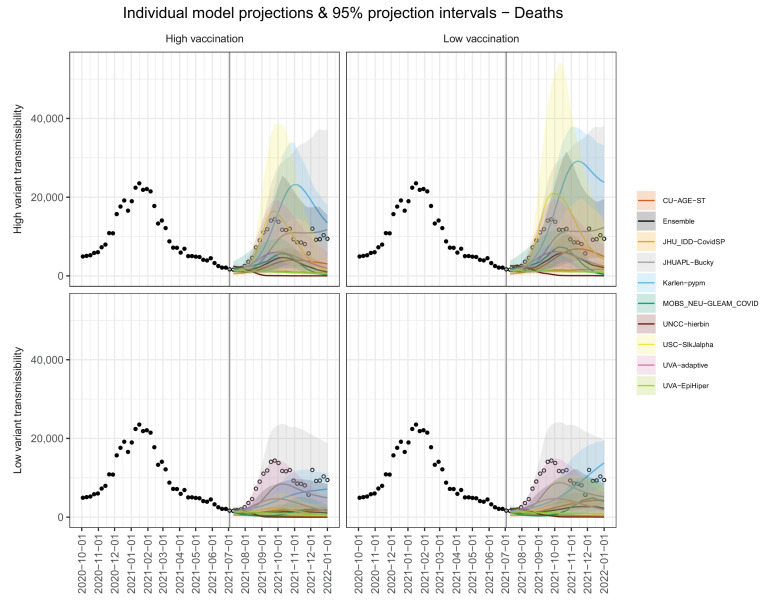
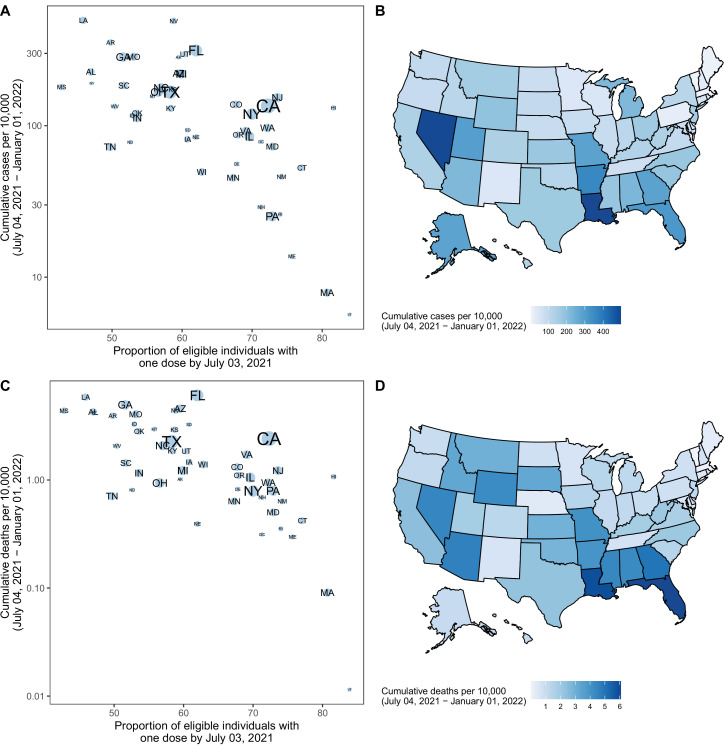
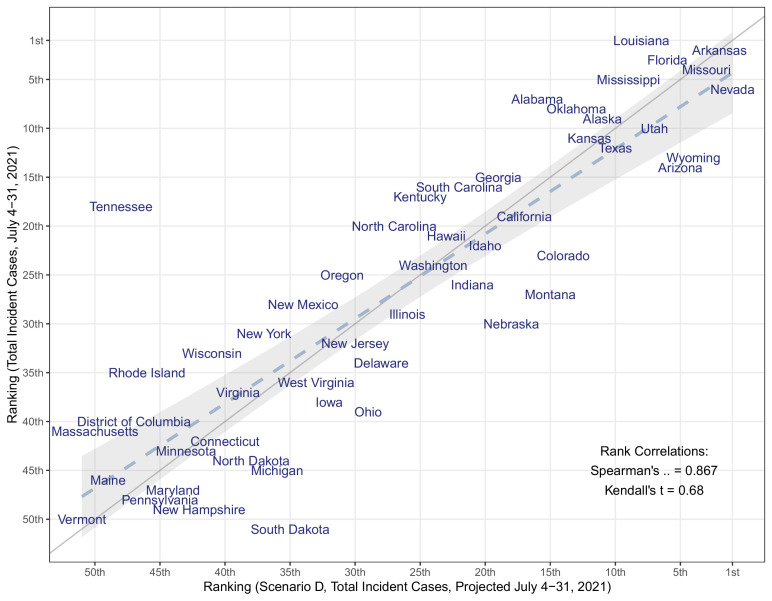
In Spring 2021, the highly transmissible SARS-CoV-2 Delta variant began to cause increases in cases, hospitalizations, and deaths in parts of the United States. At the time, with slowed vaccination uptake, this novel variant was expected to increase the risk of pandemic resurgence in the US in summer and fall 2021. As part of the COVID-19 Scenario Modeling Hub, an ensemble of nine mechanistic models produced 6-month scenario projections for July-December 2021 for the United States. These projections estimated substantial resurgences of COVID-19 across the US resulting from the more transmissible Delta variant, projected to occur across most of the US, coinciding with school and business reopening. The scenarios revealed that reaching higher vaccine coverage in July-December 2021 reduced the size and duration of the projected resurgence substantially, with the expected impacts was largely concentrated in a subset of states with lower vaccination coverage. Despite accurate projection of COVID-19 surges occurring and timing, the magnitude was substantially underestimated 2021 by the models compared with the of the reported cases, hospitalizations, and deaths occurring during July-December, highlighting the continued challenges to predict the evolving COVID-19 pandemic. Vaccination uptake remains critical to limiting transmission and disease, particularly in states with lower vaccination coverage. Higher vaccination goals at the onset of the surge of the new variant were estimated to avert over 1.5 million cases and 21,000 deaths, although may have had even greater impacts, considering the underestimated resurgence magnitude from the model.
Keywords: COVID-19; Delta variant; SARS-CoV-2; disease modeling; epidemiology; global health; human; pandemic; scenario projection.
Conflict of interest statement
ST, CS, MQ, LM, RB, KS, EH, LC, JL, JK, HH, MK, KT, SW, LS, KR, JL, JD, JK, EL, JP, AH, DK, MC, JD, KM, XX, AP, AV, AS, PP, SV, AA, BL, BK, JO, MO, GH, BH, JC, AV, MM, SH, PB, DM, SC, RP, DJ, JT, MG, TY, SP, JH, RS, MB, MJ, CV No competing interests declared, JL has served as an expert witness on cases where the likely length of the pandemic was of issue, JS and Columbia University disclose partial ownership of SK Analytics. Discloses consulting for BNI, MR reports stock ownership in Becton Dickinson & Co, which manufactures medical equipment used in COVID testing, vaccination, and treatment
Figures
Update of
-
Projected resurgence of COVID-19 in the United States in July-December 2021 resulting from the increased transmissibility of the Delta variant and faltering vaccination.medRxiv [Preprint]. 2021 Sep 2:2021.08.28.21262748. doi: 10.1101/2021.08.28.21262748. medRxiv. 2021. Update in: Elife. 2022 Jun 21;11:e73584. doi: 10.7554/eLife.73584. PMID: 34494030 Free PMC article. Updated. Preprint.
References
-
- Allen H, Vusirikala A, Flannagan J, Twohig KA, Zaidi A, Chudasama D, Lamagni T, Groves N, Turner C, Rawlinson C, Lopez-Bernal J, Harris R, Charlett A, Dabrera G, Kall M, COVID-19 Genomics UK COG-UK Consortium Household transmission of COVID-19 cases associated with SARS-CoV-2 delta variant (B.1.617.2): national case-control study. The Lancet Regional Health. Europe. 2022;12:100252. doi: 10.1016/j.lanepe.2021.100252. - DOI - PMC - PubMed
-
- Borchering RK, Viboud C, Howerton E, Smith CP, Truelove S, Runge MC, Reich NG, Contamin L, Levander J, Salerno J, van Panhuis W, Kinsey M, Tallaksen K, Obrecht RF, Asher L, Costello C, Kelbaugh M, Wilson S, Shin L, Gallagher ME, Mullany LC, Rainwater-Lovett K, Lemaitre JC, Dent J, Grantz KH, Kaminsky J, Lauer SA, Lee EC, Meredith HR, Perez-Saez J, Keegan LT, Karlen D, Chinazzi M, Davis JT, Mu K, Xiong X, Pastore Y Piontti A, Vespignani A, Srivastava A, Porebski P, Venkatramanan S, Adiga A, Lewis B, Klahn B, Outten J, Schlitt J, Corbett P, Telionis PA, Wang L, Peddireddy AS, Hurt B, Chen J, Vullikanti A, Marathe M, Healy JM, Slayton RB, Biggerstaff M, Johansson MA, Shea K, Lessler J. Modeling of Future COVID-19 Cases, Hospitalizations, and Deaths, by Vaccination Rates and Nonpharmaceutical Intervention Scenarios - United States, April-September 2021. MMWR. Morbidity and Mortality Weekly Report. 2021;70:719–724. doi: 10.15585/mmwr.mm7019e3. - DOI - PMC - PubMed
-
- Carnegie Mellon University Delphi Group COVIDcast. 2021. [May 29, 2021]. https://delphi.cmu.edu/covidcast/indicator/?date=20210703&sensor=fb-surv...
-
- Centers for Disease Control and Prevention Guidance for COVID-19 Prevention in K-12 Schools. Centers for Disease Control and Prevention. 2021a https://www.cdc.gov/coronavirus/2019-ncov/community/schools-childcare/k-...
-
- Centers for Disease Control and Prevention COVID Data Tracker. 2021b. [June 19, 2021]. https://covid.cdc.gov/covid-data-tracker/#nowcast
Publication types
MeSH terms
Supplementary concepts
Grants and funding
LinkOut - more resources
Full Text Sources
Medical
Research Materials
Miscellaneous
