. 2022 Aug 30;13(4):e0005222.
doi: 10.1128/mbio.00052-22. Epub 2022 Jun 21.

Bacterial, Phytoplankton, and Viral Distributions and Their Biogeochemical Contexts in Meromictic Lake Cadagno Offer Insights into the Proterozoic Ocean Microbial Loop

Affiliations

Bacterial, Phytoplankton, and Viral Distributions and Their Biogeochemical Contexts in Meromictic Lake Cadagno Offer Insights into the Proterozoic Ocean Microbial Loop

Jaspreet S Saini et al. mBio. .

Abstract

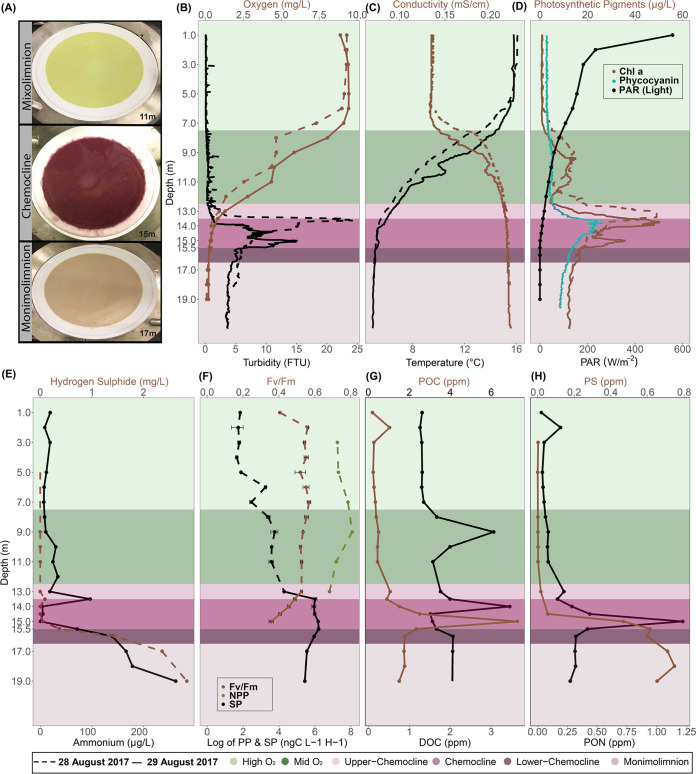
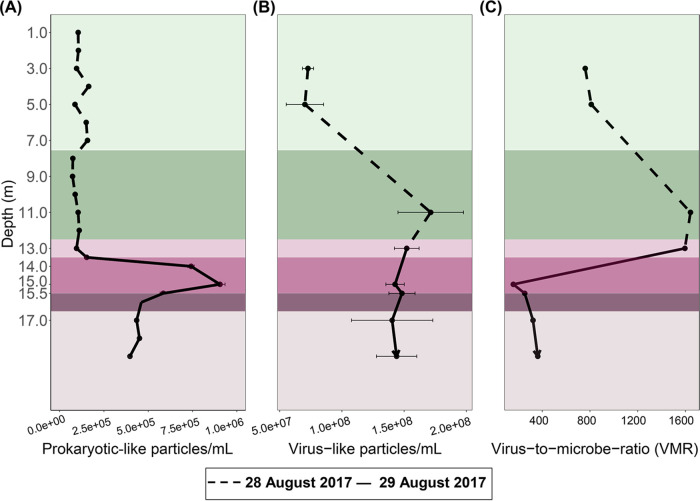
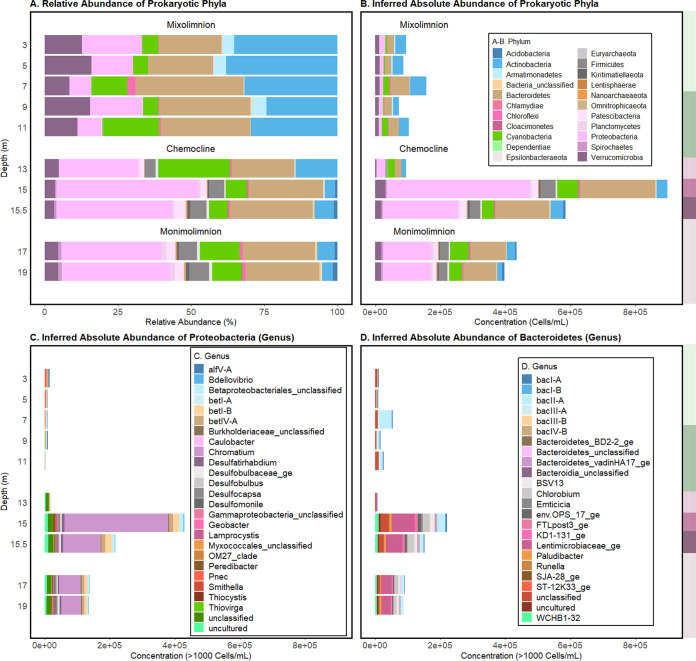
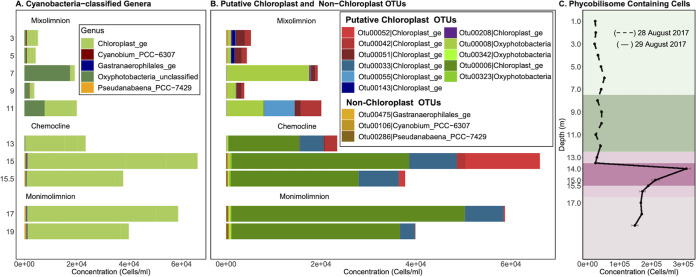
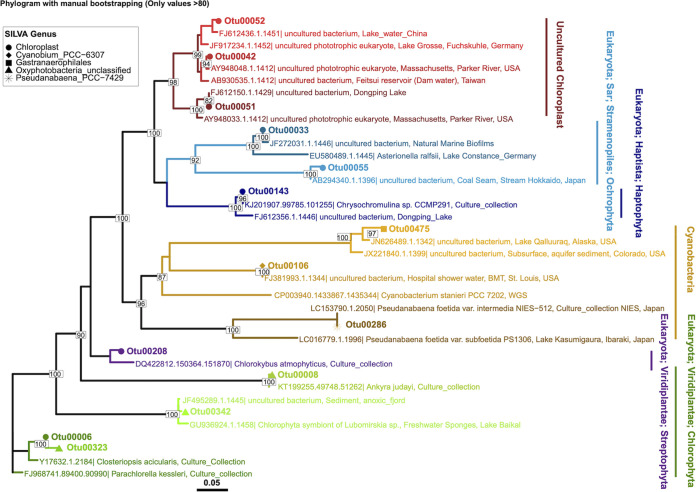
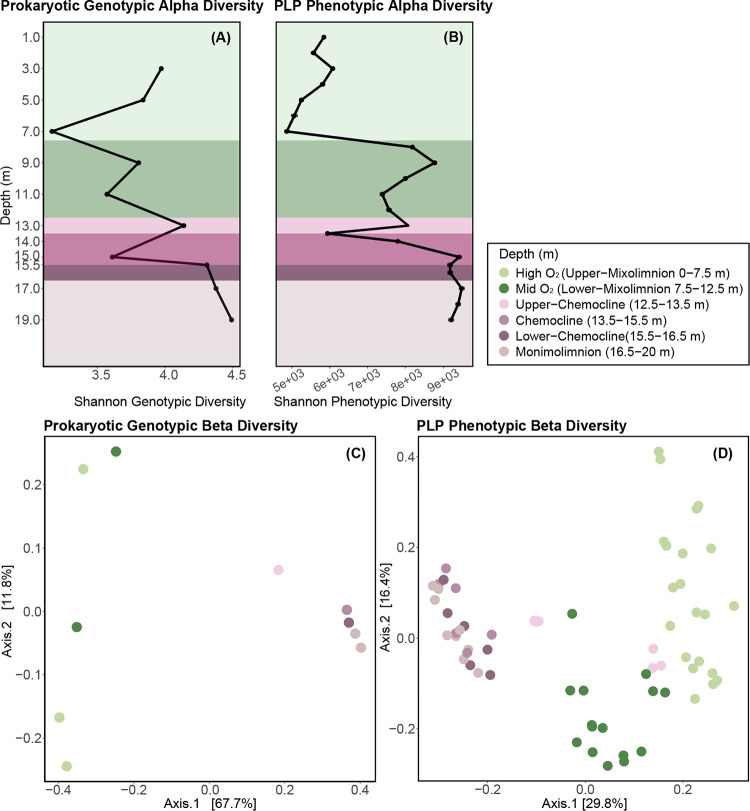
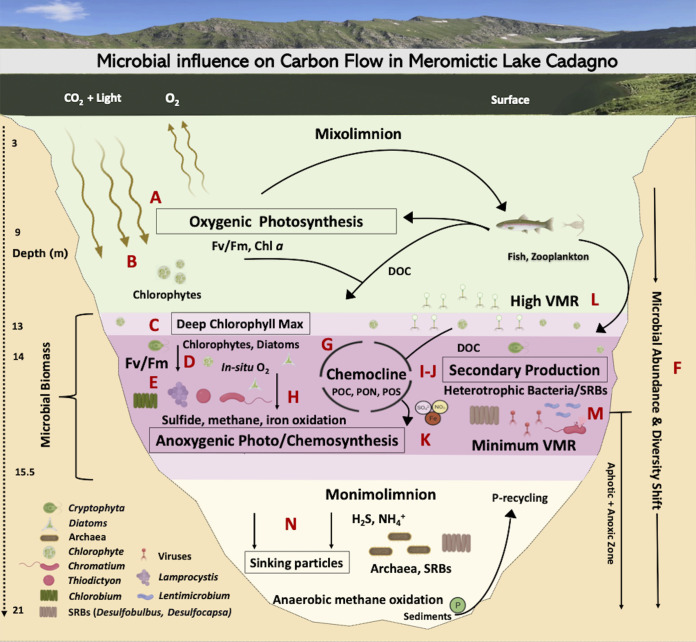
Lake Cadagno, a permanently stratified high-alpine lake with a persistent microbial bloom in its chemocline, has long been considered a model for the low-oxygen, high-sulfide Proterozoic ocean. Although the lake has been studied for over 25 years, the absence of concerted study of the bacteria, phytoplankton, and viruses, together with primary and secondary production, has hindered a comprehensive understanding of its microbial food web. Here, the identities, abundances, and productivity of microbes were evaluated in the context of Lake Cadagno biogeochemistry. Photosynthetic pigments together with 16S rRNA gene phylogenies suggest the prominence of eukaryotic phytoplankton chloroplasts, primarily chlorophytes. Chloroplasts closely related to those of high-alpine-adapted Ankyra judayi persisted with oxygen in the mixolimnion, where photosynthetic efficiency was high, while chloroplasts of Closteriopsis-related chlorophytes peaked in the chemocline and monimolimnion. The anoxygenic phototrophic sulfur bacterium Chromatium dominated the chemocline along with Lentimicrobium, a genus of known fermenters. Secondary production peaked in the chemocline, which suggested that anoxygenic primary producers depended on heterotrophic nutrient remineralization. The virus-to-microbe ratio peaked with phytoplankton abundances in the mixolimnion and were at a minimum where Chromatium abundance was highest, trends that suggest that viruses may play a role in the modulation of primary production. Through the combined analysis of bacterial, eukaryotic, viral, and biogeochemical spatial dynamics, we provide a comprehensive synthesis of the Lake Cadagno microbial loop. This study offers a new ecological perspective on how biological and geochemical connections may have occurred in the chemocline of the Proterozoic ocean, where eukaryotic microbial life is thought to have evolved. IMPORTANCE As a window into the past, this study offers insights into the potential role that microbial guilds may have played in the production and recycling of organic matter in ancient Proterozoic ocean chemoclines. The new observations described here suggest that chloroplasts of eukaryotic algae were persistent in the low-oxygen upper chemocline along with the purple and green sulfur bacteria known to dominate the lower half of the chemocline. This study provides the first insights into Lake Cadagno's viral ecology. High viral abundances suggested that viruses may be essential components of the chemocline, where their activity may result in the release and recycling of organic matter. The integration of diverse geochemical and biological data types provides a framework that lays the foundation to quantitatively resolve the processes performed by the discrete populations that comprise the microbial loop in this early anoxic ocean analogue.

Keywords: Lake Cadagno; Proterozoic; ancient ocean; meromictic; microbial loop; viral ecology.


Conflict of interest statement

The authors declare no conflict of interest.

Figures

FIG 1
FIG 1
Depth profiles of biogeochemical parameters of Lake Cadagno. Dashed and solid lines represent 28 and 29 August 2017, respectively. Standard deviations for each sample are indicated by horizontal bars. (A) Photographs of biomass collected on 0.22-μm (142-mm-diameter) filters from the Lake Cadagno mixolimnion, chemocline, and monimolimnion strata. (B to F) Depth profiles of oxygen and turbidity (B), conductivity and temperature (C), Chl a, phycocyanin, and photosynthetically active radiation (PAR) (D), hydrogen sulfide and ammonium concentrations (E), net primary production (NPP) and secondary production (SP) rates (F), particulate organic carbon (POC) and dissolved organic carbon (DOC) concentrations (G), and particulate sulfur (PS) and particulate organic nitrogen (PON) concentrations (H). In panels B to H, the high O2 mixolimnion, mid O2 mixolimnion, low O2 mixolimnion-chemocline transition zone, chemocline, lower-chemocline, and anoxic monimolimnion layers are indicated by light green, dark green, light lilac, lilac, dark lilac, and light brown backgrounds, respectively.
FIG 2
FIG 2
Dashed and solid lines represent 28 and 29 August 2017, respectively. Standard deviations for each sample are indicated by horizontal bars. (A to C) Abundances of prokaryote-like particles (A) and free virus-like particles (B) from flow cytometry analyses and the virus-to-microbe ratio as VLP/PLP (C).
FIG 3
FIG 3
(A and B) Relative (OTU count scaled by total OTUs) (A) and inferred absolute (OTU count scaled by total FCM PLP counts [35]) (B) abundances of prokaryotic phyla at the sampled depths in Lake Cadagno. (C) Genera in the Proteobacteria phylum. (D) Genera in the Bacteroidetes phylum. To the right of each panel, the high O2 mixolimnion, mid O2 mixolimnion, low O2 mixolimnion-chemocline transition zone, chemocline, lower-chemocline, and anoxic monimolimnion layers are indicated by light green, dark green, light lilac, lilac, dark lilac, and light brown backgrounds, respectively, and correspond with the depths reported on the left-most y axis.
FIG 4
FIG 4
Abundances and phylogenies of Lake Cadagno phytoplankton based on 16S rRNA gene amplicon sequencing and flow cytometry. Mixolimnion samples (0 to 11.0 m) were collected on day 1, and chemocline and monimolimnion samples (12.0 to 19.0 m) were collected on day 2. Abundances in panels B and C are acquired by scaling 16S rRNA gene read counts by FCM cell counts. (A and B) Inferred concentrations (cells/mL) of OTUs were assigned to the phylum Cyanobacteria, and of those, the inferred concentrations (cells/mL) of OTUs were classified as putative chloroplasts and non-chloroplasts at the genus level (B). (C) Depth profile of phycobilin-containing cell counts based on flow cytometry with a 640-nm laser. The high O2 mixolimnion, mid O2 mixolimnion, low O2 mixolimnion-chemocline transition zone, chemocline, lower-chemocline, and anoxic monimolimnion layers are indicated by light green, dark green, light lilac, lilac, dark lilac, and light brown backgrounds, respectively.
FIG 5
FIG 5
Phylogenetic tree of the representative 16S rRNA gene amplicon sequences of putative chloroplast and nonchloroplast OTUs shown in Fig. 4B assigned as Cyanobacteria, along with their two nearest neighbor sequences from the SILVA database. Clades are color coded consistently with the coloring of OTUs shown in the bar plot of Fig. 4B.
FIG 6
FIG 6
Trends in microbial community genotypic (16S rRNA gene amplicon sequencing, including prokaryotic and chloroplast-related OTUs) and phenotypic (PLP features based on flow cytometry [44]) alpha and beta diversity in Lake Cadagno. (A) Variation in genotypic alpha diversity (Shannon) with depth. (B) Variation in PLP phenotypic alpha diversity (Shannon). Mixolimnion samples (0 to 11.0 m) were collected on day 1, and chemocline and monimolimnion samples (12.0 to 19.0 m) were collected on day 2. Colors of data points represent the depth strata sampled. (C) PCoA represents the genotypic beta diversity dissimilarity (Bray-Curtis distance) of microbial communities. (D) PCoA represents the phenotypic beta diversity dissimilarity (Bray-Curtis distance) of microbial communities.
FIG 7
FIG 7
Microbial loop of meromictic Lake Cadagno. Microbiology icons were created with BioRender.

References

    1. Canfield DE. 1998. A new model for Proterozoic ocean chemistry. Nature 396:450–453. doi:10.1038/24839. - DOI
    1. Johnston DT, Wolfe-Simon F, Pearson A, Knoll AH. 2009. Anoxygenic photosynthesis modulated Proterozoic oxygen and sustained Earth’s middle age. Proc Natl Acad Sci USA 106:16925–16929. doi:10.1073/pnas.0909248106. - DOI - PMC - PubMed
    1. Lyons TW, Reinhard CT, Planavsky NJ. 2014. The rise of oxygen in Earth’s early ocean and atmosphere. Nature 506:307–315. doi:10.1038/nature13068. - DOI - PubMed
    1. Shen Y, Buick R, Canfield DE. 2001. Isotopic evidence for microbial sulphate reduction in the early Archaean era. Nature 410:77–81. doi:10.1038/35065071. - DOI - PubMed
    1. Gulati RD, Zadereev ES, Degermendzhi AG (ed). 2017. Ecology of meromictic lakes. Springer International Publishing, Cham, Switzerland.

Publication types