Review
. 2022 Jul 5;34(7):947-968.
doi: 10.1016/j.cmet.2022.06.003. Epub 2022 Jun 20.

Metabolic cycles and signals for insulin secretion

Affiliations
Review

Metabolic cycles and signals for insulin secretion

Matthew J Merrins et al. Cell Metab. .

Abstract

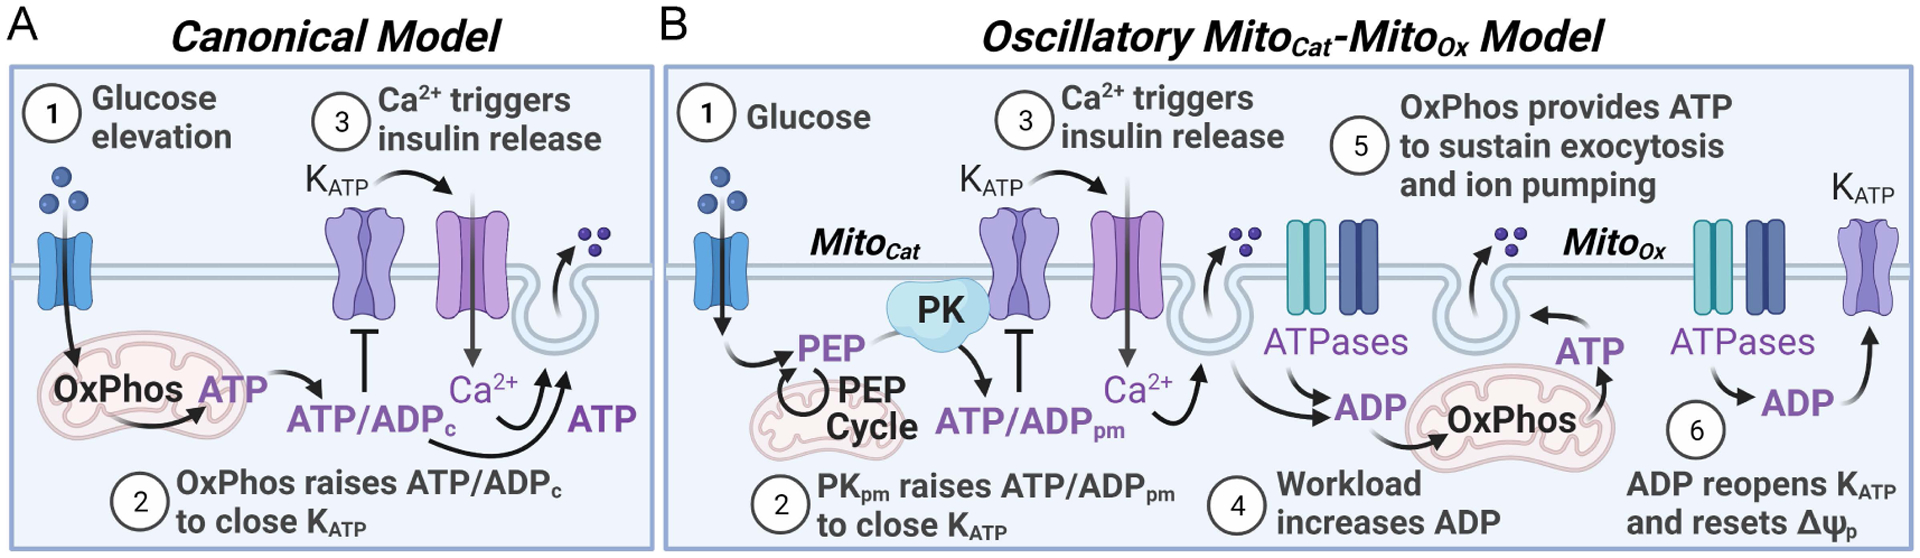
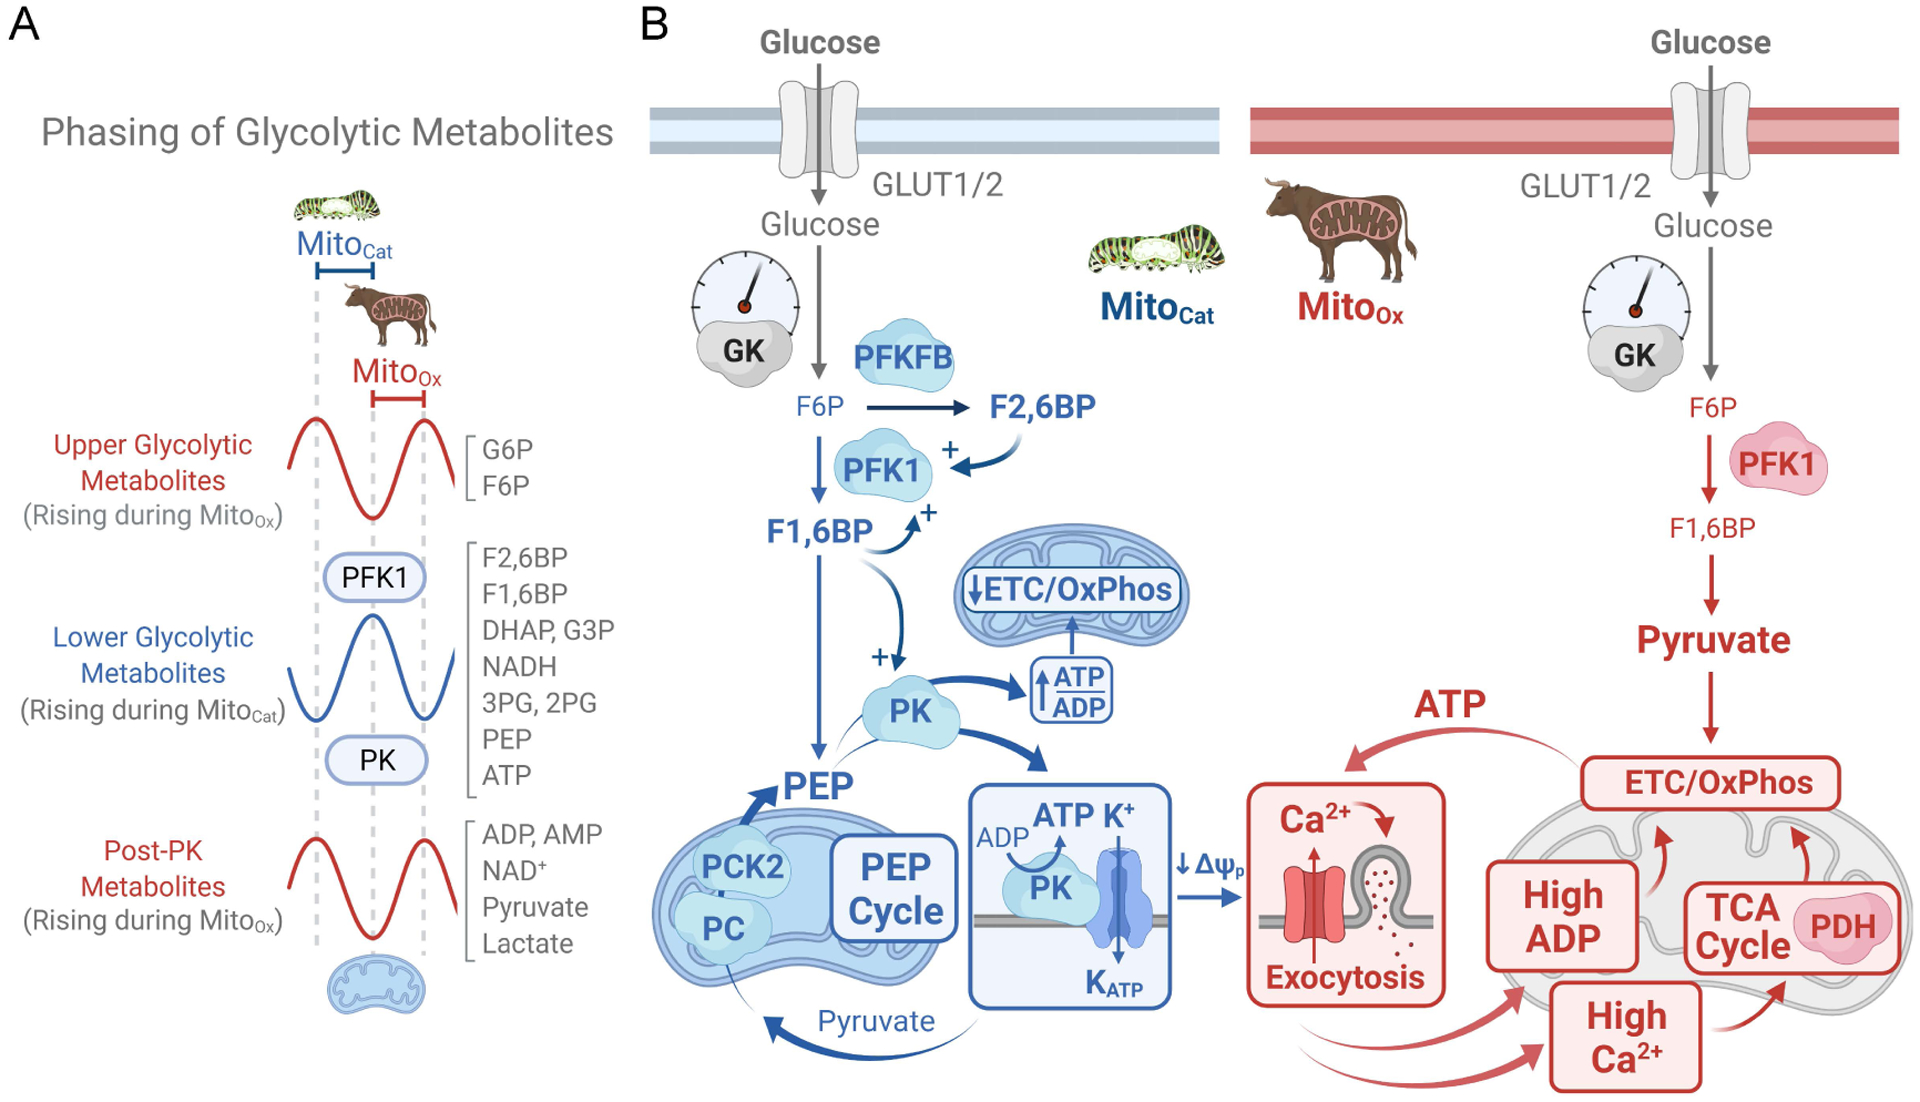
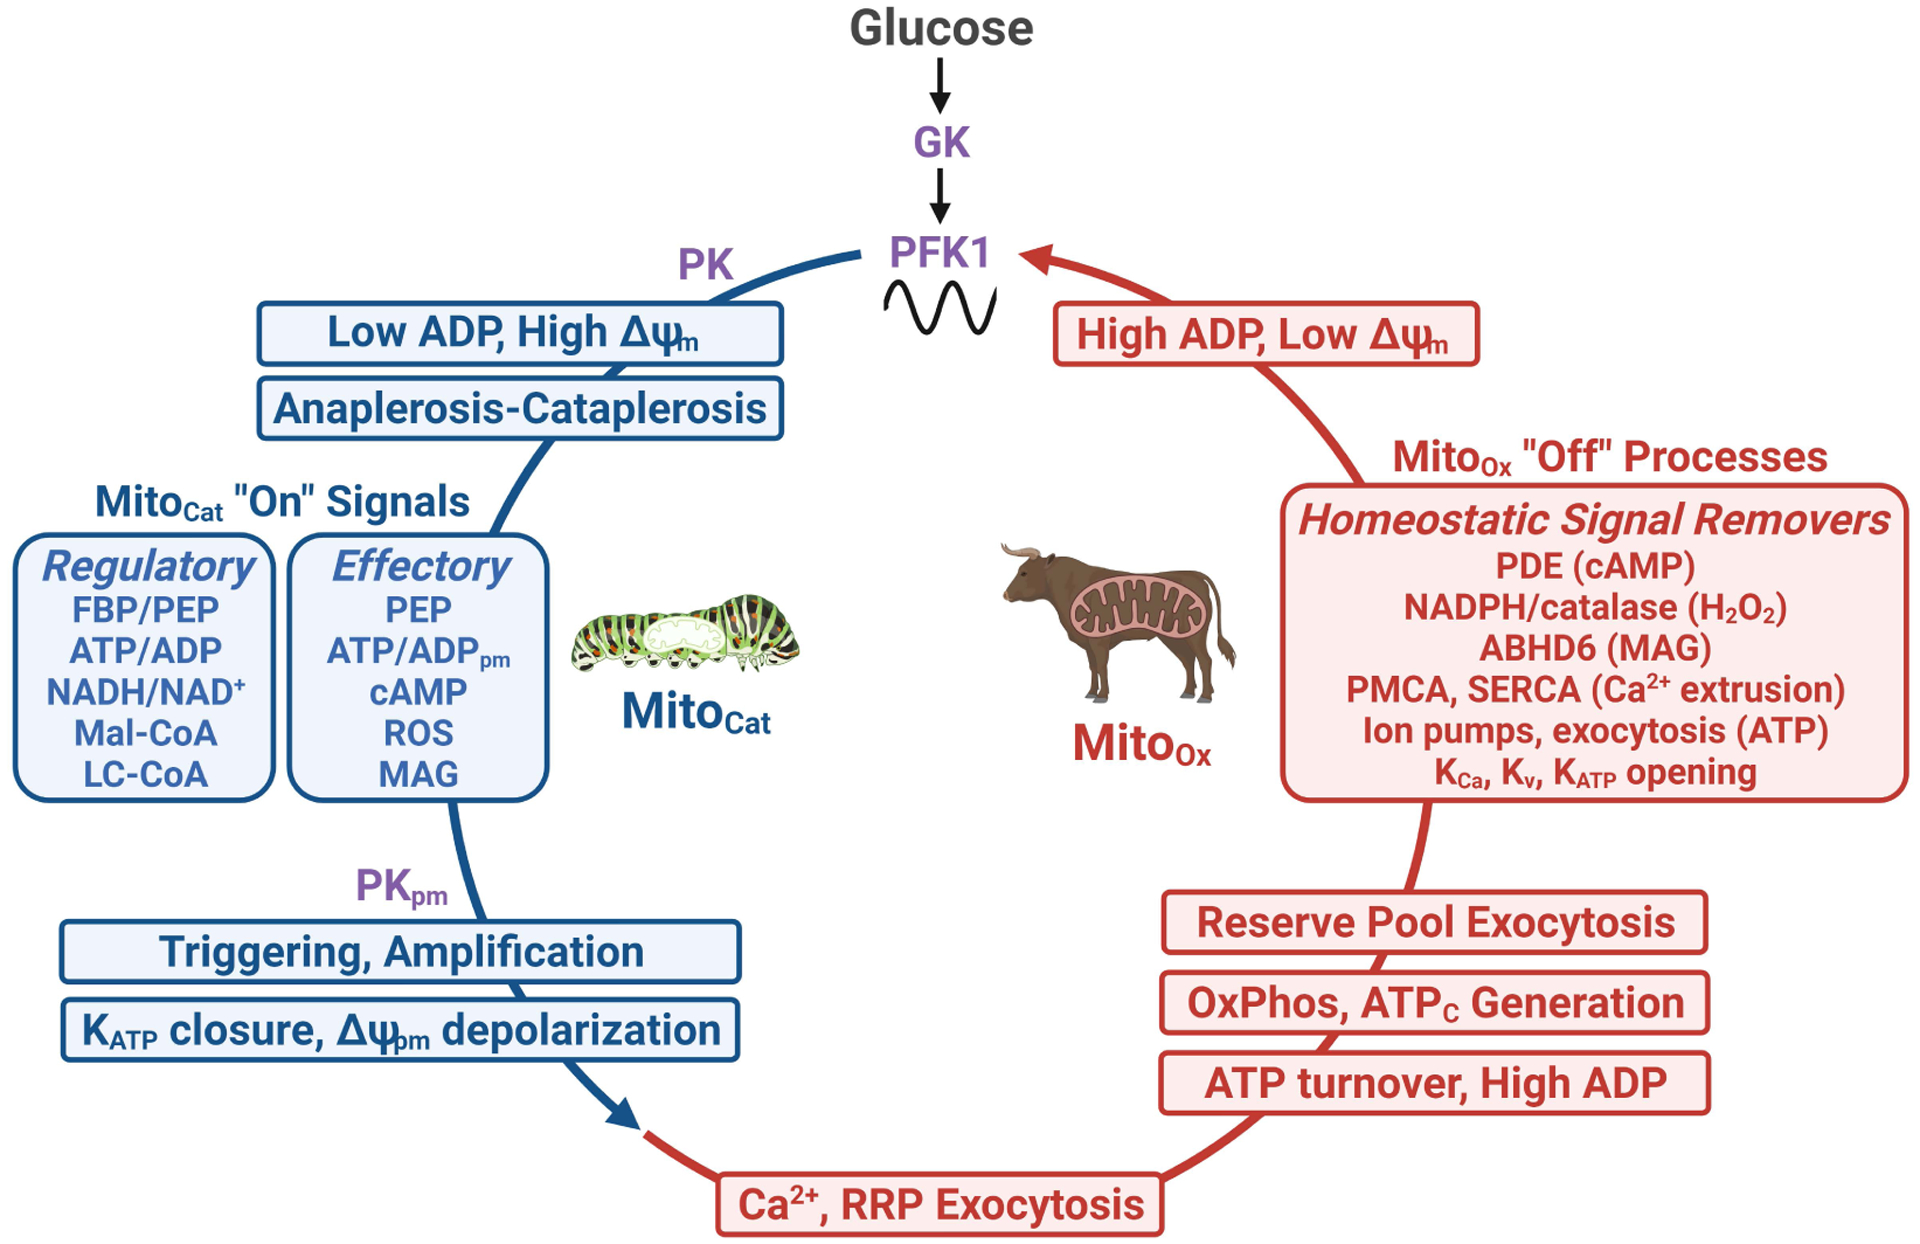
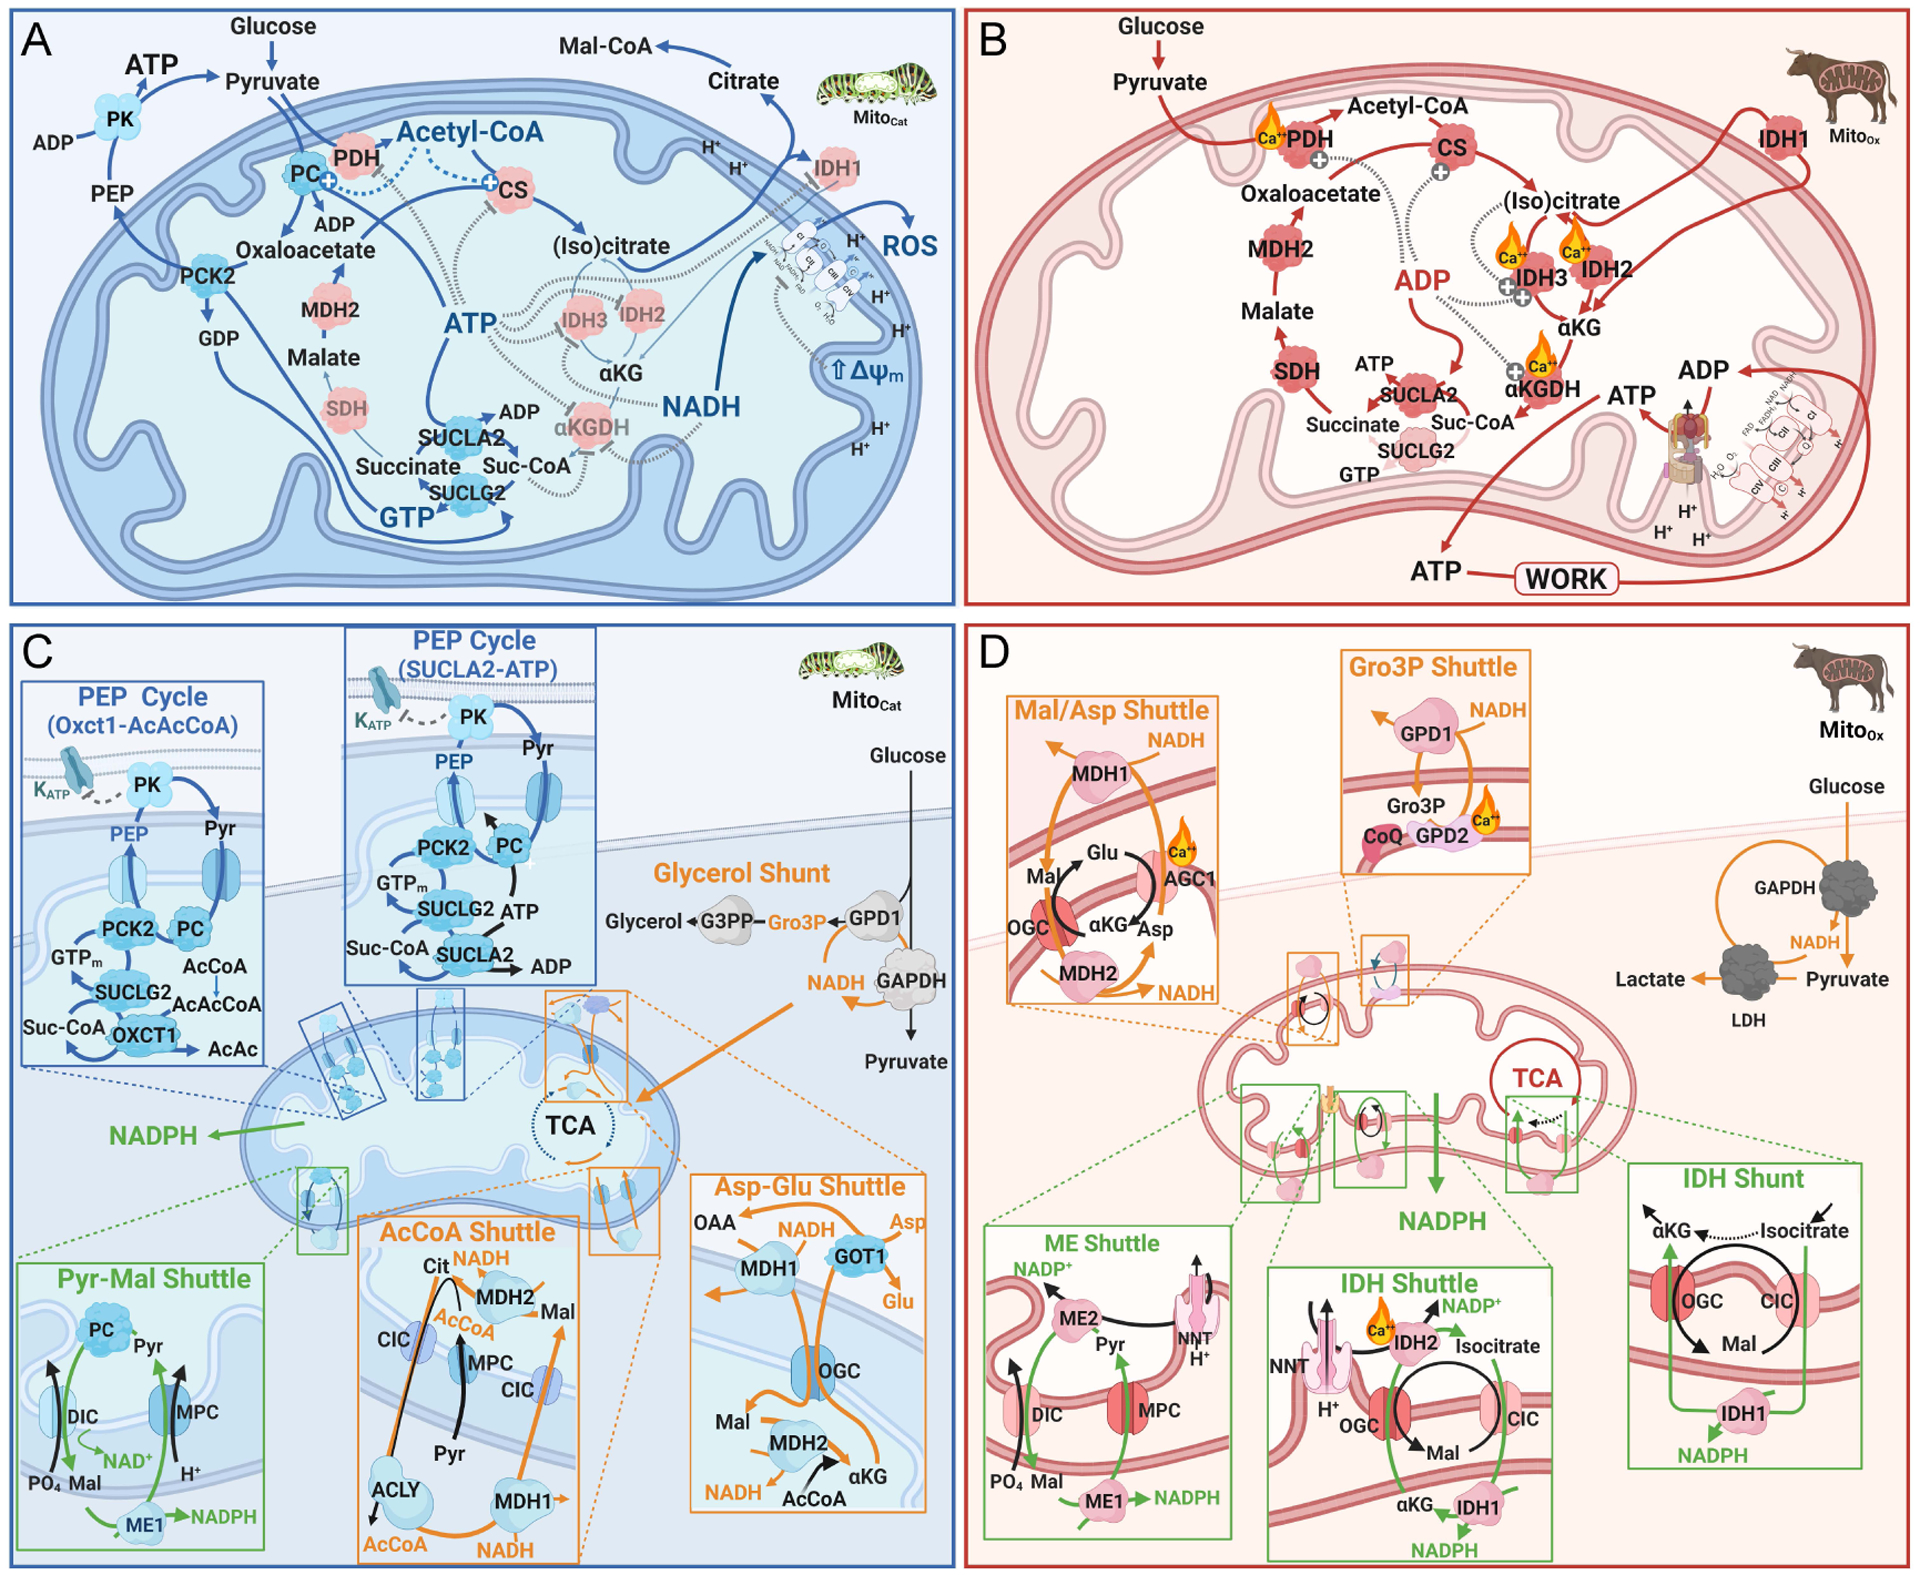
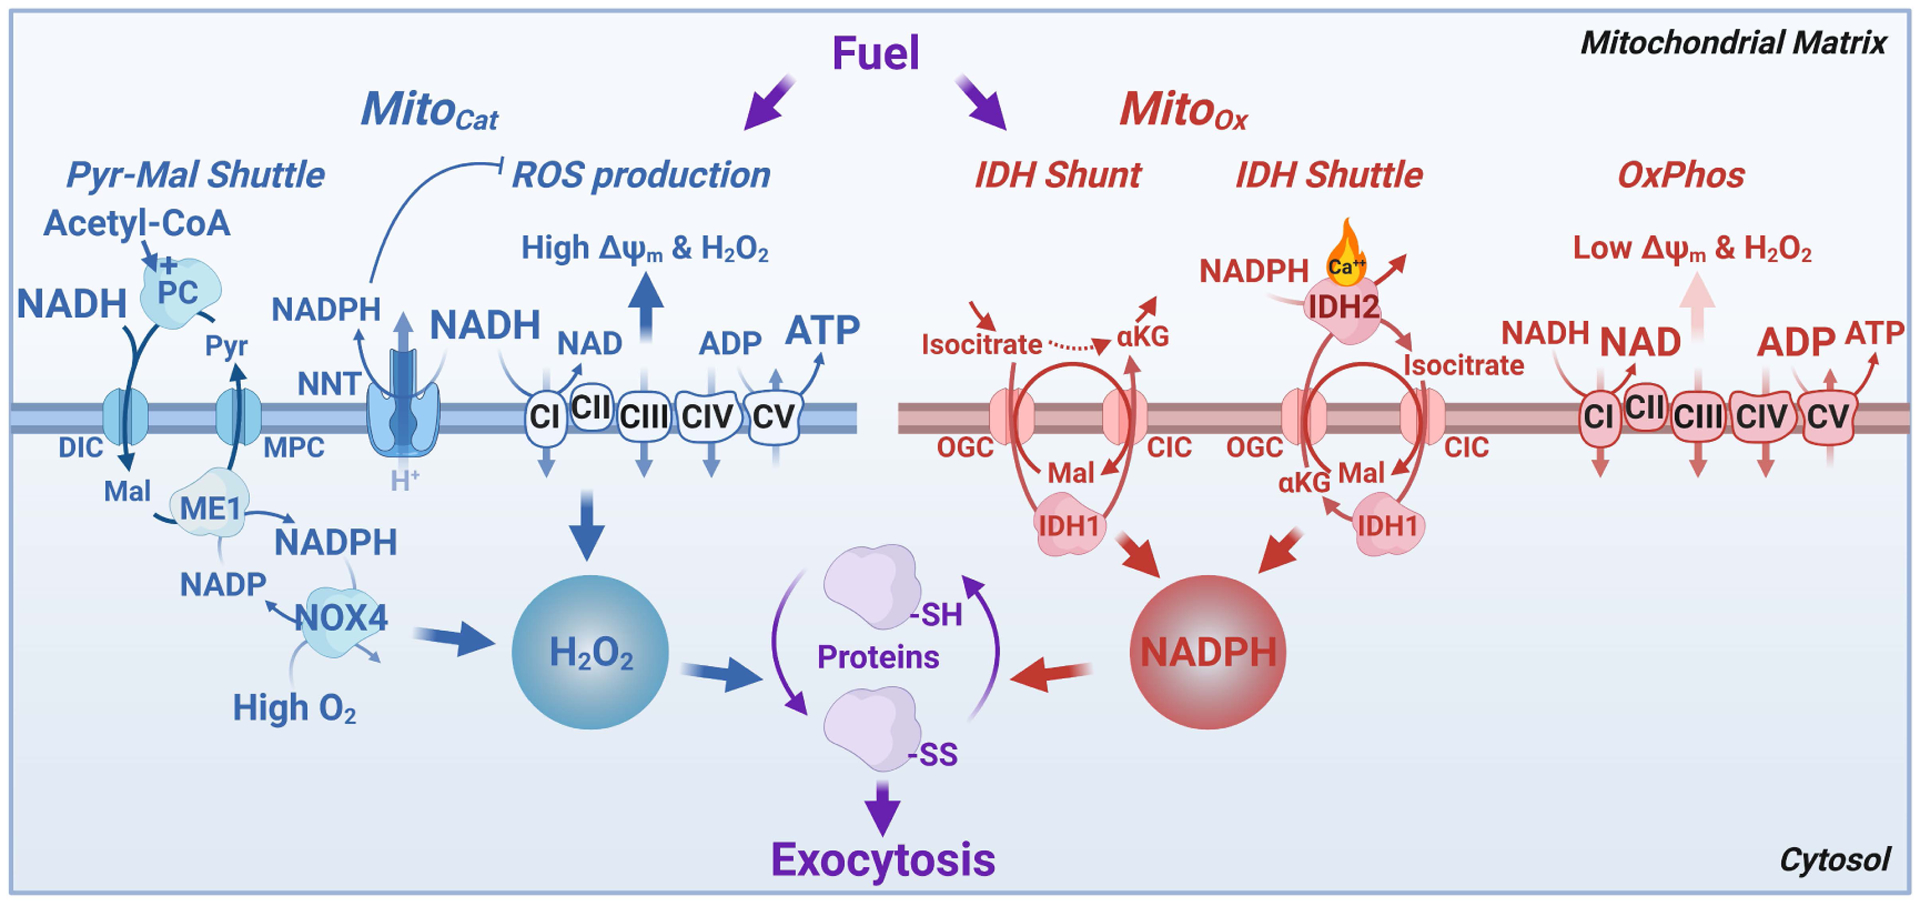
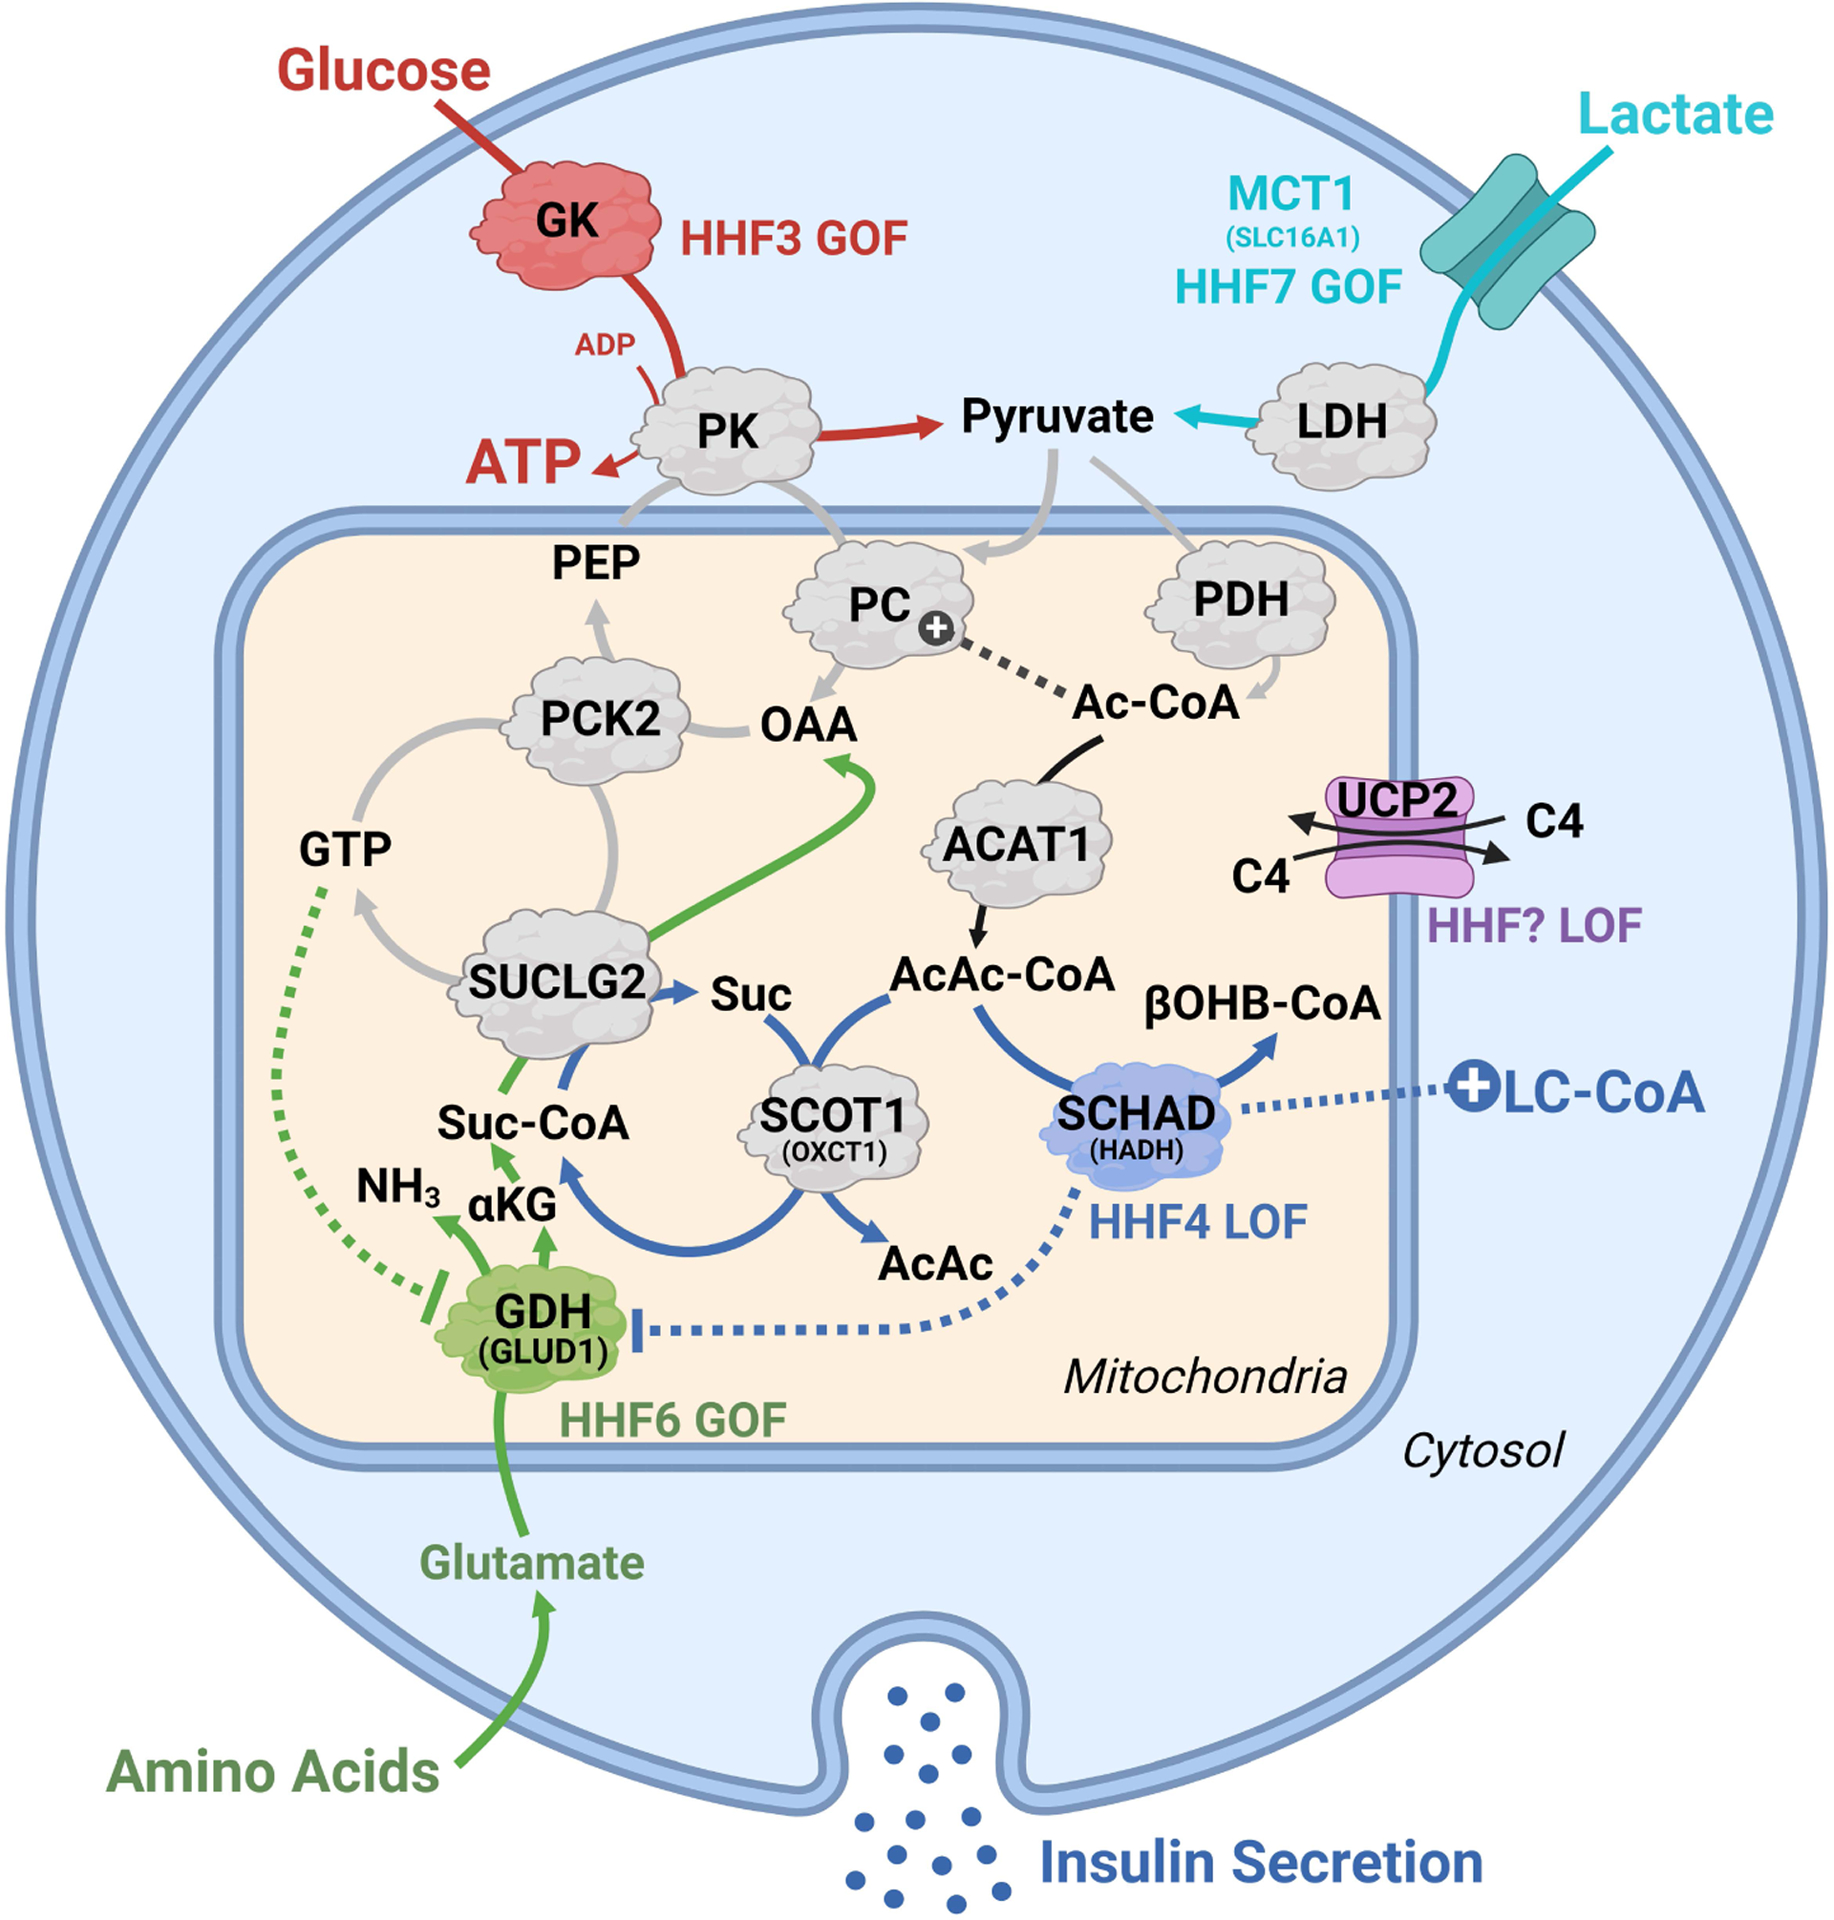
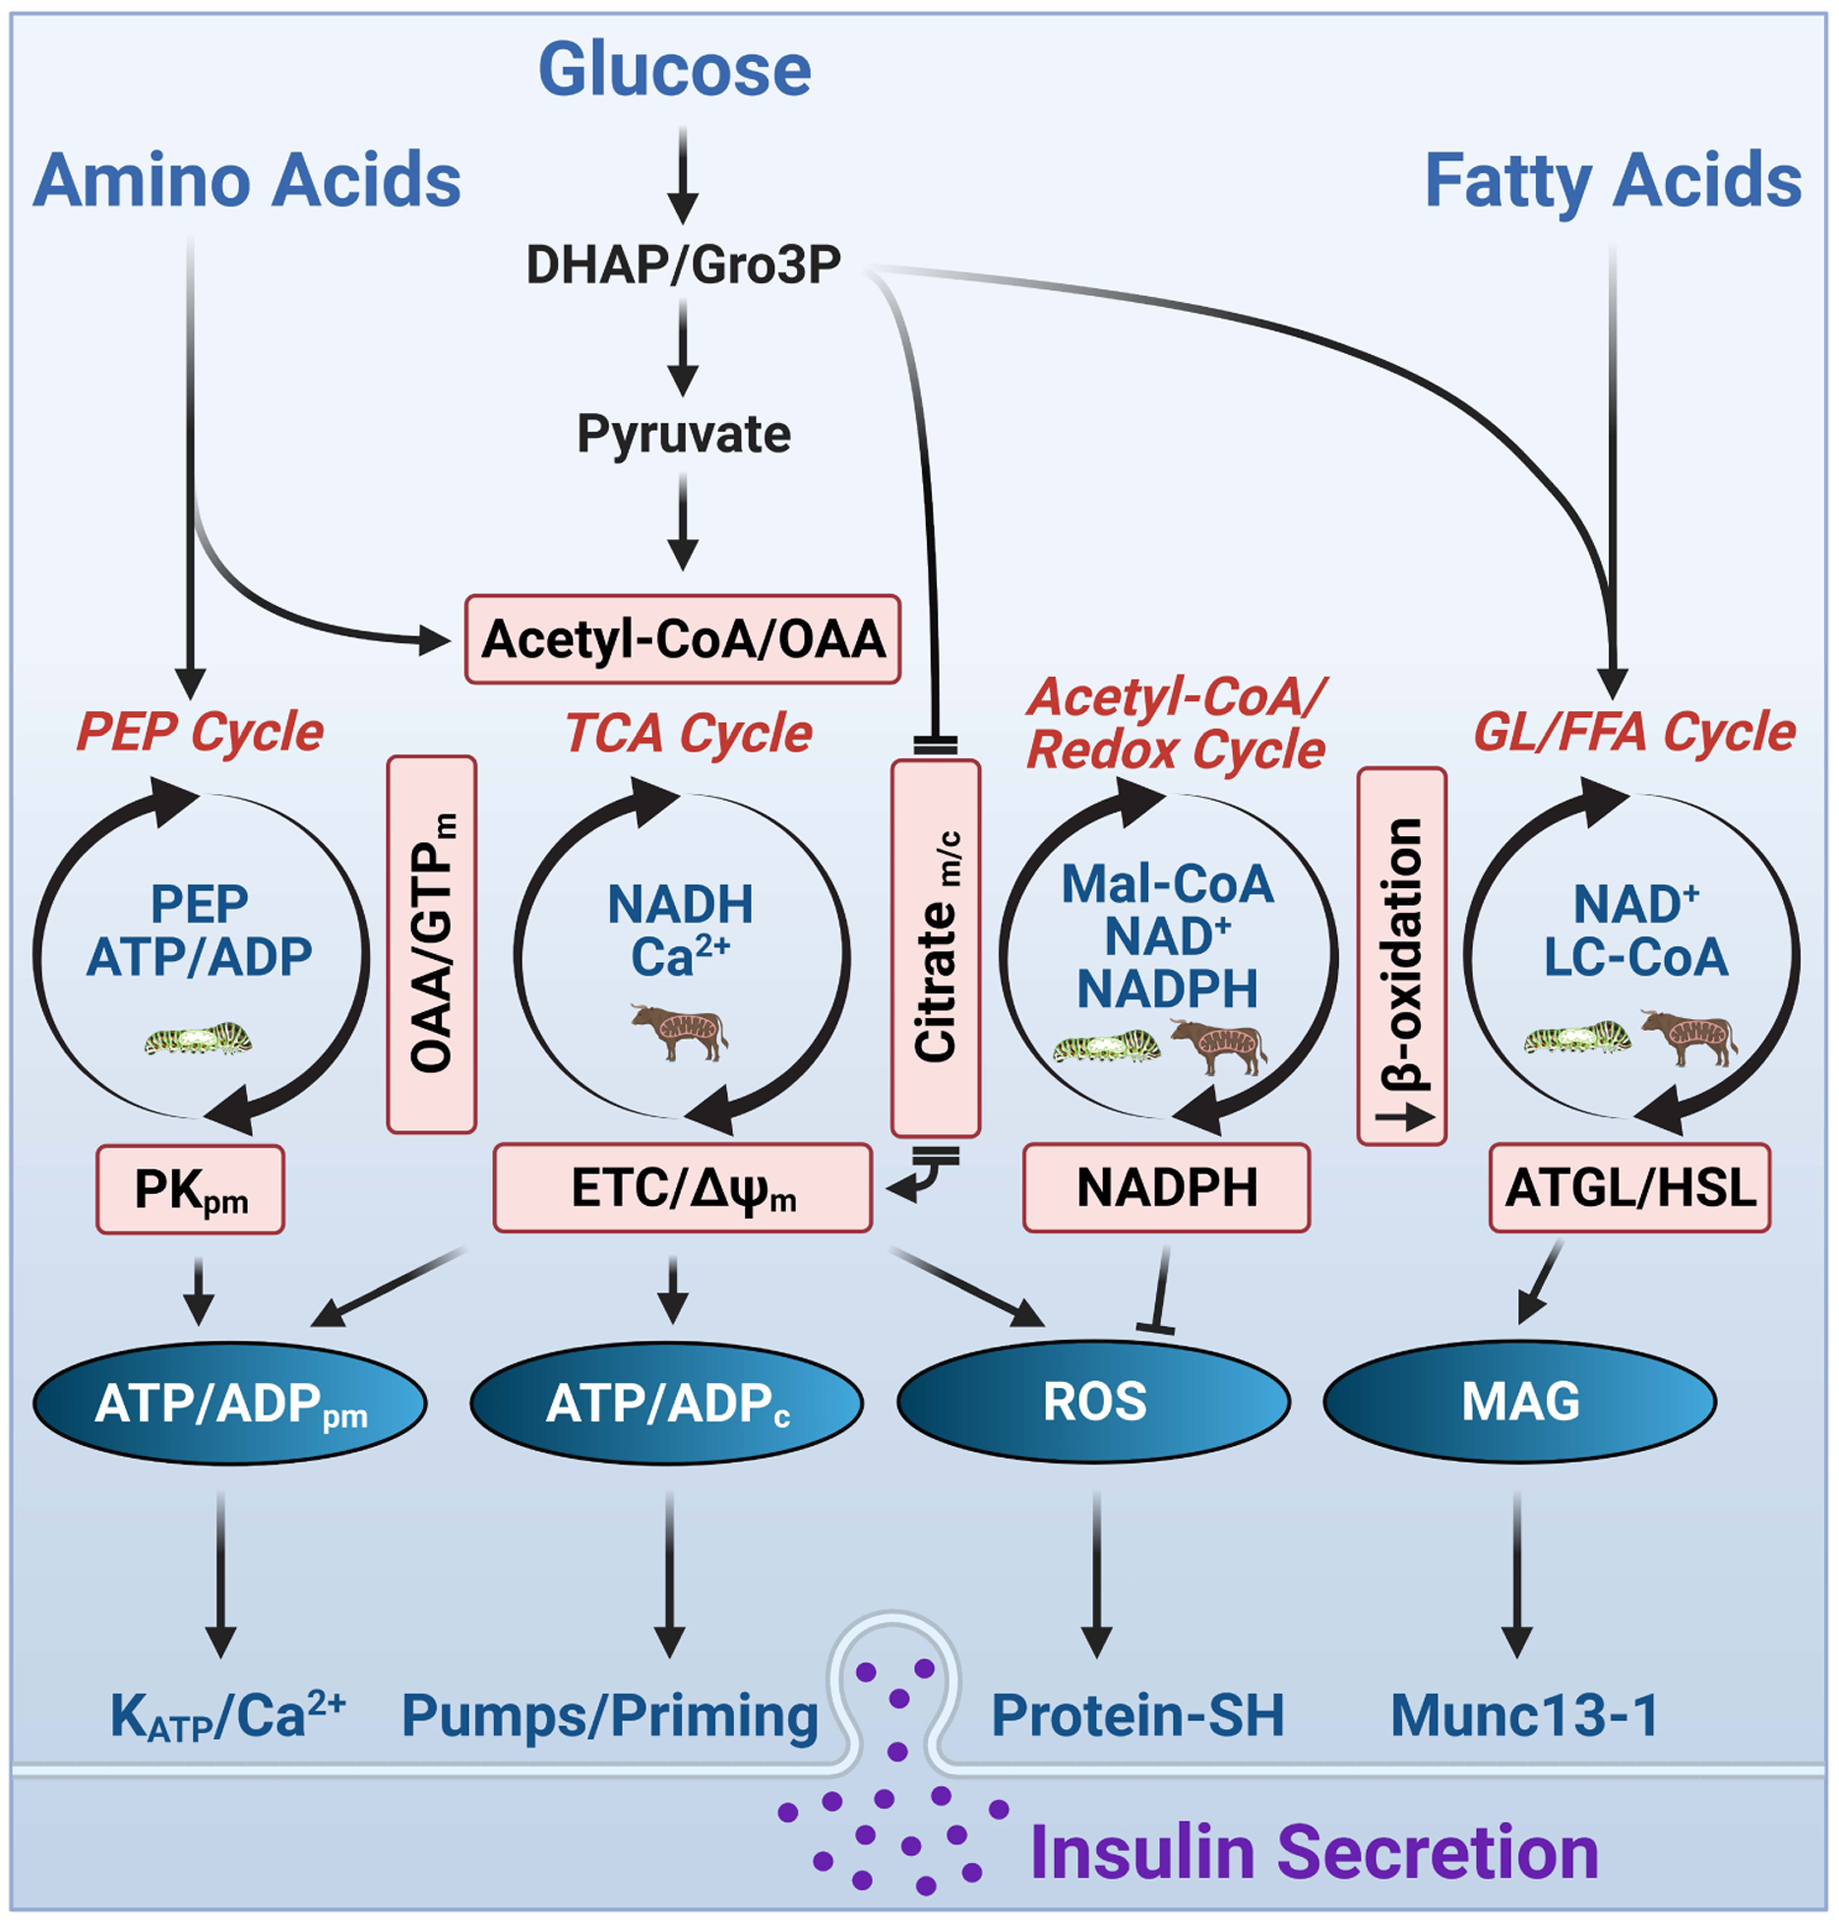
In this review, we focus on recent developments in our understanding of nutrient-induced insulin secretion that challenge a key aspect of the "canonical" model, in which an oxidative phosphorylation-driven rise in ATP production closes KATP channels. We discuss the importance of intrinsic β cell metabolic oscillations; the phasic alignment of relevant metabolic cycles, shuttles, and shunts; and how their temporal and compartmental relationships align with the triggering phase or the secretory phase of pulsatile insulin secretion. Metabolic signaling components are assigned regulatory, effectory, and/or homeostatic roles vis-à-vis their contribution to glucose sensing, signal transmission, and resetting the system. Taken together, these functions provide a framework for understanding how allostery, anaplerosis, and oxidative metabolism are integrated into the oscillatory behavior of the secretory pathway. By incorporating these temporal as well as newly discovered spatial aspects of β cell metabolism, we propose a much-refined MitoCat-MitoOx model of the signaling process for the field to evaluate.


Conflict of interest statement

Declaration of interests The authors declare no competing interests.

Figures

Figure 1.
Figure 1.. Reconsidering the canonical model of glucose-stimulated insulin secretion.
(A) In the canonical model, glucose metabolism drives an initial rise in ATP/ADP ratio via oxidative phosphorylation (OxPhos) that plays the dominant role in both KATP channel closure and ATP production to sustain exocytosis. (B) A new spatially and temporally compartmentalized model of stimulus-secretion coupling, termed the MitoCat-MitoOx model, is motivated by the recent discovery that plasma membrane-associated pyruvate kinase (PKpm), rather than OxPhos, locally generates the rise in ATP/ADP to close KATP channels and initiate insulin secretion. OxPhos has been repositioned after KATP closure, membrane depolarization and the rise in cytosolic Ca2+ to highlight its complimentary role in generating ATP to sustain secretion. While the figure shows that MitoCat and MitoOx are separated by the onset of membrane depolarization, they are not all or none processes. It remains possible that OxPhos may help to sustain KATP channel closure after the channel is initially closed by PK and the PEP cycle. Abbreviations: ATP/ADPc, cytosolic ATP/ADP ratio; ATP/ADPpm, plasma membrane ATP/ADP ratio; ΔΨp, plasma membrane potential.
Figure 2.
Figure 2.. Allosteric regulation of glycolysis and oscillations of β-cell metabolism and insulin secretion during MitoCat and MitoOx.
(A) Phosphofructokinase-1 (PFK1), responding to activation by its product fructose 1,6-bisphosphate (F1,6BP), generates glycolytic oscillations that separate the phases of upper glycolysis (red) and lower glycolysis (blue), while pyruvate kinase (PK) controls glycolytic efflux. During MitoCat the lower glycolytic metabolite levels rise, as the flux through PFK1 increases while PK is slowed by rising ATP/ADP; oscillations in post-PK metabolites (red) are out of phase with lower glycolysis due to rapid metabolism of pyruvate by mitochondria. During MitoOx the fall in ATP/ADP stalls PFK1 and maximizes flux through PK, causing a crash in the lower glycolytic metabolite levels. (B) Oscillations in glycolysis and anaplerosis-cataplerosis during MitoCat (blue) are matched by antiphase oscillations in Ca2+, ADP, TCA cycle activity and OxPhos during MitoOx (red). Importantly, PK is localized to both the mitochondrial and plasma membranes. This compartmentation of PK is central to β-cell oscillatory metabolism and insulin secretion. Before plasma membrane depolarization, during MitoCat, PFK1 generates F1,6BP to activate PK, which lowers ADP at the inner mitochondrial membrane, reducing flux through the adenine nucleotide translocator (ANT), slowing the ETC (which becomes ADP-starved and state 4-like) and therefore TCA cycle, while activating anaplerosis/cataplerosis and the phosphoenolpyruvate (PEP) cycle. During the PEP cycle, anaplerosis (filling of TCA cycle intermediates) is due to the PC reaction that carboxylates pyruvate to oxaloacetate, whereas cataplerosis (egress of the TCA cycle intermediates to the cytosol) results from the exit of mitochondrial PEP to the cytosol following the mitochondrial PEP carboxykinase (PCK2) reaction. PEP then exits the mitochondrion to feed mitochondrial and plasma membrane PK. While PK reinforces the PEP cycle, plasma membrane compartmentalized PK drives a rise in ATP/ADP that closes KATP channels. Following membrane depolarization and the rise in Ca2+, during MitoOx, the high workload (i.e. ATP hydrolysis) associated with ion pumping and insulin secretion restores ADP and increases flux through the ETC (which is now ADP replete and state 3-like), the TCA cycle, and lower glycolysis. Abbreviations: DHAP, dihydroxyacetone phosphate; ETC, electron transport chain; F6P, fructose 6-phosphate; F2,6BP, fructose 2,6-bisphosphate; G3P, glyceraldehyde 3-phosphate; 2PG, 2-phosphoglycerate; 3PG, 3-phosphoglycerate, GK, glucokinase; G6P, glucose 6-phosphate; PC, pyruvate carboxylase; PCK2, phosphoenolpyruvate kinase 2; PDH, pyruvate dehydrogenase; PFKFB, phosphofructo-2-kinase/fructose 2,6-bisphosphatase.
Figure 3.
Figure 3.. Metabolic coupling factors and homeostatic signal removers are temporally compartmentalized.
Glucose metabolism via phosphofructokinase-1 (PFK1) creates two metabolic states separated in time: an initial increase in mitochondrial anaplerotic/cataplerotic fluxes (termed MitoCat), followed by enhanced OxPhos (MitoOx) (see Fig. 2). Viewed sequentially, the net result of glycolysis during MitoCat is a pyruvate kinase (PK)-driven reduction in ADP that is sensed by the mitochondrial adenine nucleotide translocase and therefore ATP synthase, causing increased voltage across the mitochondrial inner membrane (ΔΨm), slowing NADH consumption by the electron transport chain, and increasing signals for secretion. These MitoCat “on” signals (blue boxes) include both regulatory and effectory metabolic coupling factors. Several MitoCat signals, such as PEP, plasma membrane ATP/ADP (ATP/ADPpm) and reactive oxygen species (ROS), participate in both the triggering and amplification arms of glucose-stimulated insulin secretion. Following KATP closure by plasma membrane PK (PKpm)-driven ATP/ADPpm, membrane depolarization and Ca2+ influx terminates the MitoCat phase by initiating a cascade of MitoOx processes that consume ATP, including ion pumping and exocytosis. The ensuing rise in ADP stimulates respiration, increasing cytosolic ATP (ATPc) that provides energy to sustain secretion until homeostatic signal removers (inset red box) reset the membrane potential. A rise in cytosolic ADP plays key role in this resetting as it will activate PFK1 and PK, which control oscillations in glycolysis. Abbreviations: ABHD6, α/β-hydrolase domain containing 6; KATP, ATP-sensitive K+ channels; KCa, Ca2+-activated K+ channels; Kv, voltage-dependent K+ channels; LC-CoA long chain acyl-CoA; MAG, monoacylglycerol; Mal-CoA, malonyl-CoA; PDE, phosphodiesterase; PMCA, plasma membrane Ca2+ ATPase; RRP, readily-releasable pool; SERCA, sarco/endoplasmic reticulum Ca2+-ATPase; ΔΨpm, plasma membrane potential.
Figure 4.
Figure 4.. Allosteric and Ca2+ regulation of mitochondrial enzymes dictates the mitochondrial cycles, shuttles, and shunts during MitoCat and MitoOx.
(A) MitoCat is a high-energy mitochondrial state-4-like condition that exerts strong allosteric control over the PEP cycle, the TCA cycle, and the ETC through increased ATP/ADP, NADH/NAD+, Ac-CoA/CoA and Suc-CoA/CoA ratios. Key to MitoCat is the blockade of isocitrate dehydrogenase (IDH2 and IDH3), and α-ketoglutarate dehydrogenase (αKGDH), an energy level sensor in the mitochondrial matrix that supports the following events through partial TCA cycle blockade: anaplerosis and increased matrix oxaloacetate levels via allosteric activation of PC stimulated by a rise in acetyl-CoA; cataplerotic output of citrate and the formation of cytosolic acetyl-CoA and malonyl-CoA (Mal-CoA), which is also favored by cytosolic IDH1 inhibition; enhanced PCK2 flux and PEP cycle activity promoted via oxaloacetate production. The accompanying rise in NADH drives reactivate oxygen species (ROS) production by the ETC in this low ADP state. (B) During MitoOx, ADP activates OxPhos, reduces ΔΨm, and fully engages the TCA cycle. Ca2+-activated dehydrogenases are critical to support an NADH burst for OxPhos, and ADP activation of IDH2 and IDH3 reinforces citrate commitment to the TCA cycle for ATP production to cope with the workload of insulin secretion. (C, D) Putative assignments of metabolic cycles (blue boxes), as well as NADH and NADPH shuttles and shunts (orange and green boxes, respectively), and are shown for MitoCat (C) and MitoOx (D). GAPDH during glycolysis reduces NAD+ in the cytosol that has to be reoxidized during MitoCat to maintain glycolytic flux. This occurs through the acetyl-CoA shuttle, the aspartate-glutamate exchange, as well as the glycerol shunt and the glycerolipid/fatty acid cycle (not shown). During MitoOx, NAD+ is reoxidized via the malate-aspartate shuttle, the Gro3P shuttle, or pyruvate lactate exchange performed by LDH. During MitoCat, succinyl-CoA (Suc-CoA) that supports mitochondrial GTP synthesis for the PCK2 reaction during the PEP cycle is generated from succinate by SUCLA2 in reverse mode that uses ATP. The increased Suc-CoA can then drive GTP synthesis by SUCLG2 (PEP cycle SUCLA2-ATP). Alternatively, in a variant PEP cycle (OXCT1-AcAcCoA), Suc-CoA and mitochondrial GTP are generated from AcAc-CoA via the action of OXCT1. However, during MitoOx, Suc-CoA is directly generated by αKGDH in the TCA cycle (not shown). NADPH can be generated in the cytosol by the pentose phosphate pathway (not shown) or the pyruvate-malate shuttle during MitoCat or from electron transfer from the mitochondria to the cytosol through the malic enzyme (ME) shuttle, the isocitrate dehydrogenase (IDH) shuttle, or the IDH shunt during MitoOx. Abbreviations: AcCoA, acetyl-CoA; AcAcCoA, aceto-acetyl-CoA; DIC, dicarboxylate carrier; GPD1, cytosolic glycerol 3-phosphate dehydrogenase; GPD2, mitochondrial membrane associated glycerol 3-phosphate dehydrogenase; GOT1, glutamic-oxaloacetic transaminase; Gro3P, glycerol 3-phosphate; GTPm, mitochondrial GTP; OGC, oxoglutarate carrier; ME, malic enzyme; MDH, malate dehydrogenase; MPC, mitochondrial pyruvate carrier; OXCT1, 3-oxoacid CoA transferase, also called SCOT1; Pyr-Mal shuttle, pyruvate-malate shuttle; SUCLA2, ATP-specific succinyl-CoA synthase; SUCLG2, GTP specific succinyl-CoA synthase; ACLY, ATP citrate lyase; NNT, nicotinic nucleotide transhydrogenase; LDH, lactate dehydrogenase; PDH, pyruvate dehydrogenase, PC, pyruvate carboxylase; PCK2, mitochondrial PEP carboxykinase.
Figure 5.
Figure 5.. Model illustrating the redox cycles and the roles of ROS and NADPH in controlling insulin exocytosis and recovery.
Cellular redox is communicated differently between mitochondria and cytosol during MitoCat and MitoOx. During MitoCat (left) mitochondrial NADH is elevated leading to ROS production via the ETC, NNT activation, and efflux of malate to the cytosol via the pyruvate-malate shuttle. This leads to cytosolic NADPH formation by malic enzyme (ME1) allowing ROS production in part via NOX4. ROS efflux from the mitochondria and generation via NOX4 modifies reactive cysteines in susceptible proteins involved in exocytosis that primarily favor insulin secretion. During MitoOx (right), NADH is consumed to support respiration and cytosolic NADPH is formed as a result of isocitrate transport to the cytosol as part of the IDH shunt and IDH shuttle, the latter associated with Ca2+-dependent IDH2 activity in reverse mode, in the direction of α-ketoglutarate to isocitrate. During metabolic oscillations both mitochondrial and cytosolic NADPH help convert H2O2 to H2O and restore ROS to basal levels. Cytosolic NADPH has dual effects on insulin exocytosis. During MitoCat NADPH-dependent NOX4 generates H2O2 which promotes exocytosis, whereas NADPH produced during MitoOx inhibits exocytosis, thus preventing excessive secretion by reducing the activity of thiol redox sensitive exocytosis effector(s). Abbreviations: IDH, isocitrate dehydrogenase; αKG, α-ketoglutarate; NOX4, NADPH oxidase 4; NNT, nicotinic nucleotide transhydrogenase; Px, peroxidase.
Figure 6.
Figure 6.. Familial hyperinsulinemic hypoglycemia (HHF): human genetic clues to the metabolic mechanisms of insulin secretion.
Several inborn errors of metabolism associated with congenital hyperinsulinemia intersect with pathways that inappropriately increase insulin release. Gain-of-function (GOF) mutations in glucokinase (red, HHF3) and ectopic expression of the lactate transporter (teal, MCT1/HHF7) increase pyruvate delivery to the mitochondria. GOF in glutamate dehydrogenase (green, GLUD1/HHF6), from loss of mitochondrial GTP inhibition, increases glutamate anaplerosis by providing α-ketoglutarate (αKG), mitochondrial GTP and mitochondrial PEP in the setting of a protein rich meal. Loss-of-function (LOF) of SCHAD (blue, HADH/HHF4) promotes hyperinsulinemia via three potential mechanisms: restriction of AcAc-CoA clearance to β-hydroxybutryate-CoA (βOHB-CoA) to favor succinyl-CoA generation by SCOT1/OXCT1, promoting activity of the PEP cycle; the clearance of LC-CoAs to AcCoA, thus favoring LC-CoA accumulation; disinhibition of GDH to favor anaplerosis via provision of αKG. A novel HHF has been proposed from LOF of the four carbon (C4) carboxylate exchanger (purple, UCP2), which may promote hyperinsulinemia by altering anaplerosis-cataplerosis and/or ΔΨm. Abbreviations: ACAT1, acetyl-CoA acetyltransferase 1; Ac-CoA, acetyl-CoA; AcAcCoA, acetoacetyl-CoA; GDH, glutamate dehydrogenase; GK, glucokinase; αKG, α-ketoglutarate; LDH, lactate dehydrogenase; LC-CoA, long chain acyl-CoA; MCT1, lactate/pyruvate transporter; OAA, oxaloacetate; PEP, phosphoenolpyruvate; PC, pyruvate carboxylase; PCK2, mitochondrial PEP carboxykinase; PDH, pyruvate dehydrogenase; PK, pyruvate kinase; SUCLG2, GTP specific succinyl-CoA synthase; SCHAD, short-chain acyl-CoA dehydrogenase/HADH; SCOT1, succinyl-CoA:3-ketoacid coenzyme A transferase/OXCT1; UCP2, uncoupling protein 2.
Figure 7.
Figure 7.. Integrated metabolic cycles of nutrient induced insulin secretion.
Glucose metabolism in the β-cell drives the oscillatory activity of four interconnected metabolic cycles (PEP, TCA, Acetyl-CoA/Redox, and GL/FFA) that produce regulatory metabolic coupling factors (blue text within the cycles) and effectory metabolic coupling factors (white text within ovals) controlling the distal steps of insulin secretion. The relationships of each of these cycles with the highest activities of MitoCat and MitoOx are shown within the cycles. Some amino acids, like alanine and glutamine, feed the Krebs cycle via the production of Ac-CoA, OAA, and αKG. The TCA and PEP cycles are interlinked by OAA and mitochondrial GTP; the TCA and Ac-CoA/redox cycles are interlinked by citrate and other TCA cycle intermediates; the Ac-CoA/redox and GL/FFA cycles are interlinked by citrate-derived malonyl-CoA, which inhibit fat oxidation, thus preventing the removal of GL/FFA cycle intermediates. FFA promotes insulin secretion via lipolysis derived MAG, which activates the exocytotic effector Munc13–1, and also via the plasma membrane receptor FFAR1 (not shown). NADPH prevents excessive ROS accumulation and possibly excessive insulin secretion as well. Abbreviations: ATGL, adipose triglyceride lipase; DHAP, dihydroxyacetone phosphate; GTPm, mitochondrial GTP; Gro3P, glycerol 3-phosphate; GL/FFA, glycerolipd/free fatty acid; HSL, hormone sensitive lipase; LC-CoA, long-chain acyl-CoA; Mal-CoA, malonyl-CoA; MAG, monoacylglycerol; OAA, oxaloacetate; PEP, phosphoenolpyruvate.

References

    1. Abulizi A, Cardone RL, Stark R, Lewandowski SL, Zhao X, Hillion J, Ma L, Sehgal R, Alves TC, Thomas C, Kung C, Wang B, Siebel S, Andrews ZB, Mason GF, Rinehart J, Merrins MJ, Kibbey RG, 2020. Multi-Tissue Acceleration of the Mitochondrial Phosphoenolpyruvate Cycle Improves Whole-Body Metabolic Health. Cell Metab 32, 751–766.e11. 10.1016/j.cmet.2020.10.006 - DOI - PMC - PubMed
    1. Adams MT, Dwulet JM, Briggs JK, Reissaus CA, Jin E, Szulczewski JM, Lyman MR, Sdao SM, Kravets V, Nimkulrat SD, Ponik SM, Merrins MJ, Mirmira RG, Linnemann AK, Benninger RK, Blum B, 2021. Reduced synchroneity of intra-islet Ca2+ oscillations in vivo in Robo-deficient β cells. Elife 10, e61308. 10.7554/eLife.61308 - DOI - PMC - PubMed
    1. Affourtit C, Alberts B, Barlow J, Carré JE, Wynne AG, 2018. Control of pancreatic β-cell bioenergetics. Biochem. Soc. Trans 46, 555–564. 10.1042/BST20170505 - DOI - PubMed
    1. Affourtit C, Brand MD, 2009. Measuring mitochondrial bioenergetics in INS-1E insulinoma cells. Methods Enzymol 457, 405–424. 10.1016/S0076-6879(09)05023-X - DOI - PubMed
    1. Affourtit C, Brand MD, 2006. Stronger control of ATP/ADP by proton leak in pancreatic beta-cells than skeletal muscle mitochondria. Biochem J 393, 151–159. 10.1042/BJ20051280 - DOI - PMC - PubMed

Publication types

MeSH terms

LinkOut - more resources